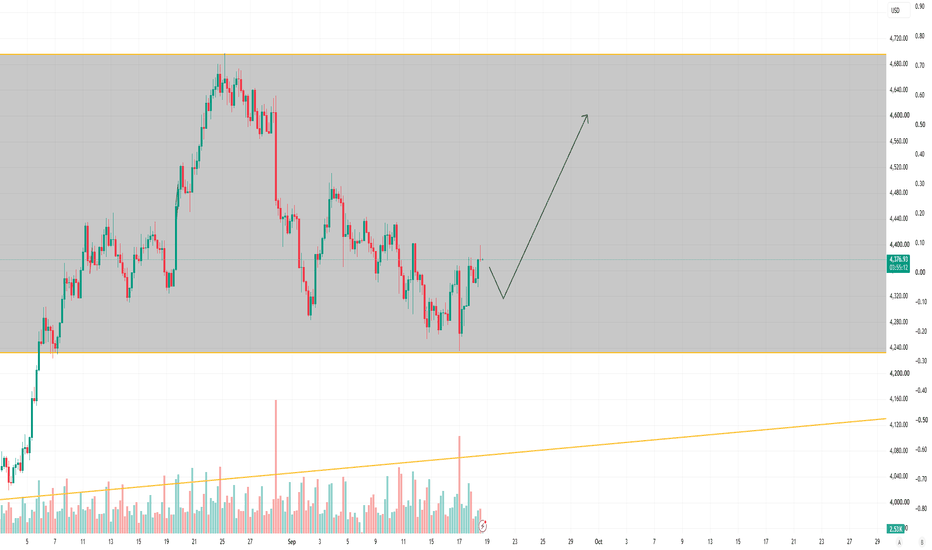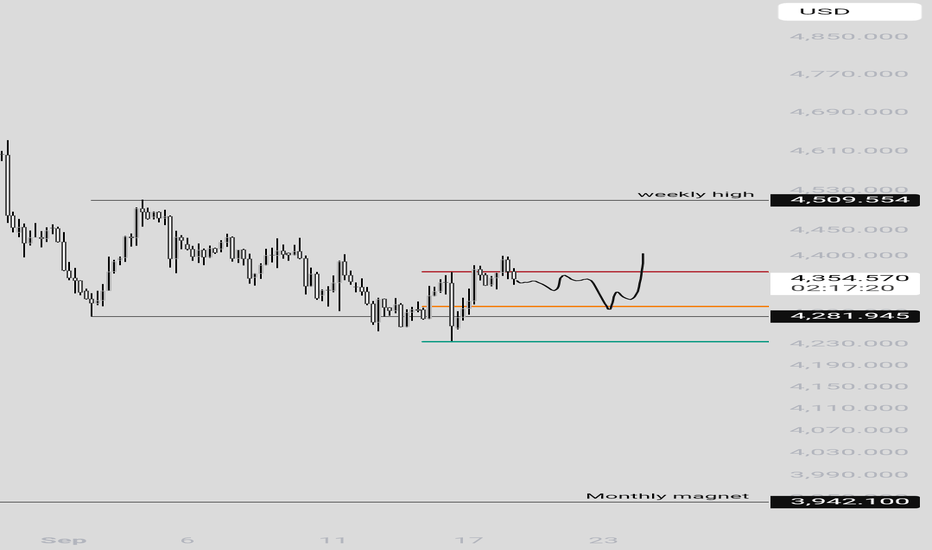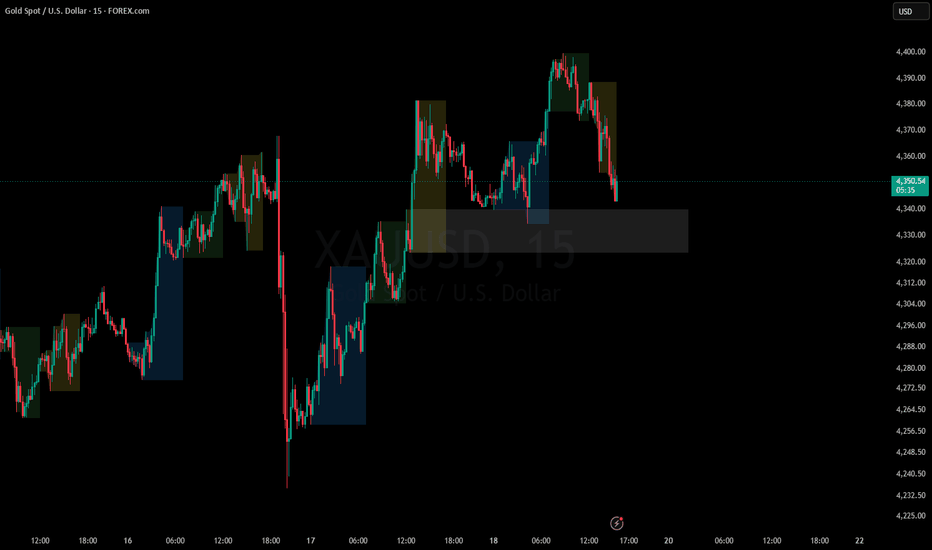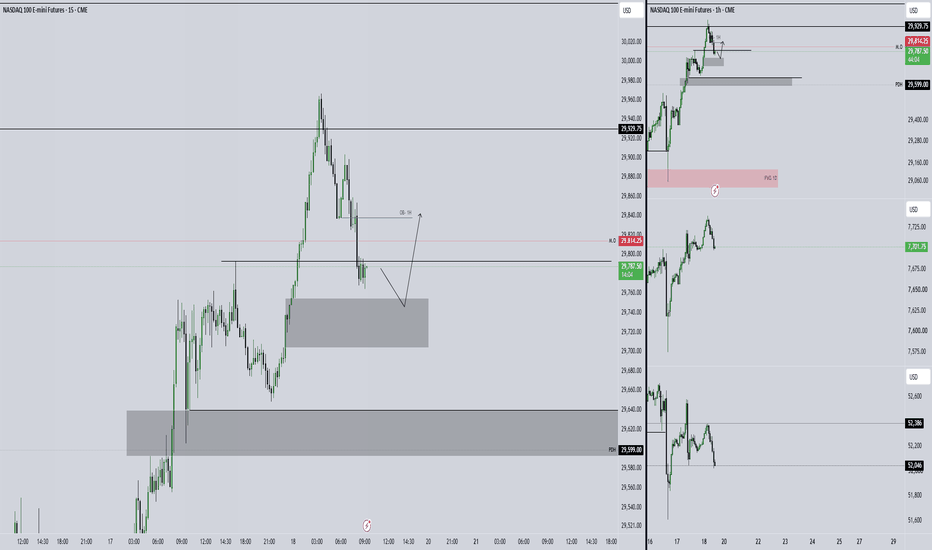
Futures market
## GOLD (XAU/USD) – 2-Hour Chart Analysis (Swing Pattern)## GOLD (XAU/USD) – 2-Hour Chart Analysis (Swing Pattern)
1. Gold continues to maintain a **strong bearish market structure**, consistently forming **lower highs and lower lows**, confirming that sellers remain firmly in control.
2. The chart shows a well-defined **swing pattern**, where every recovery rally has failed below the previous swing high, indicating persistent selling pressure.
3. The **₹3,950–₹3,900** zone (marked in red) is the most critical support area. This level has acted as a demand zone multiple times and is now the deciding level for the next major move.
4. If Gold **breaks and closes below ₹3,950**, it would complete another **Lower Low (LL)** in the swing sequence, confirming the continuation of the prevailing downtrend.
5. Such a breakdown is likely to trigger **impulsive selling**, as long positions may exit while fresh short positions enter below this key support.
6. Based on the current swing structure, the first downside objective lies around **₹3,800–₹3,780**, followed by the major support near **₹3,740**, which is also highlighted on the chart.
7. The repeated failure of buyers to create a **Higher High (HH)** indicates that every bounce is currently a **sell-on-rise opportunity** rather than the beginning of a new uptrend.
8. The bearish swing pattern will remain valid as long as Gold trades below the recent swing high near **₹4,080–₹4,100**. A sustained breakout above this zone would weaken the current bearish outlook.
9. Traders should closely monitor the **₹3,950 support**, as a high-volume breakdown below this level could significantly accelerate downside momentum.
10. **Overall Outlook: Bearish (9/10)** with the expected path: **₹4,020 → ₹3,950 (Breakdown) → ₹3,800 → ₹3,740**, while **₹4,100** remains the key resistance and invalidation level for the bearish swing structure.
---
### Disclaimer
> **Disclaimer:** This analysis is based on swing structure, price action, market structure, support and resistance levels, and the current technical setup. It is intended **solely for educational and informational purposes** and **should not be considered financial or investment advice**. Financial markets are inherently volatile, and no technical analysis can guarantee future price movements. Please conduct your own research and consult a qualified financial advisor before making any investment or trading decisions.
XAUUSD SMC Analysis: Price Rejects Supply at Key Discount ZonneThe H1 chart analysis of XAUUSD utilizes Smart Money Concepts to map out structural shifts, liquidity pools, and institutional zones. Currently, the overall market structure remains dominantly bearish. Following a major Break of Structure to the downside, the market initiated a series of internal Changes of Character. While this corrective rally successfully swept short-term buy-side liquidity, the upward momentum was strongly capped by a prominent bearish Fair Value Gap resting between the 4,080 and 4,105 price levels. This premium supply zone served as a major institutional point of interest where significant sell orders were triggered, resulting in a swift decline back toward the 4,000 liquidity pool.
A Fibonacci retracement grid plotted on the recent minor swing leg highlights the current market equilibrium and discount areas. The premium zone aligns perfectly with the newly mitigated Fair Value Gap, where the 0.236 and 0.382 retracement levels sit. The price has already pushed past the 0.5 Equilibrium level at 4,055.00 and is currently trading down at 4,028.05, testing the crucial 0.786 deep discount level at 4,029.00. The current candle shows the price struggling to sustain any upward momentum as it hovers directly on this key discount threshold.
The prevailing institutional order flow remains bearish after the successful mitigation of the premium Fair Value Gap. If the price fails to hold the 0.786 discount level on the H1 close, we expect a strong continuation of the bearish trend. This scenario will likely target the sell-side liquidity resting below the 3,990 swing low. Alternatively, a short-term bullish reaction may only occur if we observe a clear lower-timeframe shift in structure at this discount level, targeting a potential retest of the 0.5 Equilibrium level.
XAUUSD: Bearish Trends, Another Sell Opportunity Coming!XAUUSD is positioned on descending channel momentum, trending on a long bearish of lower lows and lower highs. Price keep respecting both the low support and the high resistance zones, in regards to the structure. Price is gradually heading towards the trendline resistance, as we anticipate a sell retracement, within $4,030-$4,040, levels.
A clear reverse below this levels, triggers a sell continuation down to $3,952, as next potential low.
Thanks for reading.
Bearish forces dominate market sentiment and suppress pricesBearish forces dominate market sentiment and suppress prices
🌐1. The Fed's hawkish stance has solidified: Dallas Fed President Logan (a voting FOMC member this year) publicly stated that a single month of improved inflation data is insufficient to meet anti-inflation goals; she explicitly called for moderate rate hikes to ensure price stability, becoming the first policymaker to publicly support further hikes under Chair Warsh. Meanwhile, Fed Vice Chair Jefferson and Chair Warsh reiterated that the option for rate hikes remains on the table until the 2% inflation target is met, and a "higher-for-longer" interest rate path remains the baseline policy; consequently, the opportunity cost of holding non-yielding gold remains high.
💠2. Economic fundamentals offer no recession-driven case for rate cuts: High-frequency data on retail sales, employment, and manufacturing all demonstrate the resilience of the US economy, leaving no fundamental justification for the Fed to loosen policy due to a "hard landing" recession. CME interest rate tools show the probability of a 25-basis-point hike in September rising to 56.2%, with the cumulative probability of a hike before year-end approaching 75%; thus, a bullish rally lacks a long-term narrative to support it.
⛽3. Geopolitics and oil prices drive inflation, creating headwinds for gold: US-Iran tensions have crossed "red lines" regarding civilian targets, with US airstrikes hitting Iranian nuclear facilities and port infrastructure, and Iran attacking Kuwaiti power facilities. Commercial shipping traffic through the Strait of Hormuz has dropped to a three-week low, and crude oil prices surged nearly 16% in a single week. The market's transmission logic is fixed: crude oil spikes → energy-driven inflation rebounds → the Fed is forced to maintain tightening or even hike rates → safe-haven capital flows into the US dollar rather than gold. Geopolitical conflict no longer acts as a traditional bullish driver for gold; instead, it creates risks of future inflation that suppress upward price momentum.
WTI Crude Oil Eyes 78.50 After Supply Zone ReversalKey Price Levels
Resistance
82.80–83.10 – Strong supply zone and recent rejection.
81.00–81.20 – Previous breakout zone that may act as resistance if retested.
Support
80.90–81.00 – First demand area.
78.40–78.60 – Major support and previous consolidation range.
75.80–76.10 – Strong demand zone if selling accelerates.
Technical Outlook
The recent rejection from the upper supply zone suggests buyers are taking profits while sellers defend the highs. A sustained move below 81.00 would confirm a bearish retracement and increase the likelihood of a decline toward 78.50.
The projected path on the chart indicates:
Rejection from the supply zone.
Weak pullback toward 81.00.
Brief consolidation or retest.
Continuation lower toward 78.50.
If bearish momentum remains strong, price could extend toward 76.00.
Bullish Invalidation
The bearish outlook becomes invalid if buyers reclaim the upper supply zone with a strong 1-hour candle close above 83.10. Such a breakout could trigger another leg higher and resume the primary uptrend.
Trading Idea
Sell Setup
Entry: On rejection around 82.00–82.30 or after a confirmed break below 81.00.
Stop Loss: Above 83.10.
Take Profit 1: 80.90
Take Profit 2: 78.50
Take Profit 3: 76.00
Conclusion
WTI Crude Oil is showing signs of exhaustion after reaching a key resistance zone. As long as price remains below 83.10, the bias favors a bearish correction, with 78.50 as the primary downside target and 76.00 as an extended objective if selling pressure strengthens.
XAUUSD SELL SHORTXAUUSD SELL SHORT
- - XAUUSD / GOLD Bearish Market structure Shift on HTF , After Daily BPR Mitigate and Major BSL Liquidate then , on H4 TF When Market will reach out the H4 Mitigated SIBI , after H4 2nd SIBI Liquidate our entry on 1st SIBI , go to LTF ( H1 / M15 ) after Liquidity Sweep & See a Valid MSS Conformation Then Enter with Proper SL & Hold for a Long Target ( aprox 30 hndl SL n 150 hndl TP ) , Target SSL .
NOTE :- IN LTF after Valid Mss then Enter , Use For Sell Entry Use SIBI / BPR / AB / OB / PB / SPLZ
- Enjoy Floks ..........................................
..........................................................
..........................................................
..........................................................
Silver Short IdeaSilver is testing a key pivot level as resistance. This area has been support and resistance multiple times. We have descending trend line resistance above as well. Technically, this calls for a short trade until the resistance breaks clearly.
Disclaimer: This is for education purpose only and not financial advice.
XAU / USD 4 Hour ChartHello traders. As we get into the trading week, although I don't take trades when the market first opens, this current 4 hour chart shows my areas of interest pertaining to potential scalp buy sell trades. All this is speculation and just an idea. Let's see how things play out. It's all pretty choppy to when you look to the left, so for me I will wait a day or two to see what direction we go and where supports form. Big G gets all my thanks. Be well and trade the trend.
Seize this opportunity presented by the rise in gold prices.Gold remains under pressure as traders digest the latest U.S. inflation data and shift their attention toward upcoming U.S. macro releases, including retail sales, jobless claims, and additional Fed commentary. Although CPI eased slightly, Federal Reserve officials continue to emphasize that policy decisions remain data-dependent, keeping Treasury yields elevated and limiting bullish momentum in gold.
From an ICT / Smart Money perspective, XAUUSD continues trading inside a short-term bearish order flow after failing to sustain above the recent BOS.
Price is currently approaching a key intraday demand area, where liquidity may be collected before the next institutional move.
Technical Outlook (M30)
Overall structure remains bearish despite recent bullish impulse.
Price rejected the intraday BOS supply and is now retracing toward a bullish Order Block.
Current decline is targeting sell-side liquidity resting below recent lows.
If buyers defend the demand zone, a recovery toward the premium supply around 4080–4085 remains possible.
Failure to hold the mitigation area could expose the deeper liquidity pool around 3988–3992 before any meaningful reversal.
Key Levels
🔴 Resistance:
4052 – 4055 (FVG)
4080 – 4085 (Institutional Supply)
🟢 Support:
4018 – 4022 (Bullish Order Block)
3988 – 3992 (Major Liquidity Pool)
Trading Scenario
Bullish Case
Hold above 4018–4022
Reclaim the FVG
Target 4080+
Bearish Case
Break below 4018
Sweep liquidity near 3990
Watch for institutional reaction before considering longs.
Market Debate
Is this decline simply an institutional liquidity grab into demand, or will stronger U.S. economic data keep yields elevated and extend Gold's bearish trend?
BRIAN XAUUSD – GOLD IS WEAK, BUT THE LOW VALUE AREA IS NOW THE BRIAN XAUUSD – GOLD IS WEAK, BUT THE LOW VALUE AREA IS NOW THE TRAP ZONE
Gold starts the week struggling around the 4,000 area after recording its biggest weekly decline in six weeks. The broader pressure is still clear: USD demand remains supported by safe-haven flows as the US-Iran conflict extends, while the daily technical setup still leans bearish.
But this is exactly where traders need to slow down.
Gold is weak, yes.
But selling directly into low value is not the same as selling from resistance.
Volume Profile structure
On the H1 chart, price is now trading above the Buy Reaction Base around 4,000 - 4,005 after reacting from the lower buy zone near 3,982.
This area is important because it represents the lower value base of the current profile. If buyers can defend this zone, gold may rotate higher towards the first upper value target.
However, the upside is still limited unless price can reclaim higher liquidity zones with real acceptance. The broader structure remains defensive, so any buy setup here should be treated as a reaction trade, not a full bullish reversal.
Important zones
Buy zone: 3,982
Lower value support and deepest reaction area.
Buy Reaction Base: 4,000 - 4,005
Current decision zone where buyers are trying to defend value.
Bullish Target Zone: 4,075 - 4,080
First major upside target if the rebound continues.
Upper Liquidity Zone: 4,100 - 4,105
Higher resistance where sellers may return strongly.
Trading scenario
Buy reaction from Buy Reaction Base 4,000 - 4,005
Entry:
Look for buy positions only if price holds above 4,000 - 4,005 and shows clear bullish rejection.
Stop Loss:
Below the Buy Reaction Base or below the 3,982 sweep low.
Take Profit:
TP1: 4,035
TP2: 4,075 - 4,080
TP3: 4,100 - 4,105 only if buyers reclaim value with strength
This setup is based on a Volume Profile reaction from low value. It is not a trend reversal setup. It is a controlled rebound trade from a key value base.
Final view
Gold remains vulnerable while the daily structure stays bearish and USD strength remains supported.
But on the intraday chart, price is now sitting near an important lower value area. If buyers defend 4,000 - 4,005, gold can rebound towards 4,075 - 4,080.
If 3,982 breaks cleanly, the bounce fails and sellers regain control.
The real question this week is simple:
Is gold building a reaction from low value, or is this just another pause before the next breakdown?
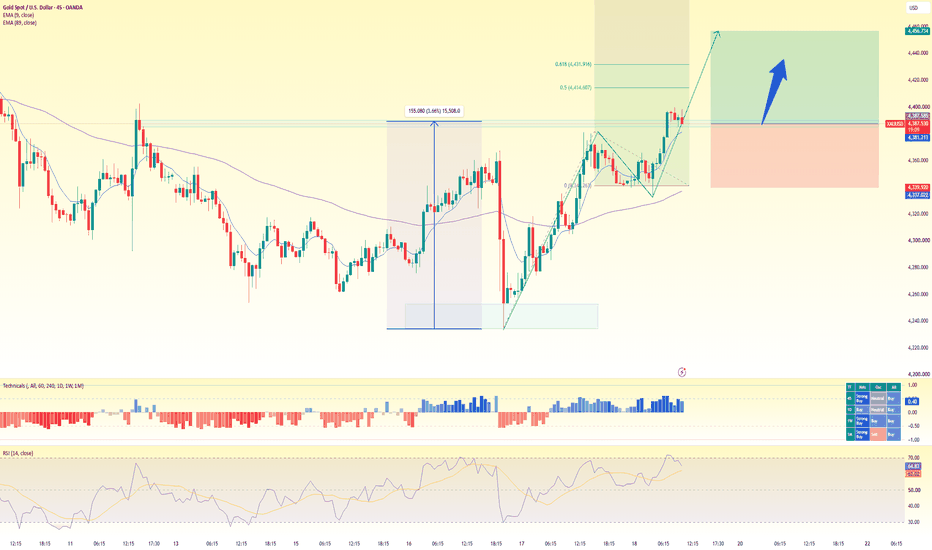
Scalping - Buy gold at 4010 following the trendline.1. Trend
Short-term bias: Bullish.
Price is forming a series of Higher Lows (HL) from the 3,960 area.
A rising trendline is supporting the current recovery.
EMA9 is above price and turning upward, while price is attempting to hold above the short-term bullish structure.
However, EMA89 is still slightly above price, meaning the medium-term trend has not fully turned bullish yet.
➡️ The market is currently in a bullish recovery phase within a broader neutral-to-bearish structure.
2. Key Resistance
4,028–4,030
Immediate resistance.
Previous swing high and H1 supply zone.
A breakout above this level would strengthen bullish momentum.
4,068–4,070
Major resistance.
Next upside target if price confirms a breakout above 4,030.
3. Key Support
4,010–4,012
Immediate support.
Confluence of the rising trendline and recent breakout area.
Holding above this zone keeps the bullish setup valid.
3,982–3,985
Major support.
A break below this area would invalidate the short-term bullish structure and expose the market to further downside.
--------------
BUY GOLD : zone 4010 - 4007
SL : 4002
TP : 4018 - 4030 - 4055
--------------
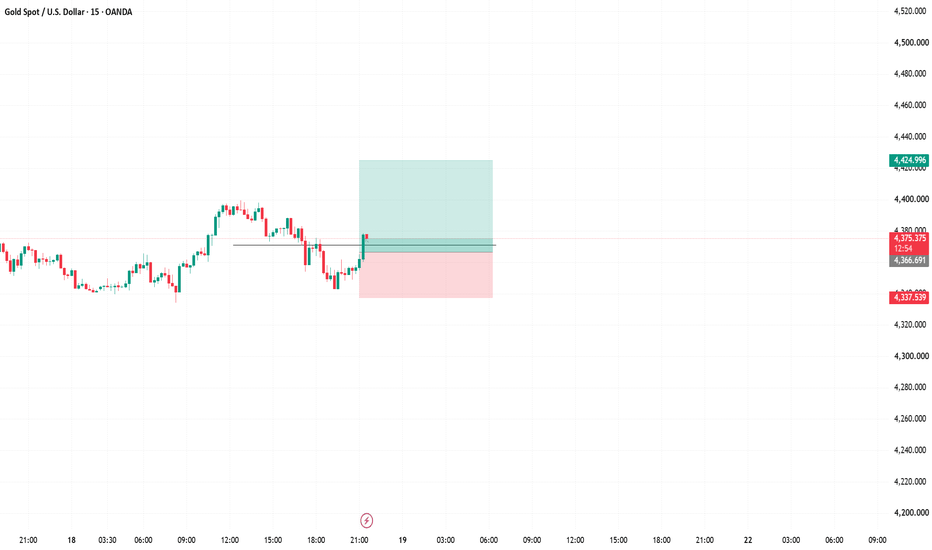
Day 3 Trading Journal | Trade 8 | Running Net P&L -50 pipTrade Plan
Entry: 3995.57
Stop Loss: 3982.90
Take Profit: 4050.27
At 1:1 (4007.74) : I'll book 50% profits and move my stop loss to breakeven, making the remaining position risk-free.
Market Bias
I'm not forcing a direction right now. I'll let the market confirm the move before making any changes.
If price closes below 3980, I'll exit the trade. I'm not closing because of a wick—only a candle close below 3980 will invalidate this setup.
Risk management first. Let the market do the rest.
XAUUSD | Sell Setup ActiveOANDA:XAUUSD
Price has reacted from the Daily PD Array & 4H Rejection Block after sweeping buy-side liquidity. The bias remains bearish, with Sell-Side Liquidity (SSL) as the next target.
⚠️ Trade is already active. New entries should wait for confirmation. Trade at your own risk and always use proper risk management.
#XAUUSD #Gold #SMC #ICT #Forex
XAU/USD Market Outlook 20 - 24 July 2026🥇 XAU/USD Market Outlook 20 - 24 July 2026
Gold is attempting to stabilize after last week's selloff, but the bigger picture remains bearish. While safe-haven demand is being supported by escalating Middle East tensions, expectations that interest rates will remain higher for longer continue to limit upside.
🌍 Fundamental Analysis
The market remains caught between two competing themes.
🟢 Bullish Drivers
* Geopolitical tensions continue to escalate as the US and Iran exchange military strikes.
* Ongoing attacks around the Strait of Hormuz have increased fears of supply disruptions.
* Iran's attempts to restrict shipping traffic have pushed Brent crude back above $90/barrel, increasing market uncertainty.
* Safe-haven flows continue to support gold whenever geopolitical headlines worsen.
* Central bank buying and long-term sovereign debt concerns remain supportive for gold over the longer term.
🔴 Bearish Drivers
Despite the geopolitical backdrop, the stronger macro picture still favors the US Dollar.
* Rising oil prices increase inflation risks.
* Sticky inflation could force the Federal Reserve to keep interest rates elevated for longer.
* Cleveland Fed President Beth Hammack recently suggested further tightening may still be necessary if inflation remains persistent.
* Higher Treasury yields increase the opportunity cost of holding non-yielding assets like gold.
* A stronger USD continues to cap rallies in precious metals.
With no major US economic releases today, expect headlines from the Middle East and any surprise comments from FOMC members to drive volatility.
📈 Technical Analysis (4H)
Looking at the attached chart, price continues to respect a well-defined descending channel.
Current Structure
* Overall trend remains bearish.
* Price is trading below the 200 SMA, keeping longer-term momentum negative.
* Gold is currently testing the upper boundary of the descending channel around 4056.
* This area also aligns with dynamic trendline resistance, making it an important decision zone.
Although MACD has turned modestly positive, RSI remains below the 50 level, suggesting buying momentum is improving but still lacks conviction.
At this stage, the recent bounce looks more corrective than the beginning of a new bullish trend.
🔑 Key Levels
Resistance
🟥 4056 — Descending channel resistance (key breakout level)
🟥 4100-4120 — Previous support turned resistance / supply zone
🟥 4180-4200 — Major supply area
🟥 4495 — 200-Day SMA (long-term bullish target if structure changes)
Support
🟩 4000 — Psychological level currently holding
🟩 3960-3980 — Recent demand
🟩 3819 — Major structural support
🟩 3663 — Lower boundary of the descending channel
📊 Trading Scenarios
🐂 Bullish Scenario
A clean 4H close above 4056 would invalidate the immediate bearish channel resistance and open the door toward:
* 4100
* 4120
* 4180
* Potentially higher if momentum builds.
Confirmation would ideally come with stronger RSI momentum above 50 and increasing MACD strength.
🐻 Bearish Scenario (Preferred)
As long as price remains below 4056, sellers remain in control.
Failure at channel resistance could see price rotate back toward:
* 4000
* 3960
* 3900
* 3819
A break below 3819 would expose the lower channel support around 3663, reinforcing the broader downtrend.
💵 Dollar Watch
The US Dollar Index is consolidating after its recent rally. A breakout higher would likely add further pressure on gold.
At the same time, elevated oil prices continue reinforcing inflation expectations, which supports higher yields and remains a headwind for bullion.
📌 Trading Bias
Bias: Bearish while below 4056
Gold is benefiting from geopolitical uncertainty, but higher oil prices are simultaneously strengthening the case for higher-for-longer interest rates. Until buyers can reclaim the top of the descending channel, rallies are likely to be viewed as selling opportunities rather than the start of a sustained reversal.
Watch Today:
* Middle East headlines
* FOMC member comments
* US Dollar Index (DXY)
* Treasury yields
* Brent Crude price action
Bottom Line: The macro backdrop is creating opposing forces for gold. Geopolitical risk is providing support, but the combination of elevated oil prices, a resilient USD, and higher-rate expectations continues to favor the bears unless XAU/USD can secure a decisive break above 4056.
New Week XauusdHi, I'm Maicol, an Italian trader.
I've been studying Gold since 2019.
My trading approach focuses on swing trading and intraday setups.
I need your support.
Please leave a like and follow my profile.
It may seem like a small gesture, but it makes a big difference to my work.
Make sure to read the full description to understand today's trading plan.
Don't focus only on the chart. Thank you.
🌞 GOOD MORNING EVERYONE 🌞
🔍 Gold Price Action 🔍
The weekly outlook on Gold isn't looking bad. We've seen another rejection from the 2025 low, which is a positive sign.
The daily chart also looks decent, but it remains in a bearish structure, trading within a descending channel with lower highs and lower lows.
On the H4 timeframe, we've got a bullish reversal from the range support, so the short-term structure is currently bullish. The key levels I'm watching are **4040** and **4070**.
For now, I'm waiting since it's Monday. If price action this afternoon looks good and confirms the setup, I may consider opening a position.
At the moment, I'm cautiously bullish, targeting those levels.
🔔 Turn on notifications so you don't miss any updates!
📬 If you have any questions, feel free to message me. I'll be happy to help.
🔍 Reminder 🔍
I avoid trading during the Asian and London sessions.
My main focus is on the high-impact news releases at 8:30 AM ET and the New York session open at 9:30 AM ET.
In the meantime, I wish everyone a great day.
HAPPY TRADING
MANAGE YOUR RISK
BE PATIENT
Advanced GARCH Volatility Analysis● 🏛️ The Conceptual Origin
- The evolution of quantitative financial modeling has long grappled with the inherent instability of market variance, an observable phenomenon where periods of high turbulence cluster sequentially before dissipating into compression phases.
- Traditional analytical paradigms frequently assume a constant variance over time, a critical flaw that consistently fails to capture the true microstructural realities of modern order flow, algorithmic liquidity provision, and sudden institutional intervention.
- The Generalized Autoregressive Conditional Heteroskedasticity (GARCH) methodology emerged from the strict academic necessity to map these non-linear variances, providing a dynamic framework that respects the shifting gravitational pull of market sentiment.
- By anchoring this autoregressive logic strictly to volume anomalies rather than mere price derivation, the resulting architecture constructs a multi-dimensional perspective of market participation, completely insulating the analyst from the noise of low-volume manipulation tactics.
- This conceptual foundation dictates that every expansion in volatility carries a memory footprint, echoing through subsequent trading sessions and predictably altering the threshold for future price discoveries.
• The Heteroskedastic Reality
- Acknowledging that volatility is strictly conditional and time-dependent allows the algorithmic framework to move far beyond the lagging, static nature of traditional standard deviation metrics.
- The engine meticulously evaluates the residual statistical errors from past structural price action, treating historical volatility shocks as foundational baseline metrics for anticipating future systemic expansions.
- By abstracting the underlying mathematics away from public view, the integrity of the predictive variance models remains intact, ensuring that reverse-engineering attempts fall short of capturing the true alpha-generating mechanisms.
- Integration with absolute confirmed-bar evaluation logic ensures that historical mapping remains permanently fixed upon bar close, eradicating any possibility of historical signal repainting or real-time illusion.
● 📈 Narrative Technical Analysis
- When deploying this framework across live market environments, the narrative of price action transforms from a chaotic sequence of ticks into a highly legible auction process governed by volume-weighted boundaries.
- As price approaches significant liquidity pools, the volumetric volatility calculations act as an early warning system, highlighting the specific threshold where passive resting orders are overwhelmed by aggressive market execution.
- The system utilizes sophisticated structural regression milestones to identify where the current volatility regime deviates significantly from its historical autoregressive mean.
- Consolidation box mapping becomes highly contextualized; instead of merely viewing a range as sideways price movement, the analyst views it as a pressurized environment where the conditional variance is rapidly decaying, signaling an imminent and violent expansion.
- Volume profile anomalies are cross-referenced with the volatility outputs to validate whether a structural breakout is backed by genuine institutional commitment or is merely a low-participation retail trap designed to engineer liquidity.
• Confluence of Variables
- The true power of this analytical approach is fully realized when volumetric variance is analyzed in strict confluence with established Wyckoff mechanics, identifying accumulation and distribution phases through the lens of expanding or contracting variance.
- Market microstructure nuances, such as the speed of the tape and the density of the order book, are abstractly represented through the continuous rendering of the volatility baseline.
- Signal evaluation is strictly filtered by the dominant underlying trend regime, preventing the execution of mean-reversion tactics during periods of infinite directional variance.
- Every technical validation relies exclusively on confirmed data points, stripping away the visual clutter of standalone histogram layers and redundant bands to provide a clean, uncompromising view of the raw asset behavior.
● 🏢 Institutional vs. Retail Perspective
- The dichotomy between institutional operators and retail participants is most glaringly evident in their respective interpretations and applications of volatility data.
- Retail traders consistently view volatility as an unpredictable hazard, frequently tightening stops or exiting structural positions prematurely out of fear when market velocity abruptly increases.
- Conversely, institutional quantitative desks perceive volatility as the primary oxygen of the market, utilizing variance expansions as the optimal environment to offload massive inventory without incurring detrimental slippage.
- The GARCH-based volumetric approach aligns the user with the institutional mindset, quantifying the exact conditions under which smart money actively hunts for stop-loss liquidity to fill institutional-sized blocks.
- While the retail sector obsessively chases lagging moving average crossovers, the professional tier is actively calculating the probability of a variance shift, positioning themselves ahead of the inevitable momentum ignition.
• Asymmetric Execution Mechanics
- Institutional operators demand an asymmetric risk-to-reward ratio on every deployment, a standard that is mathematically impossible to achieve without a rigorous understanding of conditional heteroskedasticity.
- The model effectively highlights structural exhaustion points where the current volatility cycle has mathematically overextended its statistical boundaries, signaling a high-probability reversal zone.
- Retail traders often fall victim to the illusion of safety during low-volatility regimes, unaware that these exact conditions are being utilized by larger entities to build hidden, un-leveraged exposure.
- By stripping away lagging retail indicators, the framework focuses purely on the raw, undeniable footprint of institutional volume, mapping the true narrative of the financial auction process.
● ⚙️ Strategic Variance
- The operational application of this indicator must drastically shift in direct response to the overarching market environment, as variance models do not operate efficiently under a singular, rigid execution doctrine.
- During aggressively trending regimes, the baseline volatility metric will establish an elevated floor, indicating that pullback sequences should be treated as brief pauses in momentum rather than structural failures.
- Within ranging environments, the conditional variance will typically compress to historical lows, warning the analyst that mean-reverting strategies will eventually be decimated by the inevitable volatility breakout.
- High-volatility environments require a complete recalibration of structural targets; the expected range of price bars expands exponentially, demanding that the analyst widen structural invalidation levels to avoid being prematurely stopped out by algorithmic noise.
- The mathematical engine seamlessly transitions between these diverse states, continuously recalculating the autoregressive thresholds without requiring manual intervention from the operator.
• Environmental Adaptation
- The abstraction of complex algorithms ensures that the indicator dynamically adapts to shifting tick volume paradigms across differing asset classes, from high-beta equities to algorithmic forex pairs.
- Fixed, time-based segmentation drift is entirely eliminated by forcing all structural anchor points to lock precisely onto verified changes of character, ensuring that the analytical lens remains perfectly aligned with the market's true rhythm.
- False breakouts are systematically identified and ignored when the corresponding volumetric variance fails to breach the required quantitative threshold, preserving capital for legitimate structural shifts.
- The elimination of arbitrary manual anchor points guarantees that the output remains purely objective, preventing the analyst's cognitive biases from polluting the mathematical reality of the chart.
● 🧠 Psychological Architecture
- The implementation of a quantitative volatility framework is as much a rigorous exercise in psychological discipline as it is in applied mathematical analysis.
- Human cognition is inherently flawed when processing probabilistic outcomes, often heavily weighting recent emotional trauma over long-term statistical reality, leading to persistent hesitation during valid signal generation.
- The objective rendering of conditional variance serves as an essential psychological anchor, forcing the operator to acknowledge the absolute mathematical facts of the market rather than succumbing to fear or euphoria.
- By eliminating superficial chart chatter and focusing strictly on verifiable data, the framework actively dismantles the psychological hurdles associated with analysis paralysis.
- The trader is conditioned to view the market purely as an ongoing distribution of probabilities, recognizing that any single execution is entirely irrelevant within the grander scope of the statistical sample size.
• Cognitive Bias Mitigation
- Recency bias is aggressively counteracted by the indicator's deep historical memory, which continuously contextualizes current price action against years of underlying autoregressive data.
- Confirmation bias is neutralized through the strict requirement of volumetric validation; the operator cannot simply invent a bullish narrative if the underlying variance engine is definitively signaling a lack of institutional sponsorship.
- The absolute removal of predictive repainting logic guarantees that the analyst faces the harsh, unedited truth of their trading decisions, fostering an environment of ultimate accountability and continuous professional growth.
- Developing the mental fortitude to execute precisely when the market feels the most uncomfortable is the ultimate benchmark of a professional quantitative operator.
● 🎲 Risk & Probability Sagas
- The entire foundation of quantitative trading rests upon the mathematical philosophy of risk management, an absolute discipline that supersedes all forms of directional forecasting or fundamental analysis.
- Engaging with financial markets without a deep understanding of standard deviations and variance modeling is akin to navigating a hostile environment without a compass, guaranteeing eventual ruin through uncontrolled exposure.
- The framework explicitly visualizes the expanding and contracting nature of risk, allowing the operator to dynamically adjust their positional sizing in direct inverse proportion to the current volatility reading.
- A high-variance environment mathematically dictates a reduced position size, ensuring that the fixed percentage of capital at risk remains perfectly constant regardless of the width of the structural stop loss.
- Probability is not an abstract concept; it is a rigid, measurable reality that dictates the long-term survival of the trader, demanding absolute respect for the invisible boundaries of market distribution.
• The Mathematics of Survival
- The pursuit of alpha is entirely secondary to the preservation of initial capital; this engine is designed primarily as a defensive mechanism to keep the operator sidelined during low-probability, low-volume chop.
- Asymmetric execution requires that the potential reward is mathematically skewed to drastically outperform the initial risk outlay, a scenario that only presents itself when volatility transitions from compression to aggressive expansion.
- True professional longevity is achieved solely through the ruthless application of risk management parameters, refusing to compromise the statistical edge for the sake of emotional gratification.
- The final layer of risk architecture involves acknowledging the inherent limitations of any quantitative model, understanding that unprecedented tail-risk events can and will occur, demanding an unbreakable adherence to hard structural invalidation levels.
Based on the concepts previously discussed, the GARCH Volume Volatility indicator was developed to reflect the academic and technical principles outlined in this article.
● ⚠️ Professional Risk Warning
- The financial markets are inherently chaotic, and engaging in speculative trading involves a significant probability of capital loss, requiring absolute discretion and rigorous risk management protocols.
- Keep your language real when evaluating potential setups; it is imperative to remember that the future is fundamentally unknowable, and past results in no way guarantee future performance.
- No mathematical model, regardless of its autoregressive complexity or volumetric depth, can accurately predict unforeseen macroeconomic shocks or sudden liquidity vacuums.
- Ensure that capital deployment is strictly limited to funds that can be lost without impacting your primary livelihood, as the true nature of risk is ever-present and entirely unforgiving.
- Never infer past results will repeat in the future, and always base final execution decisions on a holistic confluence of independent technical and fundamental variables.
I got stopped on gold two weeks ago. I'm buying it againXAU/USD, long swing setup (1D)
THE SETUP
Gold has now bounced off the same floor three times. The two clean daily lows print at 3,959.08 and 3,960.28, one dollar and twenty cents apart, with a third test near 3,963 in late June. Price has drifted up to just above 4,020 through the session, so this is a limit order back into the base rather than a chase.
The tell is momentum. On the first test of the base RSI read 30.43. On the second test, at effectively the identical price, it read 36.02. Sellers reached the same floor with meaningfully less force. That is textbook bullish divergence, and it is the difference between a level that is being defended and a level that is about to break.
Be clear about what this is: a counter-trend long. Gold is down roughly 28% from its January record and the daily trend is unambiguously lower. I am taking the long side only because the reversal structure at this specific level is explicit rather than a hunch. If 3,930 gives way, I am wrong, and I will post that here rather than let it disappear.
I should also say plainly: I was stopped on gold two weeks ago, long from 4,130 with a stop at 4,078. That call sits in my public scorecard as a loss. This is a second attempt roughly 160 dollars lower, at an actual tested base rather than mid-air, and that is the entire difference between the two.
CONFLUENCES (6 of 8)
Double bottom, lows 3,959.08 and 3,960.28, plus a third test near 3,963
Entry sits on a level defended three separate times
Bullish RSI divergence across matched lows (30.43 into 36.02)
Central bank bid is structural, not tactical (below)
Price trades under the World Gold Council H2 fair value estimate near 4,100
Clean structural invalidation, RR 2.2 / 3.6 / 5.4
Not claiming: the higher timeframe trend is against me, and I am not pretending otherwise.
FUNDAMENTALS
The floor under this market is official-sector demand, and it is not price sensitive. The PBoC added 14.93 tonnes in June, its 20th consecutive month of buying and its largest single month since 2023, and it did that into a historic quarterly decline. Central banks have averaged roughly 1,000 tonnes of net purchases a year since 2022, absorbing something like 20 to 25% of annual mine supply. That bid runs on decade-long reserve mandates, not on the daily tape.
The other side of the ledger is real yields, and they are the reason gold is down here at all. The 30 year Treasury is pushing 4.902%, and markets price roughly 53% odds of a Fed hike in September. FOMC lands July 29, inside this trade. A hawkish statement lifts real yields and threatens the base directly. That is the specific risk to this idea, and it is why the stop sits where it sits rather than somewhere more comfortable.
TRADE PLAN
Entry zone: 3,975 to 4,000 (limit, buy the dip back into the base)
Stop loss: 3,930 (below the 3,959 double-bottom floor)
TP1: 4,115 (the shelf both base candles were rejected at, 2.2R)
TP2: 4,195 (July swing high, 3.6R)
TP3: 4,300 (upper edge of the 3,895 to 4,305 fair value band, 5.4R)
Invalidation: a daily close below 3,930 kills it. No second guessing, no averaging down.
Every call I publish goes in the public scorecard, wins and losses both, including the gold loss above.
So: is that 3,960 floor central banks quietly absorbing supply, or is it a shelf waiting to break on a hawkish Fed next week? Tell me which below.
Not financial advice. Trade your own plan and manage risk.
XAUUSD 4021 trap — 4103 liquidity nextXAUUSD 4021 trap — 4103 liquidity next
That 4,000 struggle is messy, but the reaction is there.
Gold printed the big weekly drop, swept into the 3,959 area, then started crawling back. Not clean. Not pretty. But price is still holding above the low and now sitting inside the small Order Block around 4,021 - 4,043.
That’s the zone.
Macro is still heavy, yeah. USD has support from safe-haven demand, US-Iran tension is still dragging risk around, and the daily structure is not exactly bullish. So I’m not calling this a clean reversal.
This is more like a recovery leg into higher supply.
Main bias is bullish short-term while 3,959 holds.
If this OB holds and price reclaims 4,043, buyers can squeeze this thing toward 4,066 first. Above that, 4,103 is the real draw. That level has clean liquidity sitting above it.
And if gold keeps pushing, the premium zone around 4,120 - 4,138 is where I’d expect sellers to show up again. That’s not a buy-and-pray zone. That’s where the trap can flip.
Trading scenario:
Buy idea only if gold holds 4,021 - 4,043 and reclaims above 4,043 with clean candles.
Entry zone: 4,021 - 4,043 after confirmation
Stop loss: below 3,990
TP1: 4,066
TP2: 4,103
TP3: 4,120 - 4,138
No hold inside the OB, no buy. Simple.
If gold closes hard below 3,959, this recovery idea is dead. Then the weekly bearish pressure takes back control.
For now, I’m watching the OB hold first, then 4,103 liquidity.
You think gold taps 4,103 before sellers reload?
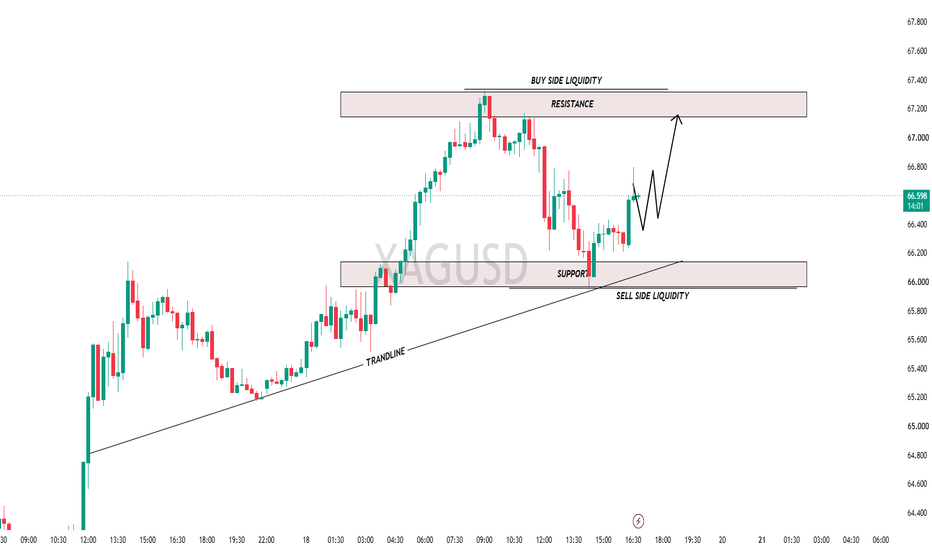
Tarot TradingView: XAGUSD — Support rebound or breakdown?🎯 Trade setup
Direction: Long
🔼 Entry: $55.30–$55.60
🛑 Stop Loss: $54.70
🎯 Take Profit 1: $56.00
🎯 Take Profit 2: $56.50
Question
Will XAGUSD show a reversal from support, or is the market preparing for another leg lower?
Tarot cards
6 of Stonks — Current Situation
The market is testing an area where buyers may try to regain control. This card points to possible support, a reaction from the level, and an attempt to restore balance after a strong decline. However, this is not a confirmed reversal yet — only the first sign of stabilization.
The Long — Key Factor
The key factor is whether buyers are ready to defend the $55.00–55.30 area. This card supports a long idea, but only after confirmation. Price needs to hold support and reclaim $55.30–55.60 before the bullish scenario becomes stronger.
The YOLO — Likely Scenario
A sharp impulse is possible. This card warns of increased volatility: if buyers defend support, the rebound may be fast. But if $55.00 breaks, downside momentum may also accelerate quickly.
News
Silver remains under pressure along with other precious metals. Recent market reports show Comex silver falling sharply, pressured by a stronger U.S. dollar, higher Treasury yields, and concerns that geopolitical tensions and elevated oil prices may revive inflation risks. At the same time, softer U.S. inflation data gives metals a reason to attempt a technical rebound.
Conclusion
The cards point to a conditional bullish scenario, but only if support holds. 6 of Stonks shows an attempt to stabilize, The Long highlights a possible rebound setup, and The YOLO warns that the next move may be sharp in either direction.
Tarot is used as a creative analytical format. This publication does not constitute investment advice. Not financial advice.
1HR FVG Rebalance + Liquidity Sweep: High-Probability Long Setup1. Sell-Side Liquidity Sweep (The Manipulation Phase)
BoS & Markdown: The structural break to the downside forced the market into a deep discount.
Rejection Low Sweep (~3,960.00): Price dipped below $3,960.00 to raid sell-side liquidity before printing a sharp rejection wick, confirming institutional absorption.
2. 1HR FVG Test & Liquidity Engineering
1HR FVG: The yellow shaded box marks a 1HR Fair Value Gap between 4,000.00 – 4,025.00. Price pulled back into this imbalance zone, reacting cleanly as it re-balanced market orders.
Internal Sell Side Liquidity: Price has engineered internal low liquidity around 3,980.00. The projected blue path anticipates a minor liquidity dip into this area to grab final orders before the main expansion.
3. The Upside Target Matrix
Once the minor pullback completes, the primary expansion aims to target stacked buy-side liquidity:
Buy-Side Liquidity Target: 4,040.00 (Internal swing high)
Major Structure High: 4,100.00 (Upper supply level marked by previous rejections)
HTF Objective: 4,140.00 (Relative Equal Highs)
The Long Trade Plan
📈 Entry Zone: 3,980.00 – 3,995.00 (Dip into internal Sell Side Liquidity)
🛑 Stop Loss (Invalidation): Clean break below 3,958.00 (Below the main Rejection Low)
🎯 Target 1: 4,040.00 (Liquidity High)
🎯 Target 2: 4,100.00 (Previous Supply Zone)
🎯 Target 3: 4,140.00 (Relative Equal Highs / HTF Buy-Side Liquidity)