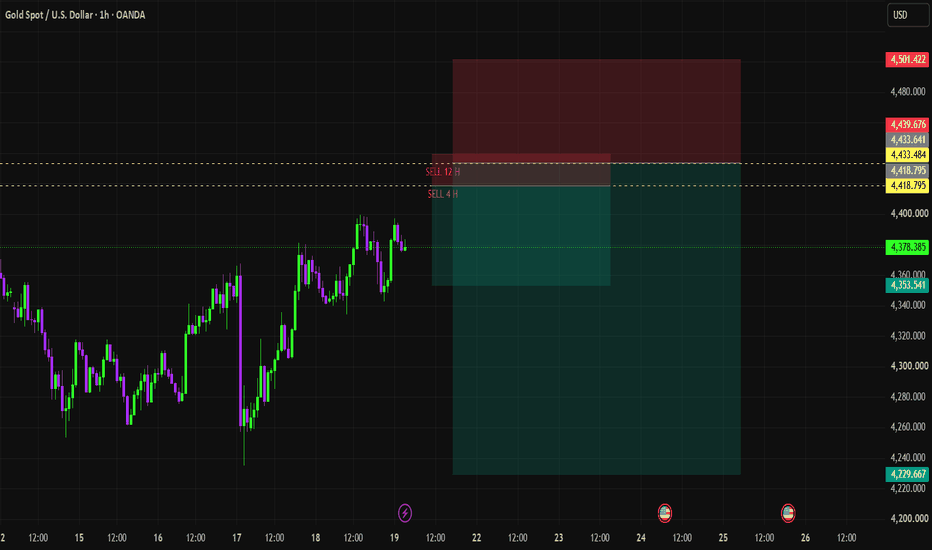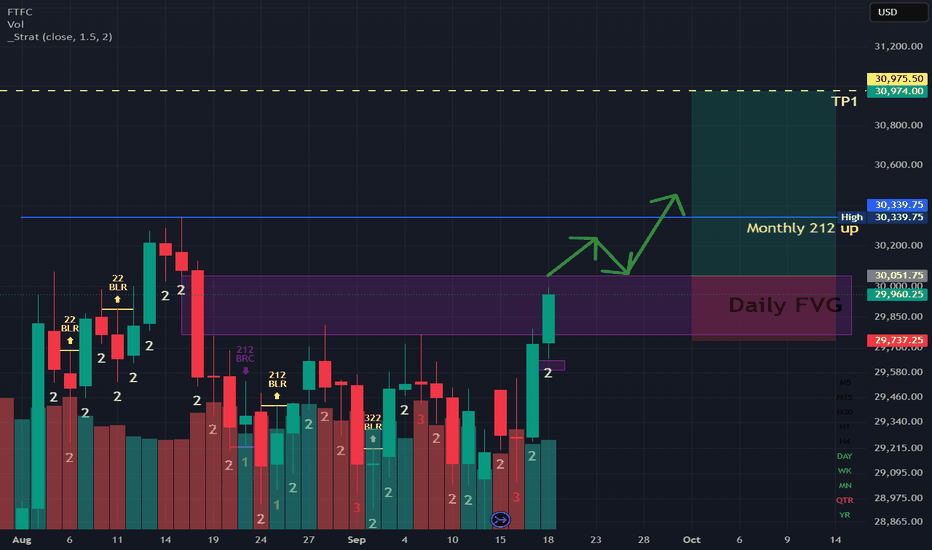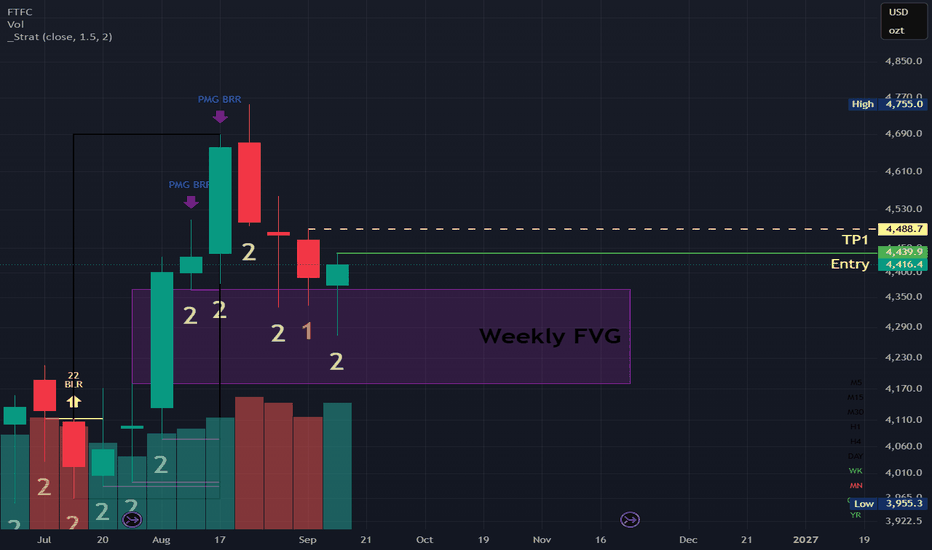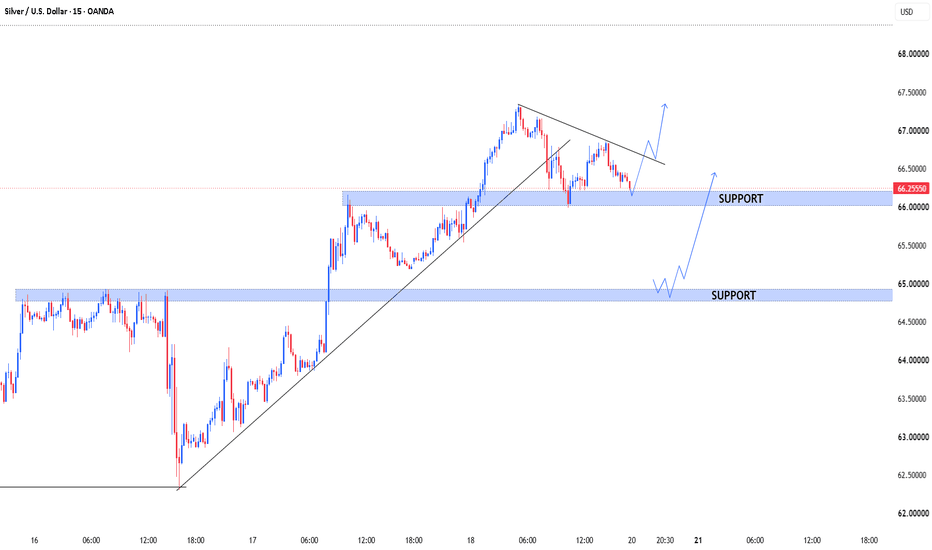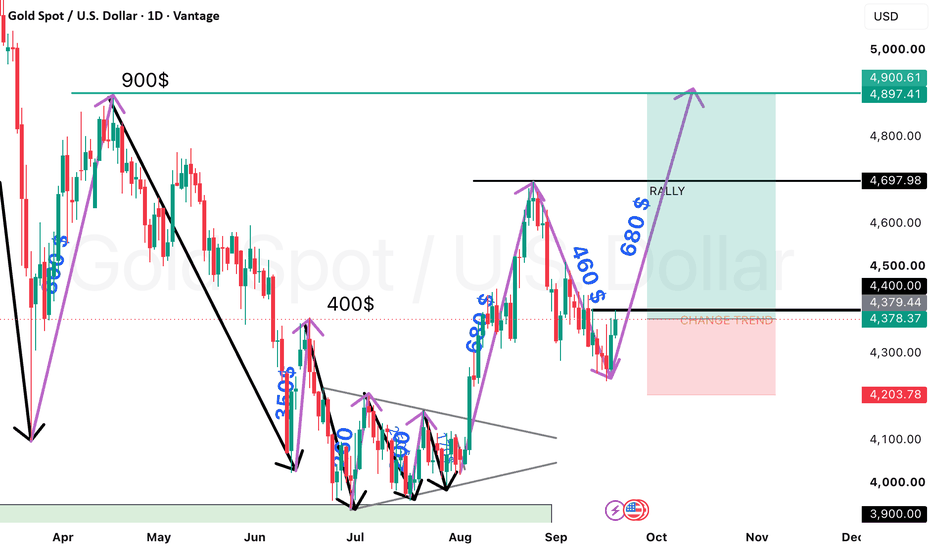
GOLD Will Go Lower From Resistance! Sell!
Please, check our technical outlook for GOLD.
Time Frame: 1h
Current Trend: Bearish
Sentiment: Overbought (based on 7-period RSI)
Forecast: Bearish
The market is testing a major horizontal structure 4,011.63.
Taking into consideration the structure & trend analysis, I believe that the market will reach 3,970.43 level soon.
P.S
Overbought describes a period of time where there has been a significant and consistent upward move in price over a period of time without much pullback.
Like and subscribe and comment my ideas if you enjoy them!
Futures market
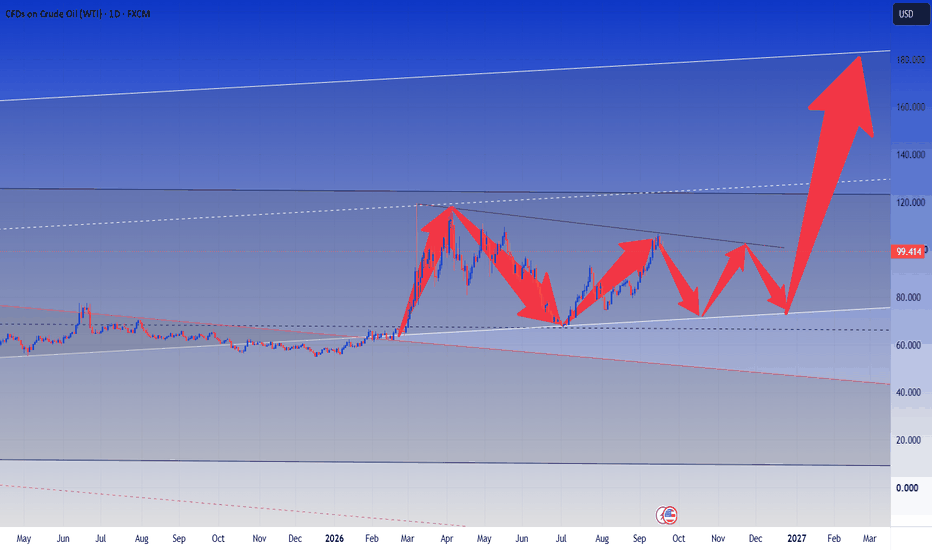
$OIL - ceasefire or Houthis to blockade Saudi oil shipments?NSE:OIL has been very volatile over the past 12 hours. I'm still fully long and sitting on a large open profit.
On one hand, there's growing pressure for a ceasefire. On the other, the Houthis are threatening to blockade Saudi oil shipments through key sea routes.
Plan: If the blue support flips into orange resistance, I'll assess the buying strength from there.
AMEX:USO
AMEX:XLE
NYSE:CVX
NYSE:XOM
NYSE:BP
NYSE:SHEL
AMEX:SPY
NYSE:CL
#Oil #Commodities
XAUUSD Bulls Defend Major Demand Zone – Rally Toward New Highs? Gold has once again reacted strongly from a key demand zone, suggesting buyers are stepping back into the market. The recent rejection confirms this area remains a significant liquidity zone where institutional buying interest may be present.
As long as price holds above the highlighted demand zone around 3,940–3,980, the bullish outlook remains valid. A continuation of the current momentum could see Gold target 4,100, followed by 4,190, with the major resistance at 4,325 becoming the next key objective.
A clean break and close above intermediate resistance would strengthen the bullish structure and increase the probability of a fresh impulsive move higher. However, if price fails to hold the demand zone and closes below it, sellers could regain control and push Gold into a deeper correction.
Key Levels
🟦 Demand Zone: 3,940 – 3,980
🎯 Target 1: 4,100
🎯 Target 2: 4,190
🎯 Final Target: 4,325
❌ Bullish Invalidation: Sustained close below 3,940
The current price action favors patience. Wait for confirmation before entering, manage risk effectively, and let the market reveal its next direction.
Trade what you see, not what you think. 📈🔥
GOLD Set To Fall! SELL!
My dear subscribers,
GOLD looks like it will make a good move, and here are the details:
The market is trading on 4059.7 pivot level.
Bias - Bearish
My Stop Loss - 4073.2
Technical Indicators: Both Super Trend & Pivot HL indicate a highly probable Bearish continuation.
Target - 4038.1
About Used Indicators:
The average true range (ATR) plays an important role in 'Supertrend' as the indicator uses ATR to calculate its value. The ATR indicator signals the degree of price volatility.
Disclosure: I am part of Trade Nation's Influencer program and receive a monthly fee for using their TradingView charts in my analysis.
———————————
WISH YOU ALL LUCK
XAUUSD PING PONG Hi, I'm Maicol, an Italian trader.
I've been studying Gold since 2019.
My trading approach focuses on swing trading and intraday setups.
I need your support.
Please leave a like and follow my profile.
It may seem like a small gesture, but it makes a big difference to my work.
Make sure to read the full description to understand today's trading plan.
Don't focus only on the chart. Thank you.
🌞 GOOD MORNING EVERYONE 🌞
🔍 Gold Price Action 🔍
Low volume and low volatility. It's better to stay away from gold for now.
We're moving deeper into the summer trading season, and the market isn't giving any decent signals.
Gold:*$4,078, up 0.75%.
This is the first meaningful bounce in several weeks. Price is now trading inside a key daily dominance resistance zone.
This area will be crucial to monitor.
US 2-Year Treasury Yield: Last week it climbed to around 4.23% the highest level of this cycle, before pulling back to around 4.19% today.
Brent Crude: $87.04, up from $83.79 last week.
During the session it also traded as high as $88-89. The war with Iran still shows no signs of de-escalation.
For now, I'm just watching the market and will only consider opportunities based on the eekly and Daily charts.
Everything else is just noise.
There are too many traps and price action is too messy.
Trump, the war, and inflation aren't helping either.
Be patient. It can't rain forever.
🔔 Turn on notifications so you don't miss any updates!
📬 If you have any questions, feel free to message me. I'll be happy to help.
🔍 Reminder 🔍
I avoid trading during the Asian and London sessions.
My main focus is on the high-impact news releases at 8:30 AM ET and the New York session open at 9:30 AM ET.
In the meantime, I wish everyone a great day.
HAPPY TRADING
MANAGE YOUR RISK
BE PATIENT
GOLD 15M – Short SetupHi fellow traders,
On the 15M GOLD chart, I am applying Elliott Wave principles to outline a potential short setup.
Price appears to be completing an expanding flat correction, with wave C extending into a key confluence area. This region aligns with multiple technical factors within my strategy, making it a high-probability location to look for a bearish reversal.
If the expanding flat completes as expected, I anticipate the larger bearish trend to resume.
Entry: current price
Stop Loss: 4045.00
Take Profit: 3960.00
If price breaks above the stop level, this setup is no longer valid.
Good luck and trade safe!
XAUUSD: The fierce battle between bulls and bears will continue.The complexity of the Middle East situation determines the short-term volatility of gold prices, while the Federal Reserve's policy path will have a decisive impact on the medium- to long-term trend of gold. Market movements are mainly driven by technical factors, with a focus on breakouts from the upper and lower limits of the consolidation range.
Gold is expected to maintain a wide range of fluctuations. The daily chart closed with a doji candlestick, and the 10-day and 7-day moving averages continue to widen downwards, moving down to 4043/4016. The price is trading along the lower Bollinger Band channel, and the RSI indicator is below the midline. On the 1-hour and 4-hour charts, the Bollinger Bands are narrowing, with the price trading near the middle band. The moving averages are converging, and the RSI indicator is near 50. Gold is still in a consolidation phase, without a clear trend. The back-and-forth between bulls and bears will continue. The trading strategy is to buy low and sell high.
Resistance: 4030/4046/4060; Support: 3983/3960/3952/3933.
My recommendations:
BUY: 3970-3980, SL: 3940, TP: 4050-4100;
SELL: 4040-4050, SL: 4070, TP: 3980-3950;
Gold Key Breakout AreaGold is holding at an interesting technical level. It's currently on the $4,000 psychological level whilst holding below a long standing downtrend line.
With the current downtrend line and strong support level we could be looking at two possible scenarios:
- Bearish scenario: Price breaks lower confirming the descending triangle shape that is forming and opening the door for a larger move down.
- Bullish scenario: If $4,000 continues to hold, a break above the downtrend line and some nice resistance zones could indicate a larger move to the upside.
Fundamentally, geopolitical tensions are causing fundamental direction to be a bit more complicated. Rising tension should generally support safe haven assets moving higher but the increasing oil prices reviving concerns of rising inflation and interest rate expectations strengthening the USD and putting downwards pressure on gold.
Last weeks softer than expected US CPI was initially supportive of gold but it still seems to be grinding lower. Ideally a breakout would be confirmed with data providing a shift in expectations for US rates.
XAUUSD Trading Plan: Riding the Channel Floor Bounce1. The Big Picture (What is happening?)
As shown Gold has been moving downward inside a large channel (the sloping gray area) since reaching its peak earlier this month at $4,201
Recently the price dropped to a major floor at $3,960.00 and bounced. We are now seeing a new highly reliable buying zone form just above that floor at $3,976.76. The plan is to buy near this cheap zone and hold for a recovery rally back up toward the main resistance wall at $4,110.
2. The Plan at a Glance Level Price
Buy Zone (Entry)
$3,976.76
This is the local support floor. We want to enter our buy position as close to this level as possible.
Current Price
$3,991.89
The market is currently resting slightly above our buy zone, preparing for the next move.
Safety Exit (Stop Loss)
$3,960.00
If the price falls below this line, the trade is no longer safe. We exit automatically to protect our money.
Profit Target (Take Profit)
$4,110.34
This is a major resistance area at the top of the channel where we expect the price to struggle. We will close the trade and take our profits here.
3. Why This Trade Makes Sense
Cheap Buying Price: We are buying right near the bottom floor of the channel, meaning our risk is very small compared to our potential reward.
Strong Double Floor: The price already tested the $3,960 area and rejected it. This tells us that big buyers are actively protecting this level.
Clear Road Upward: Once the price breaks out of the short-term downward trend, there is a lot of open space for it to run straight to $4,110.
4. Simple Steps to Manage the Trade
Step 1: Get In
Enter the buy position at or near $3,976. with your safety exit set at $3,960.
Step 2: Remove the Risk
Once the price starts climbing and reaches $4,040, move your safety exit up to your entry price ($3,976). Now, even if the market reverses, you cannot lose any money.
Step 3: Collect the Win
Close the entire trade when the price hits $4,110 to secure your profits.
Compression Before Expansion Universal auction theory truth
Compression = price agreement, energy storage & hinge formation.
7/17 D bar = liquidity found & price reclaimed.
Sweeps around VWAP = compression
Macro hinge 28408 - 30062
Macro hinge center = 29200 - 29400
Meso hinge 7/19 18.00 - 7/20 09.29.59 = compression within macro hinge
Compression: "I'm done exploring. I'm preparing to move."
Iran bombing + chip maker weakness = price reset
PX rotating around VWAP = balance. NOT initiative. NOT distribution.
Compression = the hinge between liquidity discovery & directional intent
Tight > Right
When the PX tightens (compresses) look to the right of your screen. It is getting ready to move.
This post is up early. Add to it the updated London sweep(s) & the NY ETH sweeps.
At 09.30.00 have a 15s bar chart before you and Trade the Sequence
1. IF sweep THEN reclaim
2. IF reclaim THEN hinge
3. IF hinge THEN break
4. IF break THEN trade setup is valid
Pullback entry at the lip and/or lip compression shelf and/or apex shelf.
OHM Scenario-1 BTO trade sell-side sweep must happen between 09.30.00 and 09.45.00.
OHM Scenario-2 BTO trade sell-side sweep after 9.45.00
OHM = Opening Hour Model
Bears flip the script.
VWAP was supposed to be on this chart. Sorry for that. But, yes, overnight sweeps oscillating around VWAP = balance & compression.
ES (SPX, SPY) Analysis, Key-Zones, Setup for Mon (Jul 20)Bias: The S&P 500 E-mini trades near 7,528 into Monday's open, roughly 30 points above Friday's 7,497.75 settlement, after an overnight session that ran 7,482 to 7,545.25. The lift came on a 7:30 ET headline that mediators proposed a ten-day cessation of strikes to revive Middle East talks, a de-escalation impulse arriving after nine consecutive nights of escalation and a vessel struck inside a key shipping lane. Dealer positioning turned constructive across last week's monthly expiration: fresh call selling added positive gamma through the 7,540s and projects positive down toward 7,440, which favors buying weakness and selling strength rather than chasing either direction. The dealer gamma flip level sits at 7,512.5 and the computed daily pivot at 7,515.25, making the 7,512 to 7,523 band the line that decides the day. A dealer-positioning stability read near 23% warns of a wide range without implying direction. Friday's institutional flow shows heavy index hedging alongside bullish single-name structures, a hedged-long posture where dips get bought unless a genuine headline forces those hedges to pay. Bias is cautiously constructive above 7,512 and neutral to lower beneath it. The US calendar is quiet today; Wednesday's megacap earnings block alongside volatility expiration is the week's fulcrum, and any shipping-lane or casualty headline can override the technical map instantly.
Resistance:
7,515 computed daily pivot, first overhead
7,522 risk pivot, upper edge of the decision band
7,545 to 7,546 overnight high and 1-sigma resistance
7,552 volatility inflection level and gamma wall, the key ceiling
7,557 computed first resistance
7,581 to 7,590 3-sigma extension and upside pin equivalent
7,617 computed second resistance
7,642 upper gamma wall
Support:
7,512 dealer gamma flip level, the line that matters
7,510 40-day moving average
7,497 Friday's settlement and psychological 7,500 shelf
7,482 to 7,480 overnight low, Friday's low, and 38.2% retracement of the 13-week range
7,455 computed first support
7,450 1-sigma support
7,342 lower gamma wall
Primary Setup: Long from 7,518 to 7,512, stop 7,506, target 7,528. Buy the pullback into the gamma-flip and pivot band while positive gamma conditions hold, invalidated on sustained acceptance below 7,510. Alternate short: fade a first touch of 7,550 to 7,556 if flow stalls at the level and no fresh call buying appears, targeting 7,540 to 7,542, invalidated on 5-minute acceptance above 7,558, which shifts the ceiling to 7,585 to 7,595. Skip the 7,528 to 7,548 middle, where there is no edge. Targets stay modest because recent sessions have not extended far beyond ten to twelve points from entry. Let the opening range form before committing, and keep the headline environment in view at every level touch.
XAUUSD|BULISH outlook
Gold is showing strong bullish momentum after defending a key support zone. Price structure remains intact, and buyers continue to maintain control. A confirmed move above the current resistance could open the way for the next bullish leg.
**Key Points:**
• Bullish market structure remains valid.
• Strong support has been respected.
• Waiting for breakout confirmation before continuation.
• Risk management is essential—always use a stop loss.
**Disclaimer:** This analysis is shared for educational purposes only and should not be considered financial advice. Always conduct your own analysis before taking any trade.
—
**Most Profitable Market Hub**
*Trade Smart. Stay Disciplined.*
Smart Money Setup: Liquidity Sweep & Bullish ReversalExecutive Summary
Gold continues to trade within a broader corrective structure following a rejection from its peak near the $4,375 level. Recent price action indicates a potential transition from a bearish trend to a short-term accumulation phase. The market has executed a liquidity sweep below equal lows, establishing strong baseline demand. A secondary retracement into the discount support region is anticipated prior to a prospective bullish expansion toward major overhead resistance.
Technical Breakdown
1. Trendline Dynamics and Market Structure
The asset has consistently honored a descending resistance line originating from the mid-July high. Lower high formations have dominated the intermediate timeframes, pushing price toward a multi-week demand floor. However, internal structural shifts (Break of Structure / Change of Character) near the $3,988–$4,023 region suggest that selling momentum is decelerating as price approaches key discount territory.
2. Liquidity Sweeps and Demand Zone Activation
The sweep of sell-side liquidity below prior support levels has effectively cleared weak long positions, transferring contracts to institutional buyers. Price is currently consolidating near $4,023.80. A final corrective impulse is projected to test the $3,988.11–$4,000.00 demand block, aligning with a technical Quasimodo (QM) level and structural support.
3. Reversal Trajectory and Targets
Should the demand zone hold, a bullish reversal path is projected toward the equilibrium level at $4,075.00. A sustained break above equilibrium would clear the path for a retest of the major supply and resistance zone at $4,202.85, representing the primary upside objective.
Key Reference Levels
Major Overhead Resistance: $4,202.85 (Premium Supply Zone / Strong High)
Equilibrium / Mid-Range Target : $4,075.00 (Pivot Level)
Current Trading Level : $4,023.80 (Consolidation Region)
Primary Accumulation / Support Zone : $3,988.11 – $4,023.57 (Discount Demand / Liquidity Swept Zone)
Structural Invalidation Level : $3,948.09 (Swing Low Support)
Outlook and Strategy
Market participants monitoring long positions should look for price stabilization within the $3,988–$4,000 range. Confirmation via lower timeframe bullish price action (such as an engulfing structure or local change of character) within the demand zone enhances probability. A daily close below the invalidation mark at $3,948.09 negates the bullish bias and opens the market to further downside risk.
Disclaimer: This idea publish is for educational purposes, trading involves risk of losing your capital, trade at your own risk
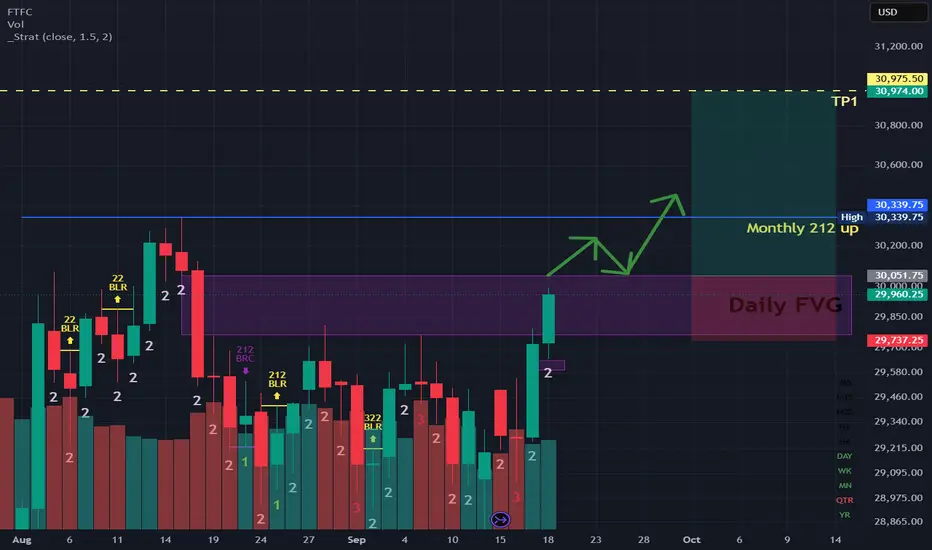
Nasdaq 100 Futures Update: Flat CorrectionTriangular consolidation posted earlier was invalidated
The structure transformed into a flat correction ABC
Waves A and B are done
Wave C looks like an Ending Diagonal with waves 1-3 out of 5 completed
Wave 4 of C is expected to move up to hit the upside of the downtrend
Wave 5 of C shall follow to retest the valley of wave A at $28,228
Minimum target for large yellow wave 5 is unchanged at the peak of wave 3 at $
is preliminary set at $30,990
Next target is preliminarily set at $32,500 but should be recalculated once large yellow wave 4 is over
Bullish trigger shall be set at the top of upcoming blue wave 4 of C
Crude Oil Reverses From The GAP Resistance AreaGood morning, traders!
Oil jumped and gapped to its highest level in over a month as US-Iran tensions escalated, but today’s headlines suggest diplomacy is still ongoing while geopolitical risks remain elevated.
Iran signaled a mixed but slightly more diplomatic stance, saying it has received proposals and messages from mediators and remains open to negotiations with the U.S. if they align with its national interests. At the same time, Tehran reiterated that its sovereignty over the Strait of Hormuz is non-negotiable, vowed to continue diplomatic efforts against what it called U.S. "crimes," and warned against any U.S. military infiltration into Iranian territory. Overall, the headlines suggest diplomacy is continuing, but geopolitical tensions remain elevated.
Crude oil is now turning sharply lower after reaching June’s gap resistance within an ABC correction or five-wave impulse, so in both cases we could now see a slowdown in at least three waves, with a potential pullback toward the 78–76 area.
XAU/USD 4H Analysis: Bears Defend Resistance, Targeting 3,874XAU/USD remains in a bearish trend, trading inside a well-defined descending channel. Although price has bounced from the lower boundary, the overall market structure still favors sellers unless key resistance is broken.
Market Structure
Trend: 🔴 Bearish
Price continues to make lower highs and lower lows within the descending channel.
The recent bounce appears to be a corrective move rather than a confirmed trend reversal.
The chart's active SHORT bias remains valid while price stays below the highlighted resistance.
Key Levels
Immediate Resistance: 4,050–4,075 (supply/resistance zone)
Current Price: ~4,017
Channel Support: Around 3,930
Major Target Zone: 3,870–3,880
Trade Idea
Bias: 🔴 SELL / SHORT
Entry
Preferred: Wait for price to retest 4,040–4,060 with bearish rejection.
Aggressive: Continue holding short while price remains below 4,075.
Targets
TP1: 3,970
TP2: 3,930
TP3: 3,870–3,880 (highlighted target zone)
Invalidation
A strong 4H candle closing above 4,075–4,100 would weaken the bearish setup and could signal a move toward higher resistance.
ICT Perspective
Price is trading below a key resistance/order block, suggesting sellers still control the market.
The recent rebound may be a liquidity grab before continuation lower.
Sell-side liquidity near 3,870 remains the most likely objective if resistance holds.
Overall Outlook
Bias: SELL / SHORT 🔴
As long as XAU/USD remains below the 4,050–4,075 resistance zone and inside the descending channel, the probability favors another move toward 3,930 and potentially 3,870.
Suggested Title:
XAU/USD 4H Analysis: Bearish Channel Points to Further Decline Toward 3,870
analysis
XAU/USD (Gold) 4H Technical Analysis
The 4-hour chart maintains a bearish market structure, with price respecting a descending channel and trading below a key resistance zone. The recent bounce from channel support looks corrective, while sellers continue to hold the overall trend.
Market Structure
🔴 Trend: Bearish
Price remains inside a well-defined descending channel.
The highlighted resistance zone around 4,050–4,075 has rejected price, keeping bearish momentum intact.
The active SHORT signal aligns with the prevailing downtrend.
Key Levels
Resistance: 4,050–4,075
Current Price: ~4,017
Immediate Support: 3,933
Major Target: 3,874
Trade Setup
Bias: 🔴 SELL
Entry Zone
Ideal: Sell on a pullback into 4,040–4,060 with bearish confirmation.
Alternative: Hold short positions while price remains below 4,075.
Profit Targets
TP1: 3,970
TP2: 3,933
TP3: 3,874 (primary downside target)
Stop Loss
Above 4,080–4,100, or above the descending channel resistance.
Technical Outlook
Price is attempting a short-term recovery but remains below channel resistance.
The lower highs indicate sellers are still in control.
A rejection near resistance would strengthen the probability of another bearish leg toward 3,874.
A confirmed breakout above 4,075–4,100 would invalidate the current bearish setup and shift the outlook to neutral or bullish.
Overall Bias
🔴 Bearish (SELL)
As long as XAU/USD trades below the 4,075 resistance and within the descending channel, the path of least resistance remains to the downside, with 3,874 as the primary target.
XAUUSD 30M | Bearish Rejection SetupKey Levels: • Resistance: 4024–4042 • Support: 3980–3987
Trade Plan: Wait for confirmation before entering any position. Always use proper risk management and a stop loss.
Disclaimer: This idea is for educational purposes only and is not financial advice. Always do your own analysis before trading.
Options Blueprint [int]: When Price Is Trapped, Think VolatilityMarkets do not always reward directional conviction. Sometimes, the highest-probability observation is simply that price appears compressed and a meaningful move could emerge in either direction. Rather than attempting to predict whether buyers or sellers will ultimately prevail, traders can instead prepare for volatility itself.
This case study explores how a Long Strangle options strategy may be combined with a classical chart pattern, implied volatility analysis, and predefined technical objectives. The goal is not to anticipate direction, but to create a structured framework that can potentially benefit from a significant price expansion while maintaining a defined maximum risk.
The examples discussed below are purely educational and intended to illustrate the concepts involved.
The Technical Picture: A Market Waiting for a Decision
The chart currently shows price trading inside a Rising Wedge, a chart pattern frequently associated with weakening bullish momentum. However, one important point is often overlooked: a bearish pattern does not become bearish until it actually breaks down.
At the time of writing, the breakout has not occurred.
Instead, price is positioned approximately in the middle of the wedge, leaving two plausible paths:
A downside breakout, consistent with the traditional interpretation of the pattern.
An upside breakout, which would invalidate the bearish expectation and potentially trigger buying pressure.
This uncertainty becomes even more interesting when viewed alongside nearby technical levels.
The nearest potential resistance area is located around 1.16160, while an important potential support area sits near 1.12885.
In other words:
Price is roughly centered inside the Rising Wedge.
Price is also positioned between two important technical reference levels.
Rather than providing directional clarity, this environment highlights uncertainty—precisely the type of condition that options strategies designed to capture movement often seek.
When Volatility Becomes More Important Than Direction
Many traders focus exclusively on where price may go.
Options traders often ask a different question:
How much could price move?
This distinction is important.
A Long Strangle does not require accurately forecasting whether the market moves higher or lower. Instead, it generally seeks a sufficiently large move in either direction before time decay materially erodes the option premiums.
This makes volatility—not direction—the primary consideration.
Looking Beyond the Chart: Implied Volatility
Chart patterns describe price.
Options introduce another important dimension: implied volatility.
Comparing the implied volatility curves of the September 4 expiration with those of the October 9 expiration reveals an interesting observation.
The October 9 expiration currently displays:
Lower implied volatility.
A flatter volatility skew across strikes.
Lower implied volatility generally corresponds to comparatively lower option premiums, all else being equal. While no option can be described as "cheap" in absolute terms, purchasing options when implied volatility is relatively lower may improve the overall characteristics of certain long-premium strategies.
For this case study, that observation makes the October 9 expiration particularly interesting.
Building the Long Strangle
This educational example considers the following position:
Long 1 × October 9 1.1500 Call
Long 1 × October 9 1.1400 Put
This creates a classic Long Strangle.
The strategy establishes exposure on both sides of the market while limiting maximum risk to the total premium paid.
Unlike directional option strategies, the objective is not to predict which direction the market chooses. Instead, the objective is to participate if price expands sufficiently in either direction.
The Critical Ingredient: Planning the Exit Before Expiration
Perhaps the most important concept in this article is not the Long Strangle itself.
It is the planned exit.
Many educational examples discuss option strategies assuming positions remain open until expiration.
That is not the intention here.
Instead, the October 9 expiration is selected primarily because implied volatility appears relatively lower than the nearer expiration.
The trade management plan assumes that if a breakout develops, the position would potentially be closed at predefined technical objectives rather than held until expiration.
Illustratively:
A bullish breakout could be evaluated near the potential UFO resistance around 1.16160.
A bearish breakout could be evaluated near the potential UFO support around 1.12885.
Exiting before expiration may materially alter the strategy's characteristics because option value is influenced by multiple factors beyond intrinsic value, including remaining time value and implied volatility.
This illustrates an important principle:
Sometimes the expiration is selected because of pricing, not because the trader intends to hold the position until expiration.
Why This Matters
Waiting until expiration would require price to travel sufficiently far beyond the strategy's breakeven levels.
By contrast, if the objective is to participate in an earlier expansion and close the position while options still retain meaningful time value, the required move may differ substantially.
This illustrates why trade management can be just as important as strategy selection.
Futures Contract Specifications
For readers interested in the underlying futures contracts, the following specifications apply.
Euro FX Futures (6E)
Contract size: 125,000 euros
Minimum price fluctuation (tick): 0.000050 per Euro increment = $6.25
Approximate margin requirement: ~$2,100
Micro EUR/USD Futures (M6E)
Contract size: 12,500 euros
Minimum price fluctuation (tick): 0.0001 per euro = $1.25
Approximate margin requirement: ~$210
Margin requirements are established by the exchange and may change without notice. Individual brokers may require higher margin levels than the exchange minimums.
Risk Management
Although a Long Strangle limits maximum loss to the premium paid, risk remains an essential consideration.
Among the primary risks are:
Time decay as expiration approaches.
Changes in implied volatility after the position is established.
Insufficient price movement.
Transaction costs and liquidity considerations.
Position sizing should always reflect the possibility that the entire premium paid could be lost.
Equally important, predefined exit criteria may help reduce emotional decision-making during periods of increased volatility.
Illustrative Forward-Looking Case Study
This educational example assumes a position is established while price remains inside the Rising Wedge.
Illustrative bullish scenario
Illustrative objective: Potential UFO resistance near 1.16160.
Illustrative exit: Evaluate closing the position as price approaches the resistance area.
Illustrative bearish scenario
Illustrative objective: Potential UFO support near 1.12885.
Illustrative exit: Evaluate closing the position as price approaches the support area.
A logical invalidation condition for either scenario would be the absence of sustained directional expansion following the breakout, as prolonged consolidation could increase the impact of time decay on the option premiums.
Because option prices evolve dynamically with changes in the underlying price, implied volatility, and remaining time to expiration, the eventual reward-to-risk outcome cannot be predetermined and should therefore be evaluated continuously throughout the life of the position.
Final Thoughts
One of the most valuable lessons in options trading is recognizing that uncertainty itself can create opportunity.
When price is compressed inside a chart pattern, positioned between meaningful technical reference levels, and accompanied by comparatively lower implied volatility, the focus naturally shifts away from predicting direction and toward preparing for expansion.
Whether the market ultimately breaks higher or lower is secondary to the broader principle.
Sometimes, the smartest question is not:
"Where is price going?"
Instead, it is:
"What happens if price finally decides to move?"
Data Consideration
When charting futures, the data provided could be delayed. Traders working with the ticker symbols discussed in this idea may prefer to use CME Group real-time data plan on TradingView: www.tradingview.com - This consideration is particularly important for shorter-term traders, whereas it may be less critical for those focused on longer-term trading strategies.
General Disclaimer
The trade ideas presented herein are solely for illustrative purposes forming a part of a case study intended to demonstrate key principles in risk management within the context of the specific market scenarios discussed. These ideas are not to be interpreted as investment recommendations or financial advice. They do not endorse or promote any specific trading strategies, financial products, or services. The information provided is based on data believed to be reliable; however, its accuracy or completeness cannot be guaranteed. Trading in financial markets involves risks, including the potential loss of principal. Each individual should conduct their own research and consult with professional financial advisors before making any investment decisions. The author or publisher of this content bears no responsibility for any actions taken based on the information provided or for any resultant financial or other losses.
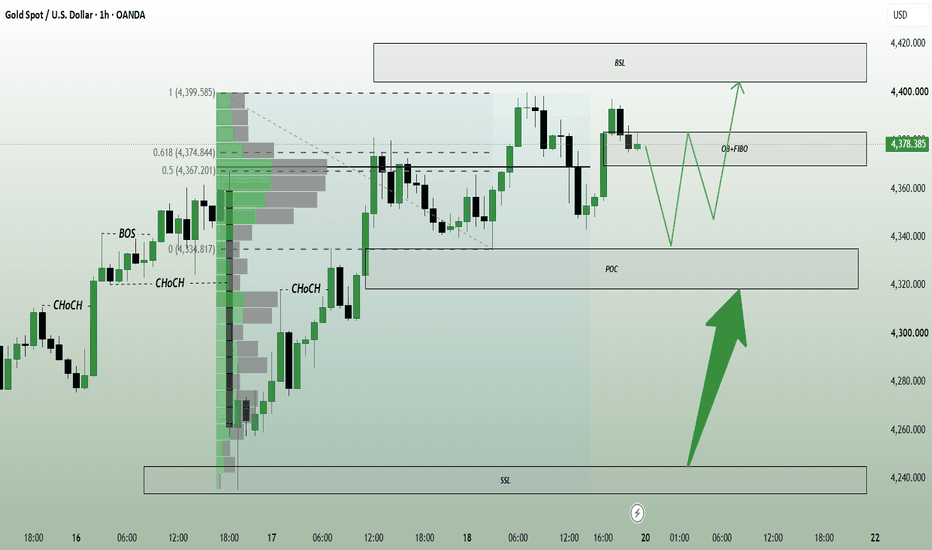
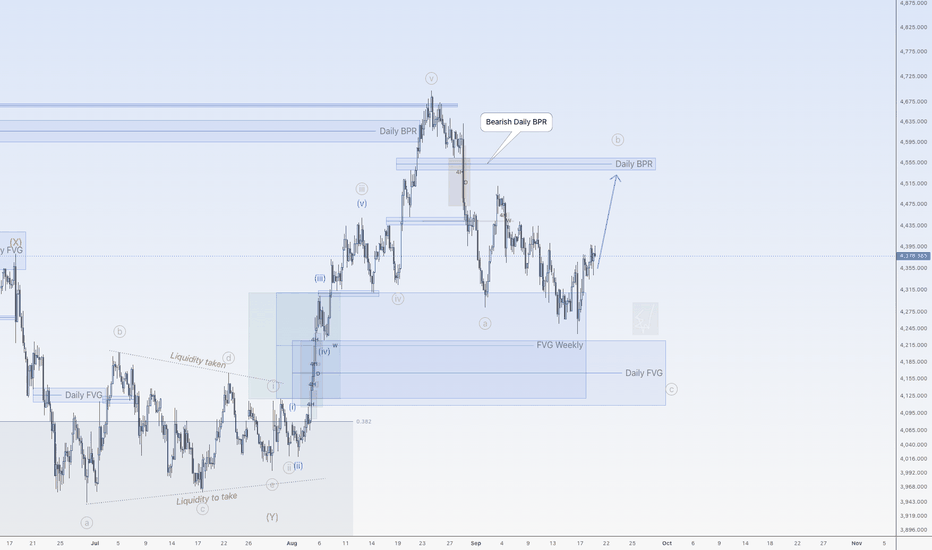
Gold Support Holds, Short Squeeze? Gold price has found support at a key technical level, with the 0.618 Fibonacci retracement providing strong confluence for buyers to step in. This area has acted as an important reaction zone, suggesting the recent correction may be losing momentum. The ability of price to hold above this support increases the probability that the market is preparing for a move higher rather than extending the current decline.
One of the key factors supporting the bullish case is the presence of resting liquidity above current price. This untapped liquidity often acts as a magnet for price action, particularly after periods of aggressive selling where many short positions have accumulated. If buyers continue to defend the current support, an acceleration toward these liquidity pools could trigger a short squeeze, forcing bearish traders to cover positions and adding further momentum to the rally.
However, confirmation remains essential. While the technical structure is improving, this move needs to be supported by increasing bullish volume. Rising volume would indicate genuine market participation and strengthen the probability that the breakout is sustainable rather than simply a relief bounce following heavy selling pressure.
As long as Gold continues holding above the 0.618 Fibonacci support while volume expands, the outlook favours a rotation toward the overhead liquidity, with the potential for an impulsive rally driven by short covering and renewed buying interest.