
Futures market

GOLD (XAUUSD) – Head & Shoulders on the dailyThe daily chart shows a clear Head & Shoulders pattern: Left Shoulder, Head towards 4700, Right Shoulder formed, and price is now testing the neckline around 4285-4290.
📉 Setup:
Pattern: Daily H&S (LS – Head – RS)
Price is sitting on the neckline and attempting to break it to the downside
Target: 4200 / 4150
Extension possible towards 4000 if the fundamentals keep weighing on price
📊 Confluence:
The 4200/4150 zone isn't random — there's an FVG there that lines up across the weekly, daily and 4H. Multiple timeframes pointing to the same reaction zone.
🌍 Fundamentals:
The macro backdrop currently remains bearish for gold and supports the downside case towards the target zone.
🔎 My view:
I'll personally be watching around 4150 for a potential reversal — that's where the H&S target lines up with the multi-timeframe FVG. Until that zone, the bias stays short.
 Short
Short
XAUUSD: FOMC May Decide the 4,255 Break XAUUSD: FOMC May Decide the 4,255 Break
Market Context
Gold remains under pressure near multi-week lows as traders wait for the key two-day FOMC policy meeting.
The market is not giving buyers much confidence here. Higher Fed rate expectations, inflation concerns, firm Treasury yields, and geopolitical risk are still supporting the US Dollar. That keeps gold limited, especially because gold does not offer yield and usually struggles when the USD and yields stay strong.
The important point is this: gold is not just moving sideways. It is still trading inside a descending structure, and every recovery attempt remains weak until buyers reclaim the key resistance zones above.
Technical Structure
Gold is currently trading around 4,290 after failing to build a meaningful recovery above 4,300.
The chart still shows a clear bearish channel. Price continues to form lower highs, and the latest rebound is still trapped below the descending trendline. This tells us that sellers are still controlling the structure.
The nearest key area is 4,255 - 4,285. This is the current liquidity and decision zone. If gold holds this area, a short-term recovery may appear before FOMC volatility expands. But if 4,255 breaks cleanly, sellers may push price deeper toward 4,220 and 4,200.
Above current price, 4,365 - 4,400 is the nearest resistance zone. This area overlaps with the LTF Bearish OB, making it an important sell reaction zone if gold rebounds.
Higher up, 4,410 - 4,440 remains the bearish mitigation zone and internal liquidity area. As long as gold trades below this structure, any recovery can still be treated as corrective.
Key Levels
Current Price: 4,290
Key Liquidity / Decision Zone: 4,255 - 4,285
Immediate Downside Target: 4,220 - 4,200
Nearest Resistance: 4,365 - 4,400
Bearish Mitigation Zone: 4,410 - 4,440
Buy-Side Liquidity / Supply: 4,465 - 4,490
HTF Bearish OB / Major Premium POI: 4,590 - 4,620
Bullish Recovery: Above 4,400
Bearish Continuation: Below 4,255
Trading Plan
Primary Sell Scenario
Entry: 4,365 - 4,400 after bearish confirmation
SL: Above 4,425
TP: 4,300 / 4,285 / 4,255
Condition: Price rebounds into the LTF Bearish OB but fails to break above the descending structure. A rejection from this zone would keep sellers in control.
Breakdown Sell Scenario
Entry: Below 4,255 after breakdown and retest
SL: Above 4,285
TP: 4,220 / 4,200 / 4,180
Condition: Gold loses the key decision zone and fails to reclaim it. This would confirm stronger downside continuation, especially if FOMC strengthens the USD further.
Buy Reaction Scenario
Entry: 4,255 - 4,285 after strong bullish confirmation
SL: Below 4,230
TP: 4,320 / 4,365 / 4,400
Condition: Buyers must show a clean reaction from the liquidity zone. This is only a short-term recovery setup, not a full bullish reversal unless gold reclaims 4,400 with strength.
Bullish Recovery Scenario
Entry: Above 4,400 after breakout and retest
SL: Below 4,365
TP: 4,440 / 4,465 / 4,490
Condition: Gold must break above the LTF Bearish OB and hold above 4,400. Only then does the short-term bearish pressure begin to weaken.
Overall Bias
Gold remains bearish while price stays below 4,365 - 4,400.
The current market is sitting near a dangerous decision zone. Buyers may try to defend 4,255 - 4,285, but the structure still belongs to sellers until gold breaks back above 4,400.
If 4,255 breaks, the next downside leg may open toward 4,220 and 4,200. If buyers defend the zone, a corrective rebound toward 4,365 - 4,400 is possible, but that area may still attract sellers again.
Best approach: do not chase price before FOMC. Wait for either a confirmed reaction from 4,255 - 4,285 or a clear rejection from 4,365 - 4,400.
Will gold defend 4,255 before the Fed decision, or will sellers break the floor and extend the decline?
Long
Gold 4H: My Long Setup Failed, Now $4,300 Is ResistanceThis is the next entry in my KCGI Trading Manual, where I’m continuously documenting my trades, reviewing mistakes, and improving the process
My previous Gold setup was bullish. I was looking for an entry around $4,350, with $4,415 as the first target and $4,308 as the invalidation level.
Okay, looks like bad luck, this failed.Gold rejected the higher levels and broke below $4,308. On the latest 4H chart, price is around $4,272, so I’ve now shifted my bias bearish.
To summarize my mistakes,The biggest mistake was execution.
I identified $4,415 as the bullish confirmation level, but then entered around $4,350 before that confirmation happened and treated $4,415 as my take-profit.
Those two ideas were contradictory.
So, everyone, this is a simple lesson. if a level is my confirmation level, I shouldn’t enter before confirmation simply because the risk/reward looks attractive.
As for now My current bias is bearish below $4,300.
I’m not chasing the move lower around $4,272. Instead, I want to see whether Gold can retest $4,290–$4,300 and reject that horizontal resistance. If it does, that would be my preferred short setup.
If Gold reclaims $4,300 but remains below $4,350, I’ll reassess rather than automatically flip bullish.
A sustained move above $4,375 would invalidate this bearish thesis.
Another improvement to my process is adding ADP + NY Fed Manufacturing to the setup.
I’ll use these data points to evaluate changes in growth, employment and Fed-rate expectations, then compare them with US 2Y/10Y yields and DXY.
In addition, we can also learn from BTC and ETH remain secondary comparisons. If Gold, BTC and ETH all weaken together, I’ll consider the broader risk/liquidity environment. If Gold weakens while BTC and ETH remain strong, I’ll focus more heavily on the rates and dollar explanation.
Short
XAUUSD — Correction Complete? (3 Laddered Buy Plan)Gold sold off hard from its late-January all-time high near $5,600, but the structure now argues the correction is maturing and the primary uptrend is preparing to resume. This idea lays out a scale-in long strategy with a single, well-defined invalidation.
📉➡️📈 The Divergence Story (Top → Bottom)
The rally topped exactly where you'd expect it to: a bearish RSI divergence printed into the highs (price making new highs, momentum failing to confirm) — the classic warning that preceded this multi-month correction. Fast-forward to the June–July base and the mirror image appeared: a bullish divergence (lower price lows, higher momentum lows) marked the exhaustion of sellers. That's the signal I'm trading — momentum turned before price did.
📊 What the Chart Is Telling Us
Price held the $3,950–4,000 support zone (green box), which lines up cleanly with the 0.786–1.0 Fib of the whole advance — a textbook place for a correction to end.
The descending trendline off the highs is being challenged; a decisive daily close above it opens the door back toward the $4,700–4,800 supply zone (red box / 0 Fib at 4,697).
Current price (~$4,290) is coiling around the 0.5–0.618 pocket ($4,317 / $4,227) — the decision area.
🏦 Fundamentals: Structurally Strong for the Long Run
The bid under gold isn't speculative — it's structural. Central banks remain heavy net buyers (Poland added ~51 tons and China ~33 tons in Q2 2026), sitting on top of a persistent mine-supply deficit. Add the geopolitical risk premium from the ongoing Strait of Hormuz/US-Iran conflict and de-dollarization flows, and gold is increasingly trading as a barometer of confidence in the financial system, not just a rate play. Tellingly, major-bank year-end targets sit at or above spot — Goldman ~$4,900, HSBC ~$4,560, JPMorgan ~$4,500.
🏛️ FOMC Effect (Sep 15–16)
This meeting is unusual: for the first time in this cycle a rate HIKE is genuinely on the table, with odds pushed up toward 60–70% as the US-Iran conflict feeds energy-led inflation. A hike is largely priced — the reaction hinges on the dot plot and tone. A hawkish-but-expected outcome likely gives one more dip to buy; any dovish surprise is rocket fuel. Either way, the structural bid caps downside.
⚖️ CLARITY Act Effect (indirect, honest read)
The crypto market-structure bill faces another Senate procedural vote on Sept 15, but many investors now see it as effectively "dead in the water" for 2026, likely slipping into 2027. Net-net a mild positive for gold: regulatory clarity that legitimizes crypto as a rival store of value is the main competitive headwind to bullion — and that catalyst keeps getting pushed out, leaving safe-haven flows parked in gold for now.
🎯 The Trade — 3 Laddered Longs (buy the dip, one common invalidation)
Same stop and target across all three, so the deeper the fill, the better the reward: risk.
Scenario I — Entry 4,250 | SL 3,850 | TP 4,800 (R:R ≈ 1.4)
Scenario II — Entry 4,100 | SL 3,850 | TP 4,800 (R:R ≈ 2.8)
Scenario III — Entry 3,950 | SL 3,850 | TP 4,800 (R:R ≈ 8.5)
🛑 Invalidation: A daily close below $3,850 breaks the support zone and the bullish-divergence thesis — cut and reassess. Trade your own risk; this is analysis, not financial advice.
Long
#XAUUSDHello and good morning everyone! 🌷
🥇 #XAUUSD | Daily Analysis
📅 September 15, 2026
💰 Current Price: 4287.000
Following our previous analysis, after reacting to the 4402 and 4335 support levels and subsequently breaking the 4H support, the market has reached the third major support zone for Daily buyers at 4254.
This area is currently very important for us because as long as Daily buyers continue to defend 4254, the Daily trend remains bullish.
If this support holds, we can look for the following upside targets in the coming days:
🎯 4434.512
🎯 4508.923
🎯 4549.530
🎯 4620.428
🎯 4678.953
🔹 Current Scenario:
I already have a buy position activated at 4265, and within this area, as long as the Daily support at 4254 remains intact, I will continue adding to my buy positions.
However, we should also keep the second scenario in mind.
If 4254 breaks on the Daily timeframe and the market fails to reclaim this level after a pullback, our bullish scenario will be invalidated. In that case, we could see a strong continuation of the bearish move toward lower targets, including:
🎯 4181
🔑 For now, 4254 is the key decision level:
Holding 4254 = Bullish Daily scenario remains valid 📈
Break + failed retest = Potential strong bearish continuation 📉
As long as 4254 holds, buyers still have the upper hand. 🔥
Long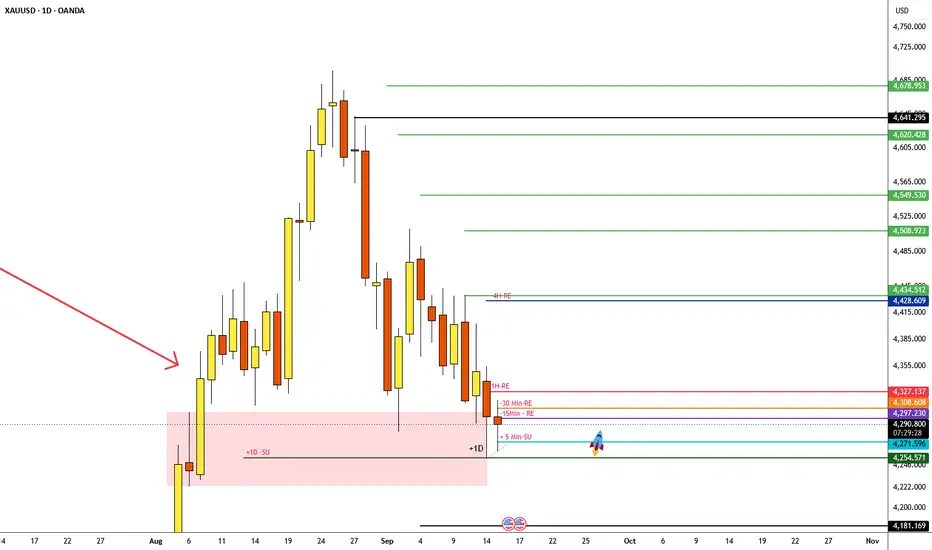
XAUUSD 15M: Bullish Break of Structure (BOS) ConfirmationDisclaimer & Purpose
This post is strictly for educational, analytical, and charting practice purposes only. It is not a financial idea, trading signal, or investment advice. Always manage your own risk and perform independent research.
Market Context
On the 15-minute timeframe, Gold (XAUUSD) has swept liquidity near the lower demand area (~$4,260 region) and produced a local bullish Break of Structure (BOS) above the $4,273 level. This structure shift indicates a potential shift in short-term momentum from bearish to bullish.
Technical Reference Levels
BOS Confirmation / Entry Level: ~$4,273.26 (Break of Structure Level)
Invalidation / Structural Stop: ~$4,261.47 (Below the recent swing low and lower demand block)
Upside Target / Resistance Level: ~$4,344.70 (Key overhead supply area)
Technical Setup Logic
Following the sweep of the lower support boundary, price broke above immediate lower-high resistance to mark a local BOS at $4,273.26. Technical analysis maps a trade entry following this structural confirmation, targeting the upper resistance zone around $4,344 while placing structural invalidation below $4,261.47.
Long
USOIL: Bulls Still in Control — Buy the Dip or Breakout?Crude oil maintains a structurally bullish trend, with prices holding steady above the psychological level of $100. Recent price movements have been primarily driven by renewed concerns about Middle Eastern supply, including reports of disruptions to Saudi Arabia’s East-West Pipeline. Although the upward momentum remains strong, there are signs of overextending.
Key Levels
Resistance: 103.50–104.20 → 106.00–107.00
Support: 101.20–100.80 → 99.50–98.50
Major Support: 97.50
Trading Strategy: Buy on dips, avoid chasing highs. When prices are above $100, the bulls are in control; if they fall below $100, the short-term market structure will weaken significantly.
TVC:USOIL CXM:USOIL IG:USOIL GBEBROKERS:USOIL PURPLETRADING:USOIL


Day 3 of journaling this gold setupSometimes the market teaches you the lesson after you change your plan.
After Friday’s CPI spike pushed Gold into my 4238 Order Block, I was watching how price would react from there.
The key level for me was the 4371 IND.
The next few candles failed to close above it. In fact, price closed back below the level, and got a bearish candle confirmation.
And eventually, price did exactly what I initially thought it wouldn’t do — it pushed down into my original target zone.
Now we’re seeing how price is reacting from that area.
The lesson?
Trading Gold, commodities, or stocks isn’t just about technical analysis.
The same macro catalysts that move crypto — CPI, Fed decisions, economic data, major legislation and other fundamental events can drive these markets too.
What changes is how price delivers that information through liquidity and market structure.
That’s something I’m paying much more attention to as I continue journaling:
I hope someone is learning from this. See you next time.
Long
XAUUSD Multi-Timeframe Plan: 1H/4H Key Levels & Scenarios
📊 XAUUSD Multi-Timeframe Structure
Gold is currently trading inside an important multi-timeframe structure. On the 15-minute chart, the TupTrader Multi-Timeframe Key Levels indicator is projecting the key OHLC levels from the 1H and 4H reference candles.
The larger structure remains bearish, while the shorter reference structure is bullish. This creates a useful decision area rather than a simple directional signal.
Current price at the time of this analysis: ~4283.97
📈 Bullish Scenario
Conditions:
✅ Price holds above the 1H Open around 4281.545.
✅ Price reclaims the 1H Close around 4284.740.
✅ A sustained break above the 1H High at 4286.785 confirms that the shorter-term bullish structure is still controlling the rebound.
Upside Targets:
First target: 4284.740 – 4286.785 → 1H Close/High resistance zone.
Second target: 4304.975 → 4H Open and an important higher-timeframe resistance level.
Extension target: 4307.775 → 4H High and the upper boundary of the larger bearish structure.
Bullish Invalidation:
❌ A sustained move back below 4278.725, the 1H Low, weakens the short-term bullish structure.
A deeper break toward or below the 4H lower boundary around 4262 would invalidate the current recovery structure more decisively.
📉 Bearish Scenario
Conditions:
✅ Price fails to reclaim 4284.740 – 4286.785 and is rejected from the 1H Close/High zone.
✅ Price subsequently loses the 1H Open at 4281.545.
✅ A break below the 1H Low at 4278.725 confirms failure of the shorter-term bullish structure.
Downside Targets:
First target: 4278.725 → 1H Low.
Second target: ~4262.540 → 4H Close and lower part of the larger structure.
Extension: A clean break below the 4H lower boundary would signal bearish continuation outside the current higher-timeframe range.
Continuation Trigger:
📉 A failed retest of 4278.725 – 4281.545 after a breakdown would be important. If the former 1H Low/Open area flips from support into resistance, the bearish continuation case becomes stronger.
🔍 Key Multi-Timeframe Takeaways
✅ The larger reference structure is still bearish.
✅ The shorter reference structure is bullish, showing an active rebound inside that larger bearish context.
✅ 4284.740 – 4286.785 is the immediate upside decision zone.
✅ 4278.725 – 4281.545 is the immediate support/decision zone.
✅ The larger boundaries near 4262 and 4305–4308 remain the major higher-timeframe reference levels.
The important point is not to treat any single level as an automatic buy or sell signal. The levels provide structure; price behavior around them provides confirmation.
🗓️ Action Plan
Bullish Bias: If price holds above 4281.545 and successfully reclaims 4284.740–4286.785, watch for continuation toward 4304.975 and 4307.775.
Bearish Bias: If price is rejected from 4284.740–4286.785 and then loses 4281.545 / 4278.725, watch for a return toward the lower 4H structure around 4262.
Neutral / No Trade: If price remains trapped between approximately 4278.725 and 4286.785, there is no need to force a directional position. Wait for a confirmed break or reclaim.
⚖️ Risk / Reward
The distance between entry and structural invalidation should determine position size — not the desired profit target.
Avoid increasing risk simply because price is close to a key level. A level identifies a location; it does not guarantee a reaction.
🔑 Key Confirmations
✅ Watch candle closes around the reference OHLC levels rather than reacting only to intrabar touches.
✅ Look for agreement between the 1H structure and the larger 4H context.
✅ A breakout followed by a successful retest provides stronger structural evidence than the initial touch alone.
Current structural state: shorter-term bullish rebound inside a larger bearish reference structure.

Gold Wedging into the FedGold broke out in a big way after the last FOMC rate decision, and the big takeaway there was that Kevin Warsh wanted to sound hawkish without actually hiking rates. For this one, however, it looks like there may be little choice as Warsh is but one voice at the Fed and continued strength in inflation, combined with high oil prices, have pushed higher the odds of a move at tomorrow's meeting.
That seems well priced-in for gold but what matters now is what's next. Will the Fed open the door for a second hike this year, as markets are pricing in? This could, of course, risk equity rallies just two months ahead of mid-term elections. Or, will Warsh try to soften the blow during the press conference with talk about confidence around inflation and economic stability despite surging Treasury rates?
In gold, there's a door for bullish reversals but bulls are going to need to move quickly. There's a falling wedge on the daily chart and these are often approached with aim of bullish reversal. The logic being that sellers aren't stretching at lows while they are still hitting pullbacks - and that lack of confidence to drive bearish breakouts is a fact that could eventually turn into less enthusiasm on selling rips. - JS

XAUUSD Gold.XAUUSD Gold.Reacting from H1 FVG to go long Make sure to trade with proper Risk management..
Long
BRIAN XAUUSD – GOLD WEAK BELOW 4,338 BRIAN XAUUSD – GOLD WEAK BELOW 4,338
Gold remains under pressure as the market moves into the FOMC decision window.
Price is now trading around 4,275 after another failed recovery attempt, while the broader short-term structure continues to show lower highs and weak buyer follow-through. Fundamentally, the market is still cautious. Gold is marking another down day as traders wait for the two-day FOMC policy meeting, and this keeps positioning defensive ahead of the rate decision.
When gold trades near a one-month low before a major Fed event, the market usually becomes very sensitive to any rejection or breakdown around key value zones. That is exactly what the current chart is showing.
Technical structure
On the H1 chart, gold is trading below the Current VAH / POC immediate volume zone around 4,290 - 4,306.
This zone is important because it was the latest short-term value area. Price tried to stabilize there, but the reaction was weak. As long as gold stays below this zone, buyers do not have real control.
The next important resistance is the Key Rotation Area around 4,338 - 4,365. This is the area where any recovery may face stronger selling pressure. If gold pulls back into this zone and rejects, the bearish continuation view remains valid.
Above that, the Upper Value Rejection zone around 4,500 remains the major seller interest area. This was where the larger bearish rotation started, and it continues to define the upper structure.
On the downside, gold is now approaching the 4,232 area. If sellers keep control below 4,306, the market can rotate lower into this level before any stronger buyer reaction appears.
Important zones
Current price area: 4,265 - 4,280
Gold is trading near the lower part of the structure after losing short-term value.
Current VAH / POC: 4,290 - 4,306
Immediate resistance. Buyers need to reclaim this area to slow the bearish pressure.
Key Rotation Area: 4,338 - 4,365
Main reaction zone if gold attempts a deeper pullback.
Strong Acceptance Zone: 4,290 - 4,310
Previous value support, now acting as a pressure area after the breakdown.
Upper Value Rejection: 4,490 - 4,510
Major seller interest zone and higher resistance.
Downside liquidity: 4,232 - 4,240
Next lower target if sellers continue pushing the auction lower.
Trading scenario
Priority view: sell on recovery below 4,306
Entry:
Look for sell positions only if gold rebounds into 4,290 - 4,306 or higher into 4,338 - 4,365 and shows clear bearish rejection.
Stop Loss:
Above the rejection high or above the reclaimed value zone.
Take Profit:
TP1: 4,250
TP2: 4,232 - 4,240
TP3: 4,200 if FOMC-driven momentum supports another downside expansion
This setup follows the current bearish structure. Gold has already lost short-term value, so chasing sell late near the low is not ideal. The cleaner plan is to wait for a retest and rejection from resistance.
Alternative buy scenario
A buy setup is only interesting if gold sweeps the 4,232 - 4,240 liquidity area and shows strong bullish rejection.
Entry:
Buy only after clear confirmation from the lower liquidity zone.
Stop Loss:
Below the local sweep low.
Take Profit:
TP1: 4,290 - 4,306
TP2: 4,338
TP3: 4,365 if buyers reclaim momentum
This would only be a reaction-buy setup, not a full bullish reversal yet. For a stronger recovery, gold needs to reclaim 4,306 first, then hold above 4,338.
Final view
Gold is still under seller control while trading below 4,306.
The market is heading into the FOMC meeting with weak momentum, and the current chart suggests that sellers are still defending every recovery attempt. The nearest downside area to watch is 4,232 - 4,240. If price reaches this zone, buyer reaction may appear, but confirmation is needed before considering any long setup.
For now, my map is simple:
Below 4,306 = sellers keep control.
Reject 4,306 = downside pressure continues.
Break 4,338 = recovery improves.
Reject 4,338 - 4,365 = bearish structure remains valid.
Lose 4,232 = downside can extend toward 4,200.
Gold is not in a clean bullish position yet. The best approach is patience: wait for either a confirmed rejection from resistance or a strong reaction from the lower liquidity zone.
Will gold defend 4,232 before the FOMC decision, or will sellers force one more deep flush first?
Long Long
Long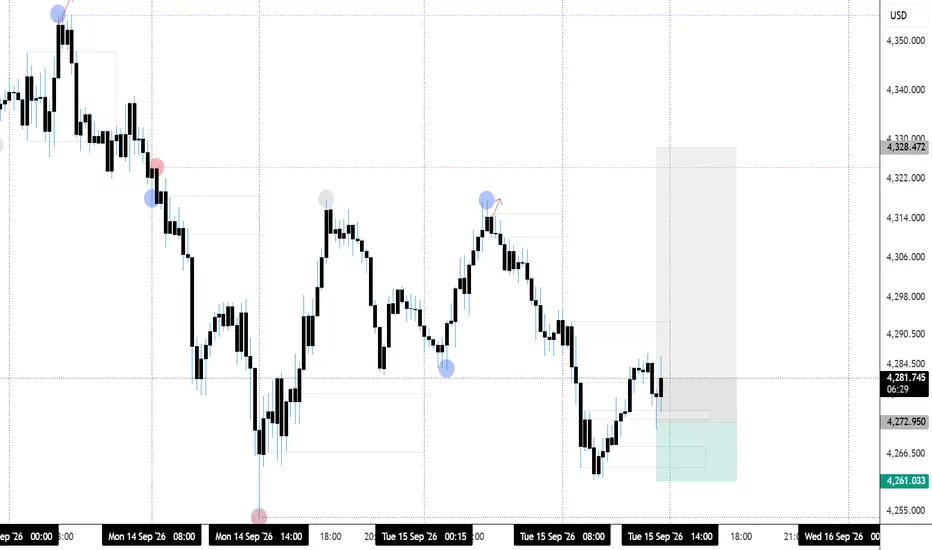
Maintaining a bearish stance for TuesdayMaintaining a bearish stance for Tuesday
Real-time gold analysis for September 15: The 4300 level has been breached, confirming the bearish outlook, though a key risk warrants attention.
First, it must be noted: Gold prices can only regain upward momentum if they firmly hold above the 4300 mark.
Currently, gold is trading steadily below $4300, indicating that the bearish trend remains strong.
As long as the price fails to stabilize above 4300, our strategy remains bearish (short-selling).
It is recommended to place stop-loss orders above $4300.
The probability of a rate hike has surged to 92%; the market has almost fully priced in the expectation of a 25-basis-point hike this Wednesday.
This implies that the rate hike itself will not trigger fresh downward pressure.
The real risk lies here: if the language in Wednesday's statement is not sufficiently hawkish, gold prices could quickly rebound above 4300.
The core market dynamic right now is a "wait-and-see" decline following the full pricing-in of expectations.
Both bulls and bears are awaiting Wednesday's events.
Trading Strategy for Today:
Short-selling conditions:
Consider shorting if the price rebounds to the 4290–4300 zone and faces resistance.
Set the stop-loss above 4310.
Targets: 4260 → 4250.
However, abandon the short strategy in the following scenarios:
If the price quickly recovers the 4300 level and stabilizes—indicating the market views the "bad news" as fully priced in—short positions should be closed.
If the price drops directly to 4250 without a rebound, do not chase the short. The 4250 area is a weekly-level "Buy 2" target identified by the VC PMI indicator; bears may choose to take profits at this level.

XAUUSD ANALYSIS & KEY LEVEL— 10Y HIGHEST LEVEL1. MARKET STRUCTURE
Gold is trading around **$4,284**, holding near the **$4,260–$4,300** area after a third weak week. The daily and weekly structure remain bearish, with lower highs following the August rejection near **$4,680**. The downside BOS remains active below the **$4,350–$4,400** shelf, while no confirmed bullish CHOCH has formed yet. A move above **$4,425–$4,450** would be needed to signal a stronger recovery.
2. KEY LEVELS
**Support:** $4,250–$4,270 → $4,160
**Resistance:** $4,313–$4,355 → $4,425–$4,450
**Sell Zone:** $4,313–$4,355
**Buy Zone:** $4,250–$4,270
Liquidity remains below the recent lows around **$4,253–$4,261**, while the **$4,350–$4,400** area remains an important supply/FVG zone. A break below **$4,253** could open further downside toward **$4,160**. A confirmed reclaim above **$4,425–$4,450** would weaken the bearish setup.
3.DXY & YIELDS
DXY is holding around **99.1–99.6**, while the US 10Y is around **4.14%** after pulling back from the recent yield spike. The dollar remains firm and higher yields continue to create pressure on gold, although the recent decline in yields is providing some short-term relief.
4. MACRO & FED
The **FOMC rate decision is the key catalyst this week**. Markets are pricing around **85–90% odds of a 25bp hike** to the **3.75%–4.00%** range. A hawkish decision, higher dots, or hawkish guidance could strengthen the dollar and push gold lower, while a dovish statement or press conference could trigger a recovery.
5. GEOPOLITICAL RISK
US-Iran tensions, Red Sea attacks, Russia-related sanctions and elevated oil prices continue to support safe-haven demand. However, higher oil-driven inflation could increase pressure on the Fed to remain hawkish, creating a mixed but overall challenging environment for gold.
6.TRADE BIAS
**Bearish: 65% | Bullish: 35%**
**Confidence: Medium**
Gold remains bearish-leaning while below **$4,425–$4,450**. The main downside drivers are elevated FOMC hike expectations, a firm dollar and the bearish daily structure, while ETF demand and geopolitical risk continue to provide some support.
7. CONCLUSION
Gold remains **bearish in the short term** while price stays below **$4,425–$4,450**. A break below **$4,253** could expose **$4,160**, while holding the **$4,250–$4,270** area could trigger a recovery.
The **FOMC decision and press conference on September 16** remain the major catalyst and could determine whether gold continues lower or starts a stronger bullish recovery.
**NEXT MAJOR CATALYST: FOMC — 16 SEPTEMBER, 14:00 ET**
**INVALIDATION: DAILY CLOSE ABOVE $4,450**
*Not financial advice. Manage risk carefully.*

MESZ Sep 15: 7719 Breakout or 7644 Breakdown?MES has rolled into the Z contract, and MESZ is now trading after a liquidity sweep around 7,652.
The first upside level I’m watching is 7,719. A confirmed 1-hour or 4-hour close above that level could support continuation toward the next major target around 7,750.
On the lower time frame, price has reclaimed approximately 7,680, which gives an early bullish signal and keeps 7,719 in focus.
There is also a fair value gap around 7,664, which could act as a short-term reaction area if price pulls back.
On the downside, 7,644 is the key invalidation level. A confirmed 15-minute close below that area could weaken the bullish setup and open the path toward 7,600.
Key levels: 7,680 early bullish confirmation, 7,719 breakout level, 7,750 upside target, 7,664 FVG, 7,644 bearish trigger, 7,600 downside target.
Bullish: hold above 7,680 → 7,719 → 7,750.
Bearish: lose 7,644 → watch 7,600.
Not financial advice. No confirmation, no trade. CME_MINI:MESZ2026
 Long
Long
XAUUSD Price Outlook: Gold Spot / U.S. Dollar Tests 100% ARCXAUUSD Price Outlook: Gold Spot / U.S. Dollar Tests 1 (100%)
Arc | Awaiting Directional Confirmation
Overview: Based on Arc Cycle Analysis™ applied to the 2h chart, Gold Spot / U.S. Dollar is
interacting with the 1 (100%) Arc within the current Arc Cycle. Price remains centered around this
Arc, indicating that directional confirmation has not yet been established.
Short
GOLD | Storyline XAUUSD — STRUCTURE TELLS THE STORY
A simple price-action breakdown using Support, Resistance & Market Structure.
• 1. THE ORIGINAL TREND
Gold was previously respecting an uptrend , creating a sequence of higher highs and higher lows.
• 2. THE SHIFT
After reaching the highs, momentum weakened and price started forming a series of lower highs.
• 3. RESISTANCE
The descending trendline acted as a clear resistance area, repeatedly rejecting bullish attempts.
• 4. SUPPORT BREAK
The 4,320 area had previously acted as support. Once price moved below it, the zone became an important area to watch for a potential support → resistance flip .
• 5. THE NEXT AREA OF INTEREST
If bearish structure continues, the previous resistance zone around 4,160 becomes an important historical support area to monitor.
THE KEY IDEA
Price doesn't move randomly — it leaves a structure behind.
Trend → Structure Shift → Resistance → Support Break → Potential Continuation
The real question isn't simply:
BUY or SELL?
It's:
What is price structure telling you before you make the decision?
💬 What's your analysis?
Are you seeing a continuation lower, or do you expect price to reclaim the 4,320 area?
Educational purposes only. Not financial advice.
Education
Brent Crude Compresses After Breaking $100Having broken through $100 with increasing momentum, Brent crude has pressed pause on its recent rally. Two consecutive inside days have formed on the daily chart, while the four-hour picture shows price compressing into an increasingly tight consolidation.
After such a sharp acceleration, the lack of any meaningful pullback is significant. The question now is whether Brent is simply absorbing the recent advance before momentum returns, or whether this compression marks the first stage of a deeper correction.
Momentum has changed gear
The steepening trendlines on the daily chart help put the recent move into context. Each successive phase of the advance from the July low has developed at a faster rate, culminating in the break through the July swing high and $100.
The significance of that acceleration is what happens when the pace inevitably slows. A loss of momentum after such a steep move tells us relatively little on its own. How much ground Brent has to surrender while momentum resets is potentially much more revealing.
So far, the answer is very little. Rather than retracing sharply after the breakout, Brent has produced two consecutive inside days while remaining above the former July swing resistance. The market has stopped accelerating, but there is little evidence yet that the underlying structure has deteriorated with it.
Brent Crude (UKOIL) Daily Candle Chart
Past performance is not a reliable indicator of future results
Compression sharpens the setup
The four-hour chart gives us a more precise way of judging what happens next. The wide ranges accompanying the latest leg higher have disappeared and price is now compressing into a tightening triangle.
The rising 21-period EMA has also caught up with price during the pause. Some of the short-term extension created by the rally is therefore being worked off without requiring a meaningful retracement.
Brent Crude (UKOIL) Four-Hour Candle Chart
Past performance is not a reliable indicator of future results
Simply seeing price leave the triangle will only provide part of the information. A break higher followed by acceptance outside the consolidation would suggest Brent has absorbed the pause without materially damaging its recent momentum. The major resistance zone sitting above the market on the daily chart would then become the next important test.
A downside break would deserve attention, but it would not carry the same significance as losing the structure underneath. Falling out of the four-hour compression would suggest immediate momentum is weakening. Falling back through the former July swing resistance would tell us something more important about whether the recent breakout itself is beginning to fail.
That distinction is what makes the current compression useful. Brent does not need to keep accelerating for the bullish structure to remain intact, but the amount of ground it gives back as momentum cools should tell us plenty about the quality of the move.
Disclaimer: This is for information and learning purposes only. The information provided does not constitute investment advice nor take into account the individual financial circumstances or objectives of any investor. Any information that may be provided relating to past performance is not a reliable indicator of future results or performance. Social media channels are not relevant for UK residents.
Spread bets and CFDs are complex instruments and come with a high risk of losing money rapidly due to leverage. 89% of retail investor accounts lose money when trading spread bets and CFDs with this provider. You should consider whether you understand how spread bets and CFDs work and whether you can afford to take the high risk of losing your money.

$US30 Bearish Continuation?I reckon bearish momentum could still continue on today during the NY trading session, price is retracing back up into an interesting POI area... could look at targeting previous days low if confirmation presents itself in the markets.
- Aman | SMC Wolf FX
 Short
Short
Gold (XAUUSD) Smart Money Analysis | SMC EMA & RSI StrategyGold (XAUUSD) Smart Money Analysis | SMC, EMA & RSI Strategy
This Gold (XAUUSD) educational chart explains how professional traders analyze every candle using Smart Money Concepts (SMC), EMA trend confirmation, RSI momentum, liquidity zones, and price action. Each candle gives information about buyer and seller strength, market direction, and possible institutional activity.
Professional traders do not enter trades because of a single candle. They study the reason behind candle formation, location, momentum, and confirmation from indicators.
---
1. Bullish Momentum Candles
Strong green candles with large bodies show aggressive buying pressure.
Reason:
Buyers are controlling the market because demand is stronger than supply. These candles often appear after liquidity collection or support reaction.
Trading Insight:
A strong bullish candle above EMA confirms that buyers have momentum.
---
2. Bearish Rejection Candles
Candles with long upper wicks show rejection from higher prices.
Reason:
Buyers attempted to push price higher, but sellers entered and created resistance.
Trading Insight:
Rejection candles near resistance can indicate a possible pullback.
---
3. Liquidity Sweep Candles (SMC)
Description:
Price takes previous highs or lows and quickly reacts.
Reason:
Smart money targets liquidity areas where many traders place stop losses before making the real move.
Trading Insight:
A liquidity sweep combined with structure confirmation creates a stronger setup.
---
4. CHoCH (Change of Character) Candles
A candle breaks the previous market structure.
Reason
The balance between buyers and sellers changes. The previous trend loses strength and a new direction may begin.
Trading Insight:
CHoCH is an early signal of a possible reversal.
---
5. BOS (Break of Structure) Candles
A strong candle breaks an important high or low.
Reason:
The market confirms that one side has gained control.
Trading Insight:
BOS provides confirmation for trend continuation.
---
6. Order Block Reaction Candles (SMC)
Price returns to an important institutional zone and reacts.
Reason:
Large market participants may have placed orders in these areas.
Trading Insight:
Order blocks become stronger when supported by liquidity and EMA direction.
---
7. EMA Confirmation Candles
Candles moving above or below EMA show trend direction.
Reason:
EMA acts as dynamic support or resistance and helps identify market momentum.
Bullish Condition:
Price above EMA = buyers have control.
Bearish Condition:
Price below EMA = sellers have control.
---
8. RSI Momentum Candles
RSI shows the strength behind price movement.
Reason:
Price may move higher or lower, but RSI helps identify whether momentum supports that move.
Bullish Confirmation:
RSI strength increases with bullish candles.
Bearish Confirmation:
Weak RSI with rejection candles can signal slowing momentum.
---
9. Target & Profit Taking Candles
Description:
After a strong move, candles become smaller or create rejection.
Reason:
Traders start securing profits and new buyers/sellers enter near important levels.
Trading Insight:
Always watch resistance, liquidity, and momentum before expecting continuation.
---
Final Gold Trading Lesson
Every candle has a purpose:
Large Body Candle → Strong Market Pressure
Long Wick → Rejection & Liquidity Hunt
Small Candle → Accumulation / Indecision
SMC → Institutional Market Behavior
EMA → Trend Confirmation
RSI → Momentum Strength
BOS → Structure Confirmation
CHoCH → Trend Shift Signal
Liquidity → Main Market Target
Gold moves through liquidity and reacts around important zones. Combining SMC, EMA, RSI, and price action helps traders understand the reason behind every candle instead of simply following movement.
Education
Gold rebounded from the 4,262 area and stalled under the 4,290OANDA:XAUUSD , US session read from my KenKem Master Volume Profile (MVP) indicator & strategy.
CONTEXT
Pre-open, about 30 minutes before New York. Price 4,282 has recovered from the 4,262 low but sits under VWAP (4,289) and under the M15 EMA 100 and 200, so the broader structure still leans lower. Net-volume pressure on the rebound reads buyer-led, which is why this is a lean and not a verdict.
KEY ZONES
• Resistance / supply: 4,289.7 to 4,290.6 (value area high + master POC, with VWAP just under), then 4,299.5
• Support / demand: 4,277.7 (master value area low), then 4,266.9 to 4,263.8
• Point of Control (volume magnet): 4,266.9
SCENARIOS (to watch, NOT signals)
📉 Bearish (slightly more likely, roughly 55/45): an M5 close back under 4,277.7 opens 4,266.9, then 4,263.8 (thin trade between the value area low and the POC).
📈 Bullish: a close above 4,290.6 opens 4,299.5 (buyer pressure on the rebound is still active).
↔️ Range/unclear: stuck between 4,277.7 and 4,290.6, stand aside until a decisive close.
⛔ Invalidation: a close above 4,299.5 voids this lower-leaning map.
WHAT THE MVP TOOL IS SHOWING
The Master Volume Profile plots rolling value areas (VAH/VAL), the Point of Control, and a net-volume pressure read to locate where volume is building or drying up. This idea is the qualitative output of that tool; the strategy's internal thresholds, gating and entry/exit logic are not disclosed.
Built with the KenKem Master Volume Profile indicator & strategy.
Technical analysis only, by KenKem's algorithm, NOT financial advice. Trade your own plan and manage your risk.
