XAGUSD 4H: Market Structure, Liquidity & FVG/OB Reaction Zones📊 Analysis
Silver has recently shown a 4H bearish structural shift, followed by consolidation around the 63.00–65.00 area.
The chart highlights two major reaction zones:
🔴 4H FVG + OB — 66.8–68.0
This upper zone represents an area of previous imbalance combined with an order-block structure.
If price retraces into this region, the reaction will be important. A rejection could indicate that sellers are still defending the upper supply area, while sustained acceptance above the zone would weaken the current bearish interpretation.
🔵 4H FVG + OB — 61.2–62.2
This lower zone is the major demand/imbalance area marked on the chart.
If price moves lower into this region, the response around the zone could provide information about whether buyers are willing to defend the previous structure.
📍 Liquidity Areas
The chart also identifies several sell-side liquidity (SSL) levels around:
65.0
68.5
71.0
These levels can act as potential liquidity references as price develops.
🧠 Market Structure
The broader structure shows an earlier bullish sequence with multiple BOS events, followed by a sharp bearish displacement. Price is now attempting to recover from the lower consolidation area.
For me, the key question is not simply whether price goes up or down, but how price reacts when it reaches the marked 4H FVG/OB zones.
A reclaim and sustained acceptance above the upper zone would require reassessing the bearish structure. Conversely, rejection from the upper zone followed by weakness around the current range would keep the downside structure relevant.
This analysis is based on market structure, liquidity, FVGs and order-block interaction. It is a technical study, not financial advice. Price can invalidate either scenario, so risk management remains important.
🏷️ Hashtags
#XAGUSD #Silver #Forex #TechnicalAnalysis #MarketStructure #Liquidity #FVG #OrderBlock  Long
Long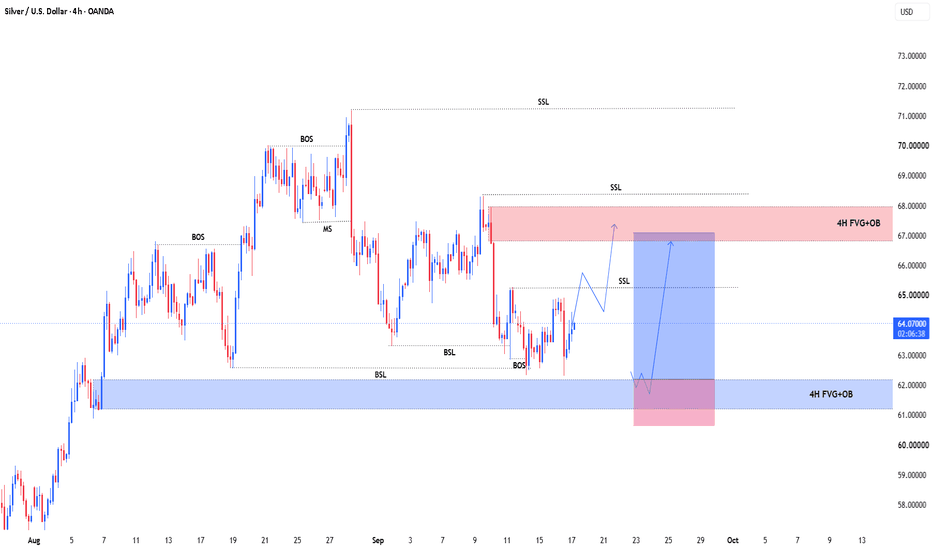
Gold (XAU/USD): news flow leaning bearish — the net read
Gold (XAU/USD) did not get one story today, it got several, and they do not all point the same way. Weighed against each other — new against old, and tracking which ones have already faded:
−− Analysis-Fed builds credibility, but hawkish turn leaves investors edgy
−− With Fed credibility on the line, Warsh just delivered a hawkish answer
− Goldman Sachs sees October Fed hike after hawkish signal (fading)
63 stories were weighed in this window; the 3 carrying the most weight are listed.
Net read: −−− leaning bearish — top of our scale.
What this is: a measure of which way the *news* is leaning right now — not a promise about price. A read being right and a read still being worth taking are two different things: once price has travelled a long way from where the read was published, it is stretched, and a lean that is stretched is a no-chase rather than an invitation.
Weight is not fixed either. A fresh headline lands, the balance tips, and the net read can flip inside an hour — that shift is the part worth watching, not the first print.
I will post an update under this idea once the market has had time to speak, either way.
(Informational only — not financial advice, not a signal.)  Short
Short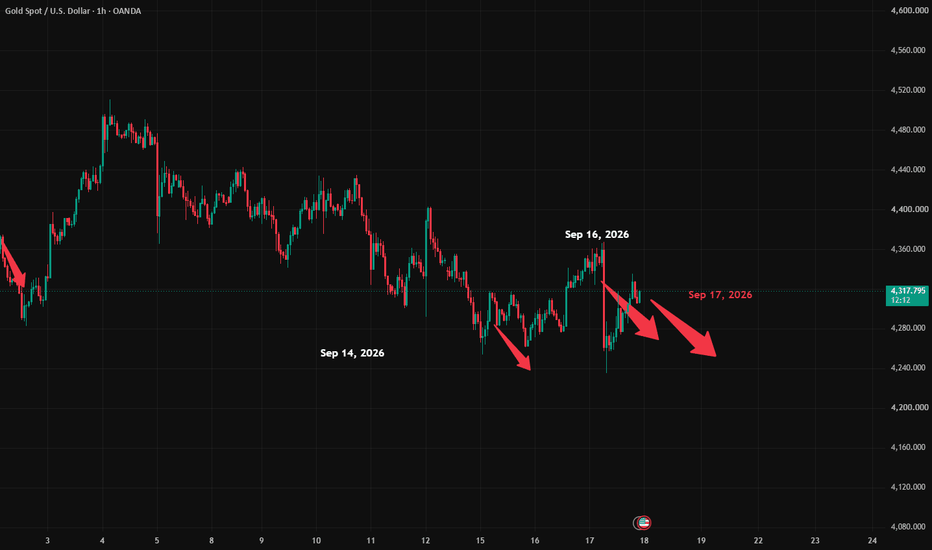
Silver (XAG/USD): news flow leaning bearish — the net read
Silver (XAG/USD) did not get one story today, it got several, and they do not all point the same way. Weighed against each other — new against old, and tracking which ones have already faded:
−− Hawkish Fed lifts dollar to seven-week high; markets brace for BOE, BOJ
− Japanese Yen outperforms as BoJ’s policy takes centre stage
− Analysis-Fed builds credibility, but hawkish turn leaves investors edgy (fading)
64 stories were weighed in this window; the 3 carrying the most weight are listed.
Net read: −−− leaning bearish — top of our scale.
What this is: a measure of which way the *news* is leaning right now — not a promise about price. A read being right and a read still being worth taking are two different things: once price has travelled a long way from where the read was published, it is stretched, and a lean that is stretched is a no-chase rather than an invitation.
Weight is not fixed either. A fresh headline lands, the balance tips, and the net read can flip inside an hour — that shift is the part worth watching, not the first print.
I will post an update under this idea once the market has had time to speak, either way.
(Informational only — not financial advice, not a signal.)
Short 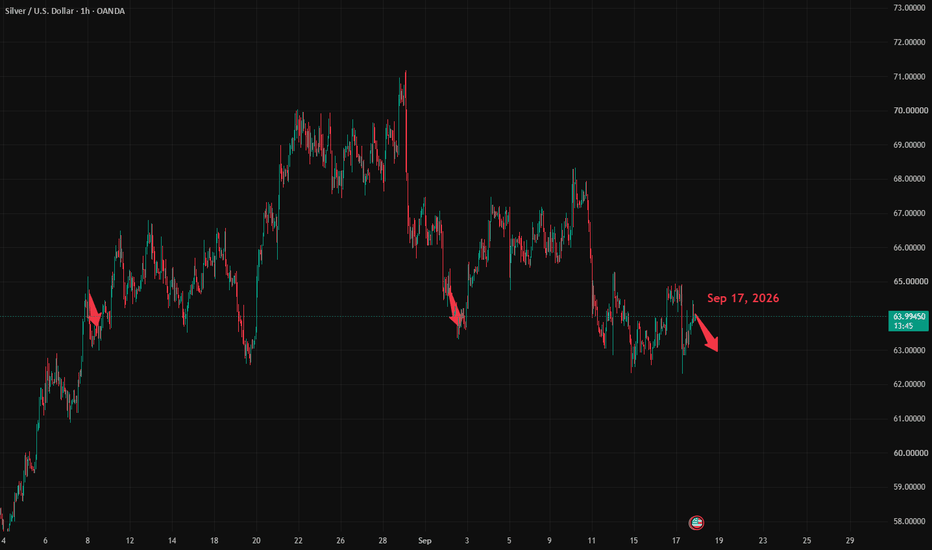
WTI CRUDE OIL — 2H PROFESSIONAL MARKET ANALYSIS🛢️ WTI CRUDE OIL — 2H PROFESSIONAL MARKET ANALYSIS
📊 MARKET STRUCTURE
WTI Crude Oil is currently trading around 103.40 on the 2H timeframe. The broader structure shown on the chart remains contained within a bearish descending channel. Price has recently pushed upward toward the upper boundary of the channel, where significant resistance and supply are present.
The key area to watch is around 106.00–107.00, where the chart shows a clearly marked resistance level at 106.79 together with an order block / supply zone.
🔴 BEARISH SCENARIO
If price moves back into the 106.00–107.00 resistance/order-block zone and produces a strong bearish rejection, this could provide a potential short setup.
📍 Potential Entry: 106.20–106.80
🛑 Stop Loss: 107.30–107.50
🎯 TP1: 103.50
🎯 TP2: 100.50
🎯 TP3: 95.50–96.00
The first target is near the current price area, while the deeper targets align with progressively lower levels inside the channel and the marked demand/order-block zone around 95.50–96.00.
🧠 WHY THE SHORT SETUP MAKES SENSE
Several technical factors are aligning:
🔹 Upper Channel Resistance: Price is approaching the upper side of the descending channel.
🔹 Horizontal Resistance: The chart identifies approximately 106.79 as a major resistance level.
🔹 Supply / Order Block: The highlighted zone around 106–107 represents an area where sellers may become active.
🔹 Bearish Channel: Until price establishes a sustained breakout above the channel, the existing channel structure remains relevant.
🔹 Downside Liquidity: A move lower could initially target the 103.50 area, followed by the lower regions around 100.50 and 95.50–96.00.
⚠️ INVALIDATION & CONFIRMATION
Avoid entering purely because price reaches the resistance zone. A better technical confirmation would be a 2H bearish rejection, bearish engulfing candle, or clear failure to break the 106.79 resistance.
If price instead breaks above 107.00–107.50 and establishes a strong 2H close above the resistance/channel structure, the bearish setup should be reconsidered because the expected rejection would no longer be confirmed.
📌 TRADE PLAN
SELL ZONE: 106.20–106.80 🔴
SL: 107.30–107.50 🛑
TP1: 103.50 🎯
TP2: 100.50 🎯
TP3: 95.50–96.00 🎯
Overall chart bias: 🔴 Bearish while price remains below the 106.79–107.00 resistance area.
This is a technical chart interpretation, not a guarantee of future price movement. Risk should be managed according to your own trading plan.
Would you like the next version as
TradingView post style or
short signal format?  Short
Short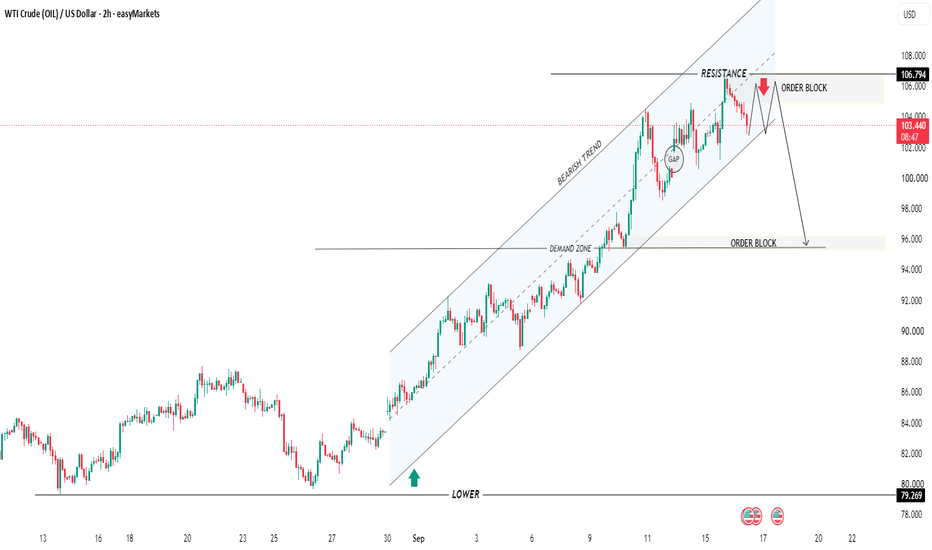
Short 
XAUUSD — WATCHING 4,344 FOR A SHORTGold is at 4,311 after the flush on the 16th. I'm waiting for price to come back up to me. Here's the plan.
THE STRUCTURE
Gold has not made a higher high in two weeks. Since the 4,510 peak on the 3rd,
every rally has been sold lower than the last. That descending line on my chart
connects those failures and sits around 4,344.
The band at 4,352–4,377 held gold up repeatedly from the 8th to the 13th. On the
16th it broke in one candle — 4,370 straight down to 4,240.
Broken support becomes resistance, and the reason is people, not magic. Everyone
who bought that shelf is underwater. The first return to their entry is their
chance to exit flat, and they take it. Their exits are my selling pressure.
THE TRADE
Stop 4,384 39.6 points risk
Entry 4,344
Target 4,230 114 points reward
Reward-to-risk: 2.88 : 1
My entry sits on the 78.6% retracement of the drop near the top of where this
bounce can reasonably reach. That's what lets the stop stay tight.
At 2.88R I only need to be right 25.8% of the time to break even. I can be wrong
three times out of four and lose nothing. That's the whole point of structuring
trades properly — you stop needing to predict and start needing discipline.
Price is only at the 55% mark right now. There's room for this to come to me.
WHY I LIKE IT
The zone is thick broken support, the trendline and the 78.6% level all stack
between 4,344 and 4,384. My stop sits above the whole structure.
The break was impulsive: one candle, 130 points. Forceful breaks tend to
continue. Lazy ones reverse.
And look at the shape down in one candle, up over a day and a half of choppy
overlapping bars. Impulsive down, corrective up. That tells you which move is
real.
WHAT WOULD MAKE ME WRONG
My two trendlines are converging, with the upper falling faster than the lower.
That shape is a falling wedge, and textbook falling wedges break UPWARD. I still
like the trade, but anyone calling this chart unambiguously bearish hasn't
looked closely.
My edge also has a clock on it. The trendline drops about 13 points a day. If
gold takes until Monday to reach 4,344, that line will be near 4,293 — meaning
my entry would sit ABOVE a broken trendline. Take it soon or trail it down.
If gold stalls at 4,320–4,325 and rolls over without filling me, I let it go.
Decide that before the moment arrives.
Good trading isn't being right. It's making wrong cheap and right pay properly.
This one needs a 26% hit rate to break even.
Not financial advice. Do your own work. Short 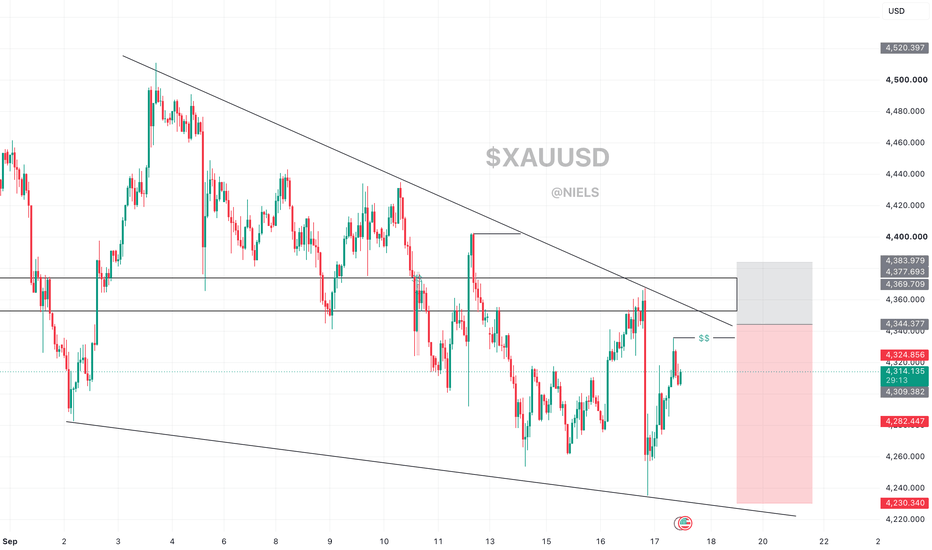
DeGRAM | XAUUSD is targeting 4,220 support📊 Technical Analysis
● XAUUSD remains inside a clear descending structure, with the upper falling channel line continuing to cap recovery attempts. The latest rebound is approaching the 4,355–4,375 resistance zone, where the descending trendline and horizontal resistance converge.
● If sellers defend this area, another bearish leg toward the 4,215–4,235 target zone becomes the main scenario. A sustained breakout above 4,375 would weaken the immediate bearish setup and open room for a stronger recovery.
💡 Fundamental Analysis
● Gold is rebounding today after the Fed raised rates by 25 bp to 3.75%–4.00% and signaled that further tightening may still be needed. A softer U.S. dollar and easing oil prices are supporting the recovery from the recent low, but the Fed’s hawkish stance and elevated rate expectations continue to limit gold’s upside.
✨ Summary
● Bearish structure remains dominant below 4,355–4,375; a rejection from resistance would favor another decline toward 4,215–4,235. A confirmed breakout above resistance would invalidate the immediate bearish scenario.
Share your opinion in the comments and support the idea with a like. Thanks for your support! Short 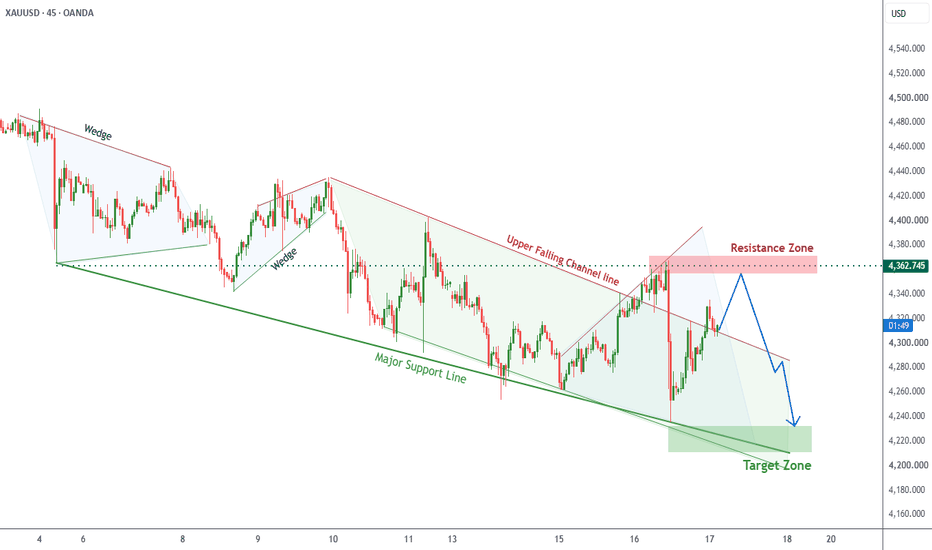
 Long
Long
Gold May Recover If It Holds Above 4,280📊 Market Overview:
XAU/USD is currently trading around 4,296 USD, after rebounding strongly from the 4,235 USD area in the previous session.
Gold is being supported by dip-buying and easing oil prices, while the market has already partially priced in the Fed’s 25-basis-point rate hike to 3.75%–4.00%. However, the Fed has signaled that further rate hikes could still occur in 2026; 16 out of 18 Fed officials expect at least one more hike, keeping the USD and U.S. Treasury yields as risks to gold’s recovery.
📉 Technical Analysis:
• Key Resistance:
- 4,310–4,320
- 4,335–4,350
• Nearest Support:
- 4,280–4,270
- 4,255–4,240
• EMA 09: Price is recovering toward the EMA09 after the sharp decline. If XAU/USD breaks above and holds above the EMA09 on the M15/M30 timeframes, short-term bullish momentum could strengthen. If price continues to be rejected below the EMA09, selling pressure could return.
• Candlestick Pattern / Volume / Momentum: After forming a low around 4,235, gold posted a strong rebound, indicating improving dip-buying demand. However, the 4,310–4,320 area remains a nearby resistance zone where profit-taking could emerge. Bullish momentum would be more reliable if an M15/M30 candle closes above 4,320 with improving volume. Conversely, a break below 4,270 would weaken the recovery structure.
📌 Outlook:
Gold may continue its short-term recovery if it holds 4,270–4,280 and breaks above 4,320. In that case, price could move toward 4,335–4,350.
On the other hand, if 4,270 is broken, XAU/USD could return to test 4,255–4,240. The Fed’s still-tight policy stance remains an important factor to watch.
💡 Suggested Trading Strategy:
🔻 SELL XAU/USD at: 4,315–4,320
🎯 TP: 40 / 80 / 200 / 300 pips
❌ SL: 4,325
🔺 BUY XAU/USD at: 4,270–4,275
🎯 TP: 40 / 80 / 200 / 300 pips
❌ SL: 4,265 Long 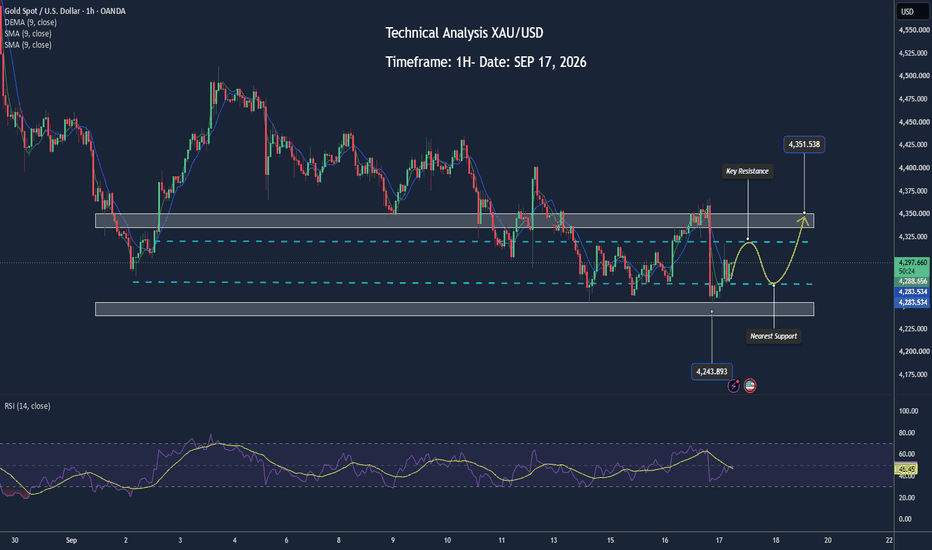
Short 
UPTREND: Uptrend identification 6 WAYS TO IDENTIFY A TRUE UPTREND
Structure, liquidity and displacement — a practical SMC framework for understanding bullish price action.
━━━━━━━━━━━━━━━━━━
INTRODUCTION
Most traders identify an uptrend by looking for:
• Higher Highs
• Higher Lows
• Moving averages
• Resistance breakouts
• Increasing volume
But Smart Money Concepts looks deeper.
Instead of asking:
“Is price going up?”
Ask:
“Why is price going up, where is the liquidity, and what confirms continuation?”
Here are 6 concepts I use to read a potential bullish environment.
━━━━━━━━━━━━━━━━━━
01 — MARKET STRUCTURE
HH + HL = THE FOUNDATION
A bullish market structure develops through:
• Higher Highs (HH)
• Higher Lows (HL)
• Protected swing lows
• Continuous structural progression
But there is an important distinction.
Not every HL is an immediate long opportunity.
Price can create inducement before reaching the real area of interest.
Structure gives the bias. Liquidity gives the context.
━━━━━━━━━━━━━━━━━━
02 — PREMIUM vs DISCOUNT
WHERE IS PRICE INSIDE THE DEALING RANGE?
Instead of blindly buying because price looks bullish, identify the current dealing range .
• Premium → Upper half
• Equilibrium → 50% midpoint
• Discount → Lower half
For deeper retracements, OTE (Optimal Trade Entry) can provide additional confluence.
But remember:
DISCOUNT ≠ AUTOMATIC BUY
Location tells you where to look.
Confirmation tells you when to act.
━━━━━━━━━━━━━━━━━━
03 — LIQUIDITY SWEEP → CHoCH / MSS
WATCH THE SEQUENCE
A bullish shift can develop through:
Liquidity → Sweep → Displacement → CHoCH/MSS
Look for:
• Sell-Side Liquidity being taken
• Strong bullish displacement
• CHoCH / MSS
• Follow-through above relevant structure
The sweep itself is not the confirmation.
The structural shift is what matters.
Don't buy the sweep. Read the shift.
━━━━━━━━━━━━━━━━━━
04 — LIQUIDITY SWEEP vs GENUINE BOS
NOT EVERY BREAKOUT IS CONTINUATION
Price can break above an obvious high, take Buy-Side Liquidity , and then reverse.
A more meaningful bullish BOS should ideally show:
• Strong displacement
• Break of relevant structure
• Acceptance beyond the level
• Retest / reaction
• Continuation
WICK THROUGH A LEVEL ≠ STRUCTURAL CONFIRMATION
Always analyse the context around the breakout.
Context matters.
━━━━━━━━━━━━━━━━━━
05 — DISPLACEMENT + FVG
FOLLOW THE EXPANSION
Strong price expansion can leave behind an imbalance known as a Fair Value Gap (FVG) .
Look for:
• Consolidation
• Bullish displacement
• FVG formation
• Increased market participation
• Continuation with structure
An FVG alone is not an entry signal.
Ask:
“What caused the displacement?”
The imbalance becomes more meaningful when it aligns with structure and liquidity.
━━━━━━━━━━━━━━━━━━
06 — HIGHER-TIMEFRAME STRUCTURE BIAS
START WITH THE BIGGER PICTURE
Before dropping to M1, M5 or M15, understand the higher-timeframe narrative.
Ask:
• Is HTF structure bullish?
• Are HHs and HLs forming?
• Where is external Liquidity ?
• Where are the major Order Blocks ?
• Are FVGs supporting the structure?
Moving averages can help visualize direction.
But they should support your analysis — not replace price structure.
PRICE STRUCTURE > INDICATOR DEPENDENCY
━━━━━━━━━━━━━━━━━━
THE CHAMP_OF_GOLD BULLISH CHECKLIST
Before considering a bullish setup:
✓ HTF bullish structure
✓ Liquidity identified
✓ Sweep / inducement understood
✓ CHoCH / MSS confirmation
✓ Bullish displacement
✓ Order Block / FVG confluence
✓ Logical dealing-range location
✓ Clear invalidation
No single concept creates the setup.
Confluence creates the narrative.
━━━━━━━━━━━━━━━━━━
THE COMPLETE SMC FLOW
LIQUIDITY
↓
SWEEP
↓
CHoCH / MSS
↓
DISPLACEMENT
↓
ORDER BLOCK / FVG
↓
CONTINUATION
Don't chase the move.
Understand the reason behind it.
━━━━━━━━━━━━━━━━━━
YOUR TURN 👇
Which confirmation do you pay the most attention to?
Liquidity Sweep • CHoCH/MSS • BOS • Order Block • FVG
Share your view in the comments.
If you enjoy this type of SMC education, follow Champ_of_Gold for more market-structure breakdowns and educational ideas.
Educational purposes only. This is not financial advice. Education 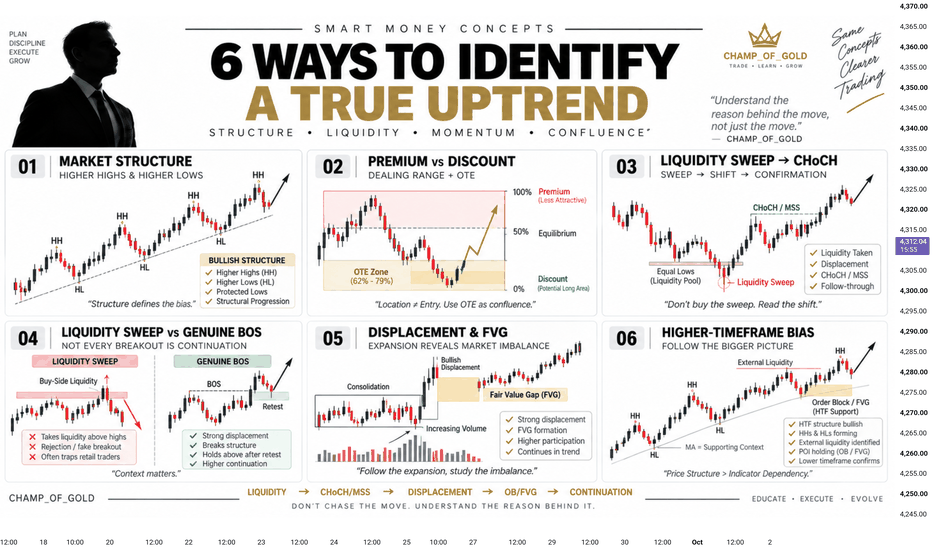
XAU/USD: THE $4,275 SUPPORT SWEEP & $4,415 EXPANSION! 🚀
Testing lower structure near 4,311.550! Are you panic-selling this pullback into horizontal demand, or locked in for the multi-wave dip-and-surge to overhead resistance? 🤔
Gold is executing a localized retracement back toward its primary horizontal Support line floor on this 1-hour OANDA chart. Spot gold is trading around 4,311.550, drifting down to test the verified $4,275.00 - $4,280.00 demand zone. Institutional buyers are stepping in along this horizontal boundary to absorb sell-side liquidity before initiating a powerful multi-wave expansion campaign back up toward the upper descending Resistance line. 📈💥
Look closely at the black blueprint trajectory mapping out the coming sessions. The algorithm projects a textbook multi-wave accumulation, retest, and expansion sequence:
• An initial localized flush pulling price down to test the horizontal Support line floor near $4,275.00 - $4,280.00 to sweep retail sell stops and fill institutional buy orders. 🧹
• An immediate high-velocity impulse rebound surging off support to push toward the $4,350.00 - $4,360.00 region. ⚡
• A healthy higher-low pullback dipping back toward $4,315.00 - $4,320.00 to confirm structural support and absorb remaining sell liquidity. 🌊
• Final acceleration surge driving straight up to target the primary overhead descending Resistance line ceiling near 4,410.000 - 4,420.000. 🎯🏹
Maintaining technical patience and aligning with trendline demand is your ultimate superpower in this setup. Trying to short directly into a verified horizontal support floor following a sharp decline is a fast track to getting caught in an aggressive mean-reversion squeeze. Smart money is waiting for this dip into $4,275 support to finalize before scaling into long position blocks alongside the expansion flow. 🧘♂️⚡
🛠 Trade Parameters:
🛒 Long Zone: 4,275.00 - 4,290.00 🛍️
🛑 Stop-Loss: 1h close below 4,250.00 ❌
💰 Take-Profit: 4,415.00 🎯
The retail bears attempting to short into horizontal support are about to get caught offside as institutional buy volume defends the floor. Stay focused, strictly manage your risk, and let the algorithm carry the trade up to our target.
Maintain your composure through the waves, and we will see you up at the 4,415 resistance target ceiling! 🚀💎 Long 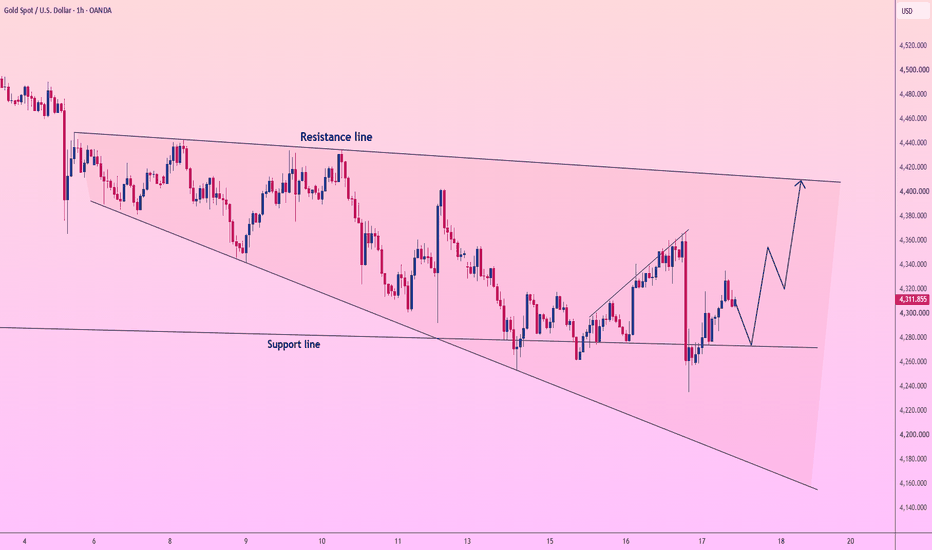
The Hierarchy of Order FlowEducational Topic: The Hierarchy of Order Flow
To trade successfully with Smart Money, you must understand that the market does not move randomly; it moves through a specific hierarchy of internal liquidity and structural shifts. Chasing every Fair Value Gap (FVG) will lead to failure if you do not understand where you are in the overall structure.
The standard institutional process follows these steps, visualized in the chart below:
Step 1: Institutional Impulse & Displacement
The process begins with a violent, one-way push in price that creates dramatic Displacement.
This move is characterized by large, energetic candles that invalidate previous structure (BOS) and leave behind clear Fair Value Gaps (FVGs) and unmitigated Order Blocks (OBs).
This is the "institutional footprint" where smart money entered their massive positions.
Step 2: Liquidity Engineering & Retracement
Smart Money cannot fill all of their orders at once. They must engineer liquidity (trap orders) in the opposite direction before the true move occurs.
Price begins a slow, corrective retracement against the displacement move. This retracement appears to be a new trend to retail traders, inducing them to buy (in a bearish setup) or sell (in a bullish setup).
During this phase, early retail buyers are trapped, and their Stop Losses accumulate below the Sell-Side Liquidity (SSL) or above the Buy-Side Liquidity (BSL) pools.
Step 3: Point of Interest (POI) Mitigation
The engineered retracement targets the primary Point of Interest (POI) from the initial displacement—the unmitigated FVG or the refined Order Block.
Smart Money allows price to re-enter this zone to fill their remaining orders. The visual clue is a sharp, clean mitigation of the zone (tapping the exact edge of an FVG), which instantly shifts market character (MSS) on a lower timeframe.
Step 4: Institutional Expansion & Liquidity Run
Once mitigated, the real move begins. Price expands aggressively from the POI, generating a new, stronger wave of order flow aligned with the macro displacement.
The first target is the Retail Inducement Liquidity (trapped orders) from Step 2, and the ultimate target is the large, unmitigated high or low (External BSL/SSL pool) beyond the entire structural complex.
Visualizing the Process
The chart below shows a textbook example of this process applied in a Bearish Institutional Order Flow setup. Note how each step—the initial displacement, the re-test/mitigation of the precise Fair Value Gap (FVG), the Market Structure Shift (MSS), and the final expansion to target liquidity—plays out logically.
(Refer to the accompanying screenshot for the clear visualization of these steps applied on a live Trading View chart.)
How to Use this Strategy
Identify the Higher Timeframe Displacement (BOS) to define your daily bias.
Refine your entry Point of Interest (POI) to the cleanest unmitigated FVG or Order Block inside that displacement.
Wait patiently for the Engineered Retracement to induce retail traders.
Set limit orders at the mitigation zone (the edge of the FVG) OR wait for Lower Timeframe Confirmation (MSS) inside the POI.
Target established Liquidity Pools (BSL/SSL) for high-R trades.
Disclaimer: This is educational content based on Smart Money Concepts (SMC) principles. Always apply rigorous risk management. Education 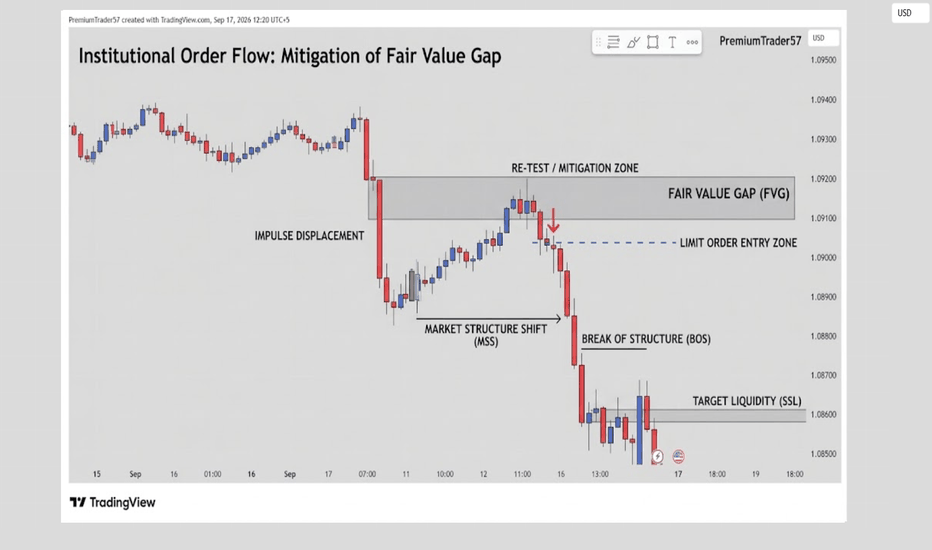
Long 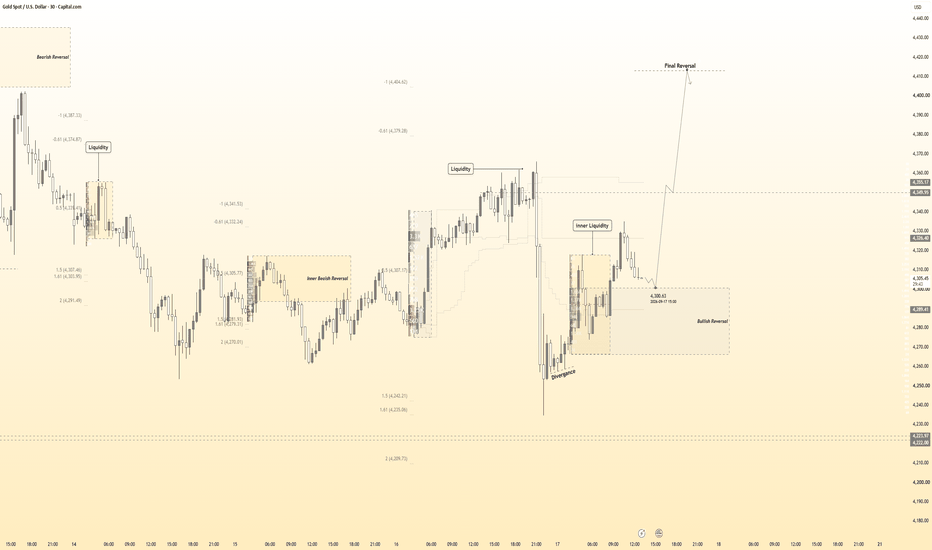
XAUUSD — 4,309 Break Opens 4,225 XAUUSD — 4,309 Break Opens 4,225
Gold is showing another weak recovery attempt, and this chart feels like sellers are still controlling the story.
After the sharp drop from the previous high, price moved inside a bearish structure with repeated lower reactions. Each bounce looked strong for a short moment, but none of them was able to hold cleanly above the previous supply area. That is usually a warning sign. When gold keeps reacting up but fails to build real continuation, the market is often preparing to take liquidity lower.
Right now, price is trading around 4,309 after another rejection from the upper 4,300 zone. The key point here is simple: buyers tried to recover, but the reaction lost momentum before breaking back into a bullish structure. With USD strength supported by the hawkish Fed tone, and gold closing below the important 50-day SMA area, the short-term pressure still leans bearish.
From an SMC view, the current move looks like a lower-high formation after a broken recovery channel. The market has already shown CHoCH signals, but they are not strong enough to confirm a full bullish reversal. Instead, price is now turning down again toward the next liquidity pocket.
My main view is bearish while gold stays below 4,325 - 4,350. If sellers keep pressure under this zone, the next downside target is 4,241 - 4,225. This is the area marked on the chart, and it may become the next reaction zone if price sweeps into discount.
For buyers to regain control, gold needs more than a small bounce. It needs a clean reclaim above 4,350, then a stronger hold above 4,375. Without that, every recovery still looks like a pullback for sellers to reload.
Key Price Zones to Watch
Current price area: 4,300 - 4,310
Short-term resistance: 4,325 - 4,350
Bullish recovery level: above 4,350 - 4,375
Main bearish pressure zone: below 4,325
First downside target: 4,260 - 4,250
Main target zone: 4,241 - 4,225
Invalidation for bearish view: clean reclaim and hold above 4,375
Do you think gold will sweep 4,225 first, or will buyers defend this area before the next big move?
Short 
Bearish Liquidity Sweep Setting Up Bullish Reversal Toward BSL?1. Overall Bias
The chart presents a Smart Money Concepts (SMC) / ICT-style technical analysis, outlining a full market cycle: consolidation → liquidity sweep → bearish expansion → reversal → retracement → renewed bullish setup targeting higher liquidity pools.
2. Element-by-Element Breakdown
A. Price Range (Aug 25–28)
Labeled "PRICE IN RANGE" — price consolidated in a tight horizontal box, indicating accumulation/distribution before a directional move.
A diagonal trendline inside this box shows minor internal structure (lower highs) hinting at seller pressure building before the breakdown.
B. MSS (Market Structure Shift) — Aug 28–29
As price broke below the range's low, it triggered a Market Structure Shift, confirming a change from ranging/bullish structure to a bearish directional bias.
This is the first technical confirmation that sellers had taken control.
C. First Fair Value Gap (FVG) — Post-MSS
Immediately after the MSS, an aggressive bearish candle created an imbalance (FVG) around the 4,480–4,520 zone (grey box).
This zone represents inefficient price delivery — a gap between buying and selling pressure — and is technically considered a potential resistance/rebalancing zone if price later revisits it.
D. Bearish Move (Fundamentally Driven)
The information box explicitly states this decline was triggered by FOMC fundamentals — implying a hawkish Fed outcome strengthened the USD, which inversely pressured Gold lower.
Price dropped sharply from ~4,520 down to ~4,300, marked clearly as "BEARISH MOVE."
E. Sell-Side Liquidity & Liquidity Sweep (Sep 1–2)
Price declined into a zone marked "SELL SIDE LIQUIDITY," where resting sell-stop orders (from range lows) were sitting.
The "LIQUIDITY SWEEP" label confirms price deliberately wicked below this level to grab liquidity (stop-hunt) before reversing — a hallmark SMC behavior where smart money engineers a move to fill large orders before reversing direction.
F. Second Fair Value Gap (FVG) — Recovery Leg
Following the sweep, an impulsive bullish leg formed a second FVG around 4,360–4,400.
This becomes a key support/Point of Interest (POI) zone, since price often retraces to fill such imbalances before continuing its intended direction.
G. Buy-Side Liquidity Sweep (Sep 3–4)
Price rallied aggressively into the "BUY SIDE LIQUIDITY" zone near 4,500–4,520, sweeping resting buy-stop orders above the prior swing highs.
This effectively completed a full liquidity cycle: sell-side sweep → bullish expansion → buy-side sweep.
H. Distribution / Bearish Retracement Channel (Sep 4–16)
After the liquidity grab, price entered a descending channel (marked by the diagonal trendline), retracing lower in a controlled, corrective structure.
This pullback is technically significant — it's retracing back into the FVGs/POIs created earlier, which is standard behavior for price to "rebalance" imbalanced zones before resuming its higher-timeframe direction.
I. Key POIs (Points of Interest) — Right Side of Chart
Three horizontal POI zones are marked as upside targets:
POI Approx. Level Significance
POI 1 ~4,520 Highest target, aligned with prior buy-side liquidity high
POI 2 ~4,480 Mid-range resistance/imbalance zone
POI 3 ~4,400 Nearest target, aligned with the FVG left during the bullish leg
These POIs represent untapped liquidity/imbalance zones above current price, forming the bullish thesis's technical targets.
J. Bullish Reversal (Sep 16–17, Current Price Action)
Price recently swept a fresh low (~4,240) and sharply reversed upward, labeled "BULLISH REVERSAL."
This is interpreted as another localized liquidity sweep, now acting as the launchpad for the anticipated move back toward the POIs.
Current price (4,308.50) is trading right at the edge of this reversal structure, suggesting the setup is actively developing, not yet confirmed.
K. Inset Chart (Bottom Left) — DXY (U.S. Dollar Index) Correlation
A smaller secondary chart, styled with candlesticks around the 99.90–100.30 range, appears to track the U.S. Dollar Index (DXY).
The upward-sloping arrow suggests an expected continuation or reversal in DXY that would inversely correlate with Gold's move — i.e., if DXY weakens from here, Gold gets fundamental tailwinds to reach the marked POIs.
This ties directly into the chart's core thesis (bottom text box): "The U.S. Dollar moved higher fundamentally due to FOMC data. Now, a downside move may occur. If USD weakens, Gold could move upward and target the key POIs."
3. Trade Thesis Summary
Catalyst: FOMC-driven USD strength caused Gold's initial bearish leg.
Liquidity Engineering: Price swept both sell-side and buy-side liquidity in sequence — a classic smart-money footprint.
Current Phase: Retracement/distribution phase is complete or nearing completion, with a fresh bullish reversal signal at the recent low.
Forward Expectation: Contingent on USD weakness, Gold is technically positioned to reclaim liquidity toward POI 3 → POI 2 → POI 1 (4,400 → 4,480 → 4,520+).
Invalidation Risk: If the USD continues strengthening or the bullish reversal fails to hold above recent lows (~4,240), the bearish channel could resume, delaying or invalidating the bullish POI targets. Long 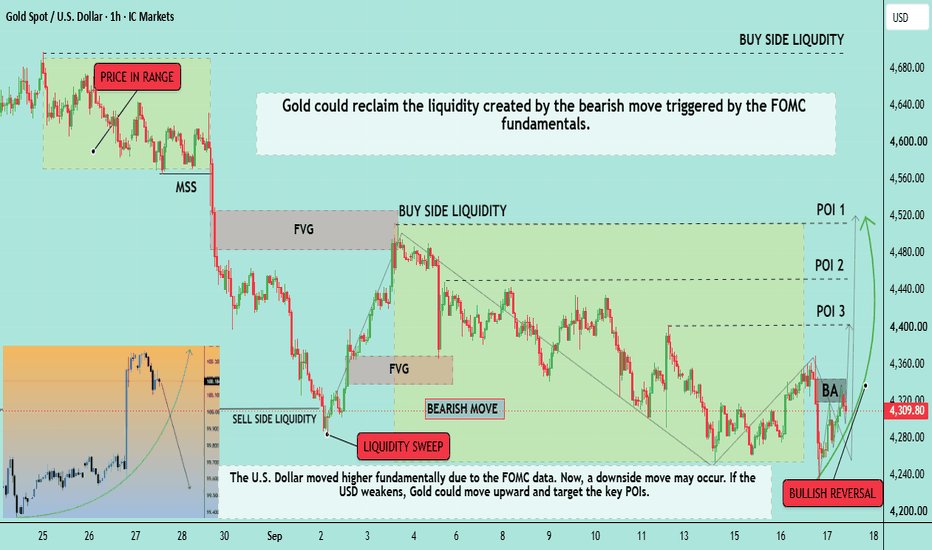
XAUUSD | TRADING PLAN H1 17/09/2026✅XAUUSD/H1
Gold is recovering strongly from the Major Support zone (4253 - 4263), forming an upward move and breaking the short-term bearish structure. However, price is currently approaching the Supply Zone (4335 - 4348), while a Strong Resistance zone at 436x is also located above. Therefore, it is necessary to wait for clear price reactions at the key levels before setting up a trade.
🔴Key Levels
Strong Resistance: (4361 - 4367)
Supply Zone: (4335 - 4348)
Support: (4300 - 4302) + FIBO 0.5
Major Support: (4253 - 4263)
🔴Bearish Scenario:
Price is currently correcting and approaching the Support zone (4300 - 4302) + FIBO 0.5. If price rejects the breakout and buying pressure returns, a continuation Buy setup can be considered, targeting the Supply Zone (4335 - 4348).
If price rebounds to the Supply Zone (4335 - 4348) and shows rejection, sellers may return and a continuation Sell setup can be considered toward the Support (4300 - 4302), and further down toward the Major Support (4253 - 4263).
If price breaks out and the H1 candle confirms a close below the Support zone (4300 - 4302) + FIBO + EMA34 (H1), a continuation Sell setup can be considered toward 428x - Major Support (4253 - 4263).
🟢Bullish Scenario:
If price breaks out strongly and holds above the Supply Zone (4335 - 4348), bullish momentum may continue toward the Strong Resistance (4361 - 4367). Short 
GOLD H1: 4261 Target Hit — Is 4300 Now the Key to the Next Move?Yesterday’s bearish scenario played out as expected.
The key 4317 level failed, followed by a decline through 4289 and 4276 into the 4261 target area. Price briefly swept below 4261 before producing a strong recovery.
Today, however, that recovery is facing its first important test.
Gold rebounded from the 4260 area and reached approximately 4327, where it was rejected near the 0.705 retracement zone. Price is now back around 4308, with PDM 4300 acting as the immediate decision level.
The H1 picture is mixed: the short-term recovery structure remains intact, but momentum is weakening and the current candle bias has turned bearish.
Key levels today:
Above 4300, price can attempt another recovery toward 4327 → 4338 → 4351, with 4366 PDH remaining the major upside level.
A confirmed H1 break below 4300 would weaken the recovery and expose 4276 → 4261 again.
If 4261 fails, the next important sell-side liquidity sits around 4243–4235. The extended bearish target remains near 4216.
For now, 4300 is the decision level. Holding above it keeps the rebound alive; losing it puts yesterday’s lows back into focus.
With U.S. data ahead, confirmation is more important than anticipating the first move.
Probability over prediction.
Gold's Correction Isn't Over — Dot Plot Not Yet Fully Priced InGold's Correction Isn't Over — The Market Hasn't Fully Absorbed the Dot Plot
Fundamental Analysis
1. Gold is currently facing pressure on several fronts, driven primarily by expectations that policy rates are entering an upside cycle. This pushes US Treasury yields higher, which weighs on non-yielding assets such as gold — particularly given that real yields remain firmly positive.
2. The hawkish Fed stance has also strengthened the US dollar, adding further pressure on gold. And it is not the Fed alone: central banks across major economies are tightening in unison.
3. Underlying all of this is the oil variable, which has turned negative for gold in the near term. Attacks on oil supply infrastructure have deepened the output shortage, keeping inflation elevated and forcing central banks to maintain a restrictive stance — which in turn feeds back into pressure on gold.
4. The market has yet to fully absorb the dot plot. Guidance pointing to another one or two hikes this year is still very recent, and institutional investors are likely to adjust positioning gradually over the next two to three weeks.
5. With oil prices showing no clear sign of reversing, investors should stay alert to hawkish surprises from central banks, the Fed included.
Technical Analysis
6. XAUUSD has declined steadily, closing the day below the EMA200 and successfully breaking below the last swing low around 4,280. This lower low confirms the downtrend, and the close beneath the long-term EMA200 signals potential for further downside.
7. A close below the 61.8% Fibonacci retracement around 4,230 could open the way toward support at the 78.6% retracement near 4,100.
8. Alternatively, holding above 4,230 may keep price moving sideways.
9. Confirmation of a return to an uptrend would likely require a close above 4,500.
10. The near-term bias therefore remains to the downside, with price likely to alternate between rallies and pullbacks, forming lower swings in a corrective wave structure.
Analysis by: Krisada Yoonaisil, Financial Markets Strategist at Exness
Short 
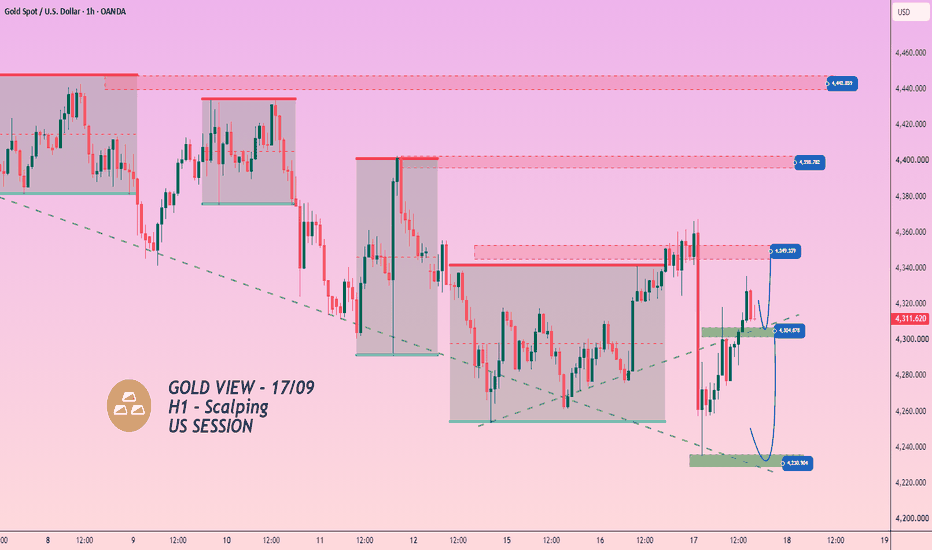
GOLD SCALPING US SESSION — 4300 HOLDS, BUYERS STRIKE BACKGold has recovered strongly from the 4,232 support area and is now holding above the 4,300 zone. Although price just experienced a sharp rejection from 4,348–4,360, the short-term structure is still showing a recovery with buyers defending higher levels.
For the US session, Emma's focus is on buying the confirmed pullback, not chasing the rebound. The key is whether 4,300–4,305 continues to hold as intraday support.
📌 MAIN SCENARIO
The primary area to watch is 4,300–4,317. If Gold pulls back into this zone and shows a bullish reaction, the preferred setup is to Buy the pullback, targeting 4,348 first.
A successful break and hold above 4,348 can open the way toward 4,398. If 4,300 fails decisively, the bullish setup is invalidated and attention should shift back toward the lower support around 4,232.
🔑 KEY LEVELS
🔴 4,442 — Major resistance / extended target
🔴 4,398 — Key resistance
🔴 4,348–4,350 — Immediate resistance / first target
🟢 4,300–4,317 — Main pullback & buy zone
🟢 4,232 — Major support / bullish invalidation area
🎯 PREFERRED SCENARIO
Gold remains supported above the 4,300 area.
Wait for a pullback toward 4,300–4,317.
Look for bullish rejection/confirmation before entering.
First upside target: 4,348.
If 4,348 breaks and holds → next target 4,398.
Avoid chasing Buy after a strong impulse; wait for the retracement.
A decisive break below 4,300 weakens the bullish setup.
🟢 BIAS
BULLISH — BUY THE CONFIRMED PULLBACK.
For the US session, the setup is simple: 4,300 is the key — hold it, look for the Buy; lose it, step aside. Long