Long
Long
Long 
Gold Reclaiming Support — Upside Structure in FocusGold is showing a constructive structure on the 45-minute chart. Price has reacted from the lower support area and is now trading around the 4,346 region.
The highlighted 4,325–4,350 zone is the key area to watch. Holding this zone could keep the bullish structure active, with the next major resistance area near 4,430–4,450.
Key levels:
Entry / Reaction Zone: 4,325–4,350
Target: 4,493
Risk level / invalidation: Below 4,297
Intermediate resistance: 4,430–4,450
The setup is based on support reaction, market structure, and the projected path shown on the chart. A sustained move below the marked risk level would weaken this scenario. Long 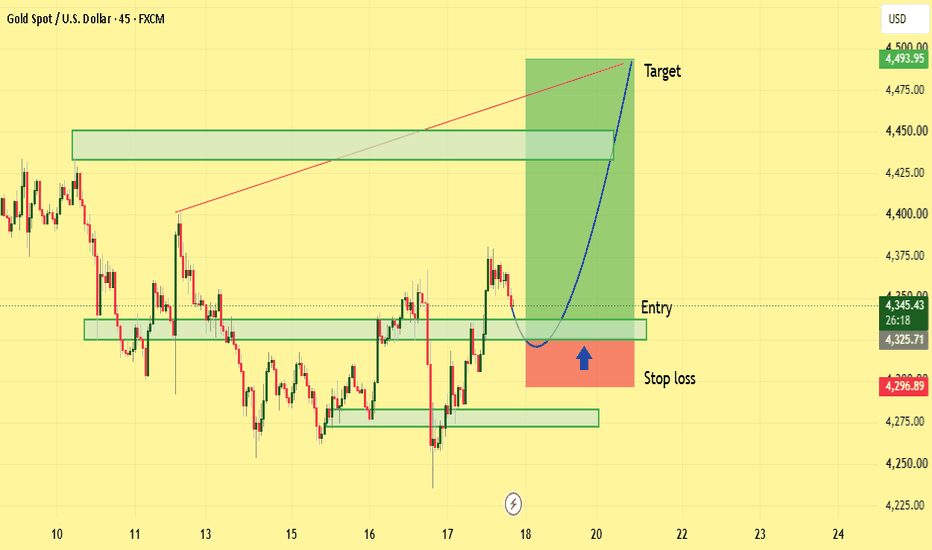
BRIAN XAUUSD – GOLD HOLDS POC BEFORE FED DECISIONBRIAN XAUUSD – GOLD HOLDS POC BEFORE FED DECISION
Gold is trading cautiously below 4,350 as the market moves into the Fed decision window.
The current price action is not clean enough to chase aggressively. Buyers have managed to recover from the recent low, but gold is still struggling below the short-term sell zone around 4,353 and the larger Composite VAH resistance near 4,390 - 4,400.
The macro background is mixed. A softer US dollar gives gold some short-term support, but the strong move in US Treasury yields continues to limit bullish momentum. With the Fed expected to raise rates by 25 bps, traders are now focused on the updated economic projections, the dot plot, and comments from Fed Chair Kevin Warsh.
This is why gold is moving carefully around value. The market is waiting for confirmation, not just direction.
Technical structure
On the 45-minute chart, gold is holding above the POC / HVN Value Support around 4,320 - 4,330.
This is the most important intraday support zone. Price has already reacted from this area and is now attempting to build a recovery structure. As long as buyers defend this zone, gold still has room to test higher resistance.
The first short-term resistance is around 4,353 - 4,365. This area is marked as the sell zone and sits near the current rejection line. If gold reaches this zone and fails to break cleanly, sellers may step back in and push price down toward 4,320 again.
Above that, the Composite VAH / Major Resistance around 4,390 - 4,400 is the main upside barrier. A clean break and acceptance above this zone would be the first sign that buyers are taking back stronger control.
If the POC / HVN support fails, the downside levels are clear: 4,292 as the first target, 4,275 as secondary support, and 4,262 as the major downside target.
Important zones
Current price area: 4,340 - 4,350
Gold is holding above short-term value but still below resistance.
POC / HVN Value Support: 4,320 - 4,330
Main buyer defense zone for the current structure.
Sell zone: 4,353 - 4,365
First resistance and seller reaction area.
Composite VAH / Major Resistance: 4,390 - 4,400
Major upside resistance before any stronger bullish continuation.
VAL first downside target: 4,292
First downside target if price loses value support.
LVN secondary support: 4,275
Next support if bearish pressure expands.
Major downside target: 4,262
Deeper downside target if Fed volatility strengthens the US dollar.
Trading scenario
Priority view: buy reaction only if 4,320 - 4,330 holds
Entry:
Look for buy positions only if gold holds the POC / HVN Value Support around 4,320 - 4,330 and shows clear bullish rejection.
Stop Loss:
Below the local sweep low or below the 4,320 support zone.
Take Profit:
TP1: 4,353 - 4,365
TP2: 4,390 - 4,400
TP3: Trail higher only if gold breaks and accepts above the Composite VAH resistance
This setup follows the current value-support reaction. However, confirmation is very important because the Fed decision can create fast and aggressive volatility.
Alternative sell scenario
If gold rejects from 4,353 - 4,365 and fails to reclaim that zone, sellers may regain short-term control.
Entry:
Look for sell positions only if price rejects clearly from the sell zone or breaks below 4,320 and retests it as resistance.
Stop Loss:
Above the rejection high or above the reclaimed resistance zone.
Take Profit:
TP1: 4,292
TP2: 4,275
TP3: 4,262 if downside momentum continues after the Fed decision
Final view
Gold is sitting in a decision area before the Fed announcement.
The short-term structure is trying to recover, but it is not fully bullish yet. Buyers need to defend 4,320 - 4,330 and break above 4,353 to open the way toward 4,390 - 4,400. Until that happens, every move higher can still face seller pressure.
For me, the map is simple:
Hold 4,320 - 4,330 = buyers still have a chance.
Break 4,353 = recovery momentum improves.
Reach 4,390 - 4,400 = major resistance test.
Lose 4,320 = downside opens toward 4,292 and 4,275.
Lose 4,275 = 4,262 becomes the next major target.
Gold is not a chase market right now. It is a confirmation market.
Will buyers defend the POC before the Fed decision, or will sellers use the event to force one more move into lower value?
Long 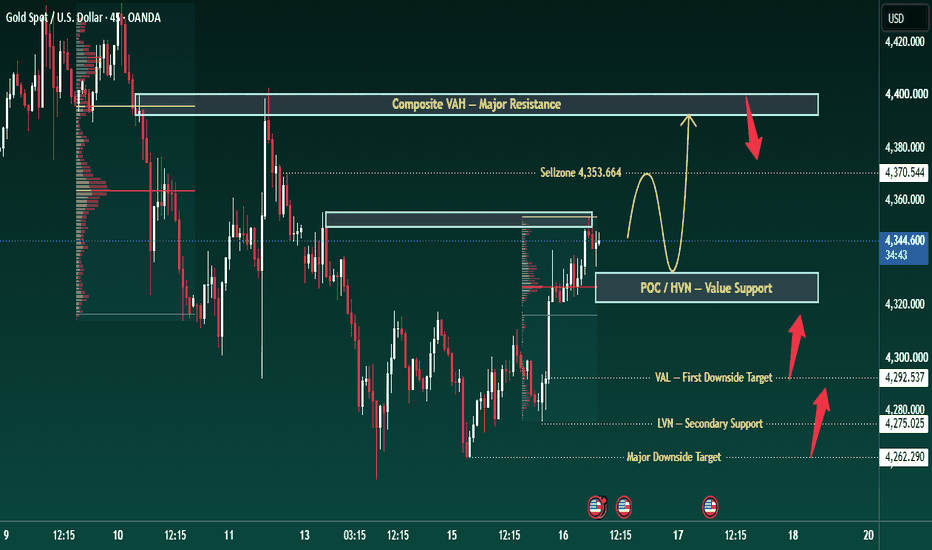
 Long
Long
Short 
 Short
Short
Long 
Short 
Liquidity mastered NAS EXAMPLE LET’S BREAK THE CHART DOWN
Here we mark a HTF weekly high not just a random high. This is a high where liquidity has been built.
The low underneath it has also left liquidity above it.
This now becomes our HTF target.
So let's look at what is actually happening.
This is the weekly timeframe, and we can see seven consecutive weeks of selling pressure. A large, impulsive move like this naturally attracts more sellers especially continuation traders looking to ride the existing momentum.
But we need to look beyond simply seeing seven weeks of selling.
We need to understand the narrative behind the sell off.
If we look to the left, we can see all of the untapped lows the market had built over the course of weeks and months.
These lows represent liquidity.
Then we get the large sell off that clears through that liquidity.
But let's pay particularly close attention to this section of the chart.
This was the origin of the move.
The market took liquidity, formed a bottom and then aggressively expanded to new highs.
That move left behind an order block.
Now look at how price behaves when it eventually returns to that area.
We aren't going to take an entry simply because price has reached the order block.
Instead, let's drop down to the 4H timeframe and see what price action is actually telling us.
4H FOLLOWING THE NARRATIVE
After tapping into the HTF order block, price makes an aggressive move to the upside.
It then pulls back into the extreme, finds momentum and continues higher.
Price subsequently taps into a bearish imbalance, pulls back into a bullish imbalance and then continues higher again.
Now let's identify where the liquidity sits on this timeframe and establish where our potential targets and entries should be.
We can clearly identify our buy side liquidity.
But how do we know this is liquidity?
When price tapped into the bearish imbalance, the high it created respected the previous high.
That means liquidity has now been left above that high.
So we allow price to develop.
We want to see price move into the buy side liquidity and bearish order block.
As price plays inside this area, we start to see engineered liquidity develop.
Buyers are becoming trapped inside a range.
Even though higher highs and higher lows are still being respected, we have to understand what is happening underneath the surface.
This creates our sellside liquidity.
Now let's drop down another timeframe.
1H MAKING THE LIQUIDITY CLEARER
On the 1H timeframe, the structure becomes much clearer.
We have a bullish imbalance.
Then the next low gives us a clear liquidity block.
Liquidity was already swept before price turned bullish.
Therefore, there is no reason for us to blindly target that low.
Especially when we already have a higher timeframe reason for price to move toward the EQHs on the weekly timeframe.
So now our analysis is starting to come together.
We have:
• A build up of buyers.
• A reason for price to push higher into HTF equal highs.
• Clearly identified liquidity.
• A liquidity block below price.
• A HTF target.
Therefore, we only want to look for buys after the relevant liquidity has been cleared.
We can place our entry around the liquidity level, with the stop loss underneath the last low.
Our first target is the first area of buy side liquidity.
But ultimately, our target remains the HTF liquidity.
THE ENTRY
Here we finally take out the sell side liquidity, tagging our entry.
This is important because the liquidity event creates the conditions we were waiting for.
Sellers are induced into the move while buyers are trapped during the sharp sell-off.
Once that liquidity is taken, price reacts quickly and takes out the first buy side liquidity.
This is where we begin managing the trade.
Stops can now be moved to break even, and a partial can be taken.
At this point, there is no longer full initial risk on the position.
WHAT HAPPENS NEXT?
Now that we have taken out the low, let's move back to the 1H timeframe and see what is happening.
When buyers initially took out the highs, they created a new high.
This induces more buyers into the market.
But these buyers can become trapped.
Why?
Look at the low.
We can see a clear liquidity sweep where buyers stepped back into the market.
However, buyers are failing to continue pushing higher and create new highs.
Why?
Because the relevant buy side liquidity has not yet been taken.
This creates an environment where sellers can continue selling the upper zones and order blocks, trapping buyers who are entering late.
As a buyer, this is exactly what we want to see.
As we move lower, we identify another level where price has clearly shown liquidity being taken followed by bullish expansion.
This gives us another potential continuation level, with the stop loss underneath it.
Now we have both things we need:
Liquidity identified.
Buyers trapped.
We can therefore place a limit order around this level, with the stop loss underneath the area where liquidity was previously taken.
The target remains our HTF liquidity.
And again, price taps into our level.
Once again, the 1H timeframe shows us that price has taken out the previous high and cleared the buy-side liquidity.
So again, this is where we manage the trade.
Move the stop to break even and/or take another partial.
THE BIGGER PICTURE
This entire setup is not about randomly finding an order block and placing an entry.
The order block is only one piece of the puzzle.
We started from the weekly timeframe and identified where the important HTF liquidity was sitting.
Then we followed the narrative down through the timeframes:
HTF liquidity → HTF order block → 4H structure → engineered liquidity → 1H liquidity → liquidity sweep → bullish expansion → entry → first liquidity target → trade management → continuation.
This is why its best to say don't just look at a level understand why the level matters.
Liquidity gives us the reason.
Price action gives us the confirmation.
Structure gives us the context.
And our entry is simply the execution of the narrative we've already built.
We're not trying to predict every move.
We're identifying where liquidity is likely sitting, waiting for price to interact with it, and then allowing price action to show us whether our idea is actually playing out.
 Education
 Long
Long
Long 
Short 
Short 
Short 
Long 
Long 
Trading Is Like Chess | Plan the Move, Manage the RiskTrading is much more than simply trying to predict whether price will move higher or lower
Every market decision is part of a larger process, and just like in chess, one move can influence the possibilities available for the next move
The market does not always move according to our expectations
A setup can look technically strong and still fail because market conditions can change, volatility can increase, or price can invalidate the original idea
That is why a professional approach should focus not only on potential opportunity, but also on preparation, patience, risk control, and the ability to accept an incorrect analysis without allowing one decision to affect the next one
The idea behind this chart is simple but important
We cannot undo a previous move, but we can make the next one better
In trading, this means that a losing position should not automatically lead to emotional decisions or attempts to recover losses immediately
Instead, each new setup should be evaluated independently using fresh market information and a clearly defined plan
Before considering any market position, it can be useful to observe the overall structure, price action, momentum, important support and resistance levels, and the reaction of price around key zones
Waiting for clearer confirmation can help reduce impulsive decisions and prevent entering simply because the market is moving quickly
Risk management should remain an essential part of the process
Position size should be appropriate for the account and the level of risk being accepted
A defined invalidation level can help establish when the original market idea is no longer valid, while proper risk control can help prevent one unsuccessful trade from having an unnecessarily large impact on the account
Another important part of trading is patience
Not every market condition provides a high quality opportunity
Sometimes the most disciplined decision is simply to wait until price action becomes clearer
There is no requirement to participate in every movement, and avoiding an unclear setup can be part of a structured trading plan
Emotional control is equally important
Fear, greed, frustration, and the desire to recover a previous loss can influence decision making and cause traders to abandon their original risk plan
A consistent process helps keep attention focused on the current market structure instead of allowing the result of a previous trade to control the next decision
Trading should therefore be approached as a continuous learning process
A loss does not automatically mean that the entire process was wrong, just as a profitable trade does not automatically mean that every decision was correct
Reviewing previous decisions, understanding what happened in the market, and improving the process can help develop greater discipline over time
The chess comparison represents this mindset well
A good chess player does not focus only on the immediate move
They consider the position, possible reactions, potential risks, and what options may remain afterward
Trading can require a similar approach
Plan the move
Manage the risk
Wait for confirmation
Respect the invalidation
Learn from the previous decision
And approach the next opportunity with a clear mind
The objective is not to predict every market movement
The objective is to build a disciplined process where risk is understood before a decision is made and where every new setup is evaluated on its own merits
You cannot change the previous move
But you can make the next move with better preparation
This chart and description are shared strictly for educational and informational purposes
They do not constitute financial, investment, or trading advice
Markets involve substantial risk, and losses are possible
Every trader should conduct their own research, understand the risks involved, and make independent decisions according to their individual circumstances and risk tolerance Education 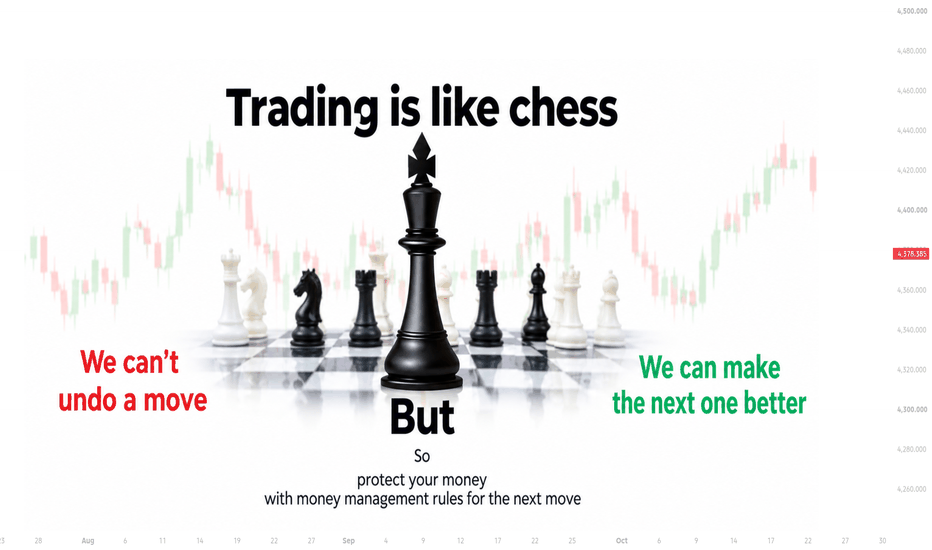
Long
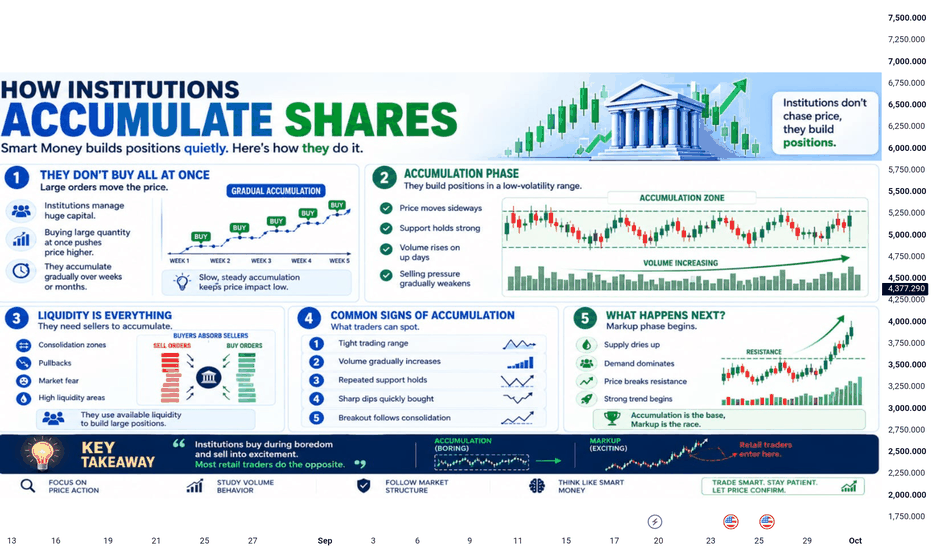
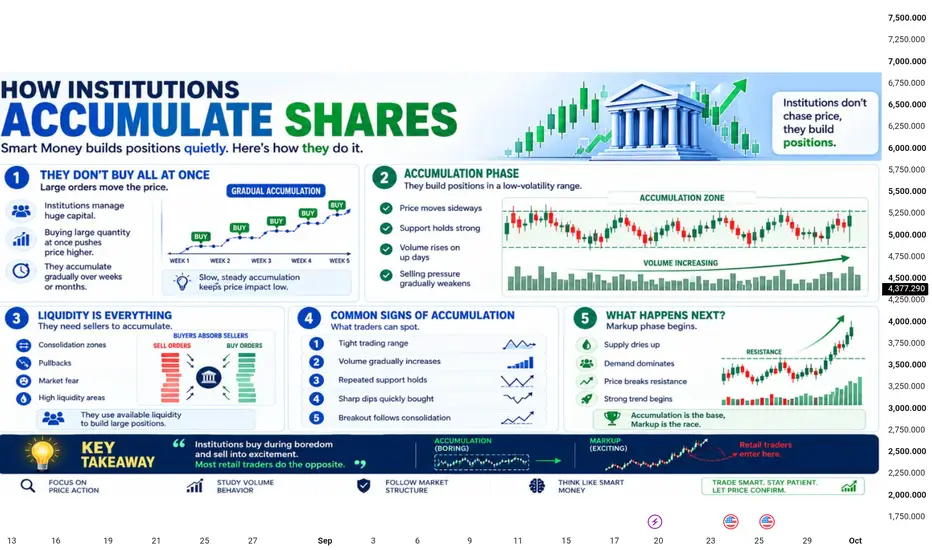
How Institutions Accumulate Shares | Educational Market StructurInstitutional accumulation is often discussed as a gradual process rather than a single large entry into the market
Large participants may need to manage significant order sizes, so their activity can sometimes appear through periods of consolidation, repeated reactions from support, changing volume behavior, and gradual shifts in market structure
The first stage shown in the chart is gradual accumulation where price may remain within a relatively controlled range while buying and selling activity continues
During an accumulation phase, traders can observe whether price continues to respect important support levels, whether downside reactions become weaker, and whether trading activity changes as the range develops
Another important concept is liquidity
Large market participants require sufficient opposing orders to execute larger positions, which is one reason why consolidation zones, pullbacks, and periods of increased market participation can be important areas to study
The chart also highlights several conditions that traders may monitor, including a tight trading range, increasing volume, repeated support reactions, quick recoveries from sharp declines, and a potential breakout following consolidation
However, none of these conditions should be treated as confirmation on their own
A breakout can fail, volume can increase during both buying and selling activity, and apparent accumulation can later develop into another period of consolidation or a bearish structure
For educational analysis, the most useful approach is to study price action, market structure, support and resistance, volume behavior, and confirmation together rather than relying on a single indicator or pattern
If price eventually establishes above a well-defined resistance level and maintains that structure, the market may enter a stronger directional phase
On the other hand, if support fails and price begins forming lower highs and lower lows, the accumulation interpretation becomes weaker
This chart is intended to explain market behavior and institutional-style accumulation concepts for educational purposes only
No setup should be considered guaranteed, and market conditions can change quickly
Always wait for clear price confirmation before making any trading decision and apply appropriate risk management according to your own risk tolerance
Educational analysis only — not financial or investment advice Education