XAU/USD: Market Analysis and Strategy for September 17Looking ahead at the gold price outlook for the next 15 days, market focus will shift to a series of economic data releases on Thursday: initial jobless claims, the Philadelphia Fed Manufacturing Index, and housing starts. If the U.S. economy continues to demonstrate resilience, the market will likely anticipate a continuation of the Federal Reserve's tightening policy; consequently, U.S. Treasury yields and the U.S. dollar are expected to remain elevated, continuing to exert downward pressure on gold and silver prices.
Following the Federal Reserve's interest rate decision, gold prices plummeted, hitting an intraday low of 4235 before staging a rapid rebound. This recovery reflects strong buying interest at lower levels, characteristic of a corrective bounce following an oversold condition. On the four-hour chart, the price retraced from 4368 to 4235, ultimately closing at 4263. During today's Asian trading session, the primary focus will be on the strength of the rebound; the intraday trading strategy favors selling into rallies.
My recommendations:
SELL: Near 4330
SELL: Near 4345  Short
Short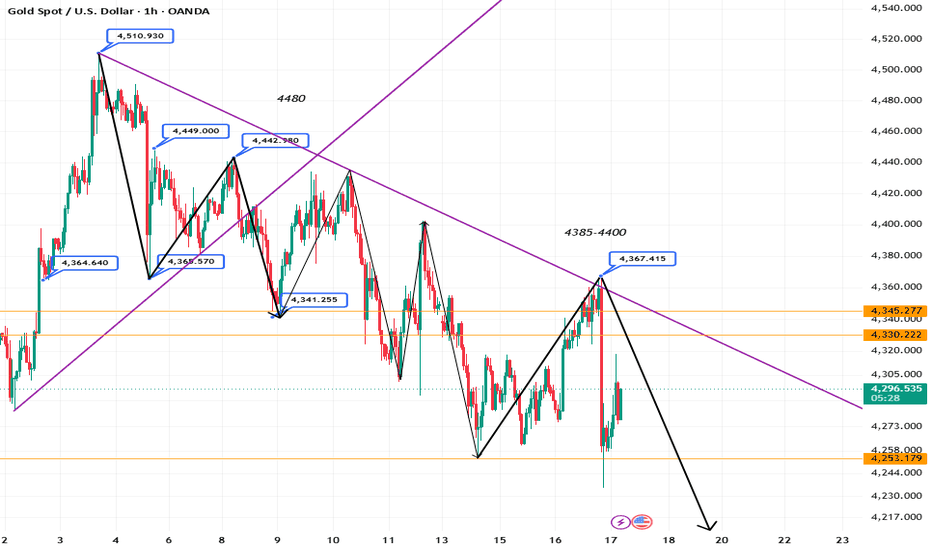
Gold Forecast: Bullish Recovery from Trend Line ContinuesHello traders! Here’s my technical outlook based on the current XAUUSD (3H) chart structure. XAUUSD previously traded inside a descending structure before breaking higher with a strong impulse and shifting bullish. Price then formed a range, tested the 4,440 Seller Zone, and pulled back before bouncing from the Buyer Zone and ascending Trend Line. Currently, XAUUSD is trading below the 4,440 Seller Zone while holding above the 4,300 Buyer Zone and the ascending Trend Line. The recent bounce from support suggests buyers are defending this area and preparing for another move higher. As long as XAUUSD remains above the 4,300 Buyer Zone and respects the ascending Trend Line, the bullish scenario remains valid. A continuation higher could push price toward the 4,440 Seller Zone (TP1). However, a breakdown and close below the Buyer Zone would weaken the bullish outlook and increase the possibility of further downside. Please share this idea with your friends and click "Boost" 🚀 Long 
XAUUSD Key Level & Detailed Analysis## MARKET STRUCTURE
Gold is trading around **$4,317–$4,328**, rebounding from the **$4,235–$4,266** demand zone after the FOMC selloff. The recovery remains corrective, with price still below the **$4,368** CHOCH level and last week’s **$4,430** high. The broader structure remains neutral-to-bearish.
## KEY LEVELS
**Support:** $4,235 / $4,266
**FVG:** $4,271–$4,310
**Resistance:** $4,335 / $4,368 / $4,400
**Buy Zone:** $4,235–$4,266
**Sell Zone:** $4,335–$4,368
A daily close above **$4,368** would signal a meaningful structure shift, while a break below **$4,235** would reopen downside risk.
## DXY & YIELDS
DXY is holding around **100.15–100.32**, with resistance near **100.34–101.00**. US 10Y yields remain close to **5%**, keeping pressure on gold. A stronger dollar and elevated yields can continue to limit upside unless yields begin to ease.
## FED & MACRO
The Fed delivered a **25bp hike to 3.75%–4.00%**. The dot plot remains hawkish, with **16 of 18 officials seeing another hike in 2026**. Markets are now focused on whether another hike, potentially in October, becomes further priced in.
Today’s key catalysts are **US Jobless Claims, Philly Fed, and housing data**, followed by the **BOJ decision later this week**.
## GEOPOLITICAL & GOLD DEMAND
Geopolitical uncertainty and elevated oil prices continue to provide some safe-haven support, but the inflation impact of higher oil prices can also reinforce the Fed’s hawkish stance. Meanwhile, reported Chinese gold demand provides a medium-term physical-demand tailwind.
## TRADE BIAS
**Neutral-to-bearish below $4,368.**
Below **$4,335–$4,368**, rallies remain vulnerable to selling. A sustained reclaim of **$4,368** would weaken the bearish structure and open the path toward **$4,400+**.
**Key Support:** $4,235–$4,266
**Key Resistance:** $4,335–$4,368
**Major Invalidation:** Daily close below $4,235 or above $4,368
## CONCLUSION
Gold is attempting to recover after the FOMC selloff, but the broader structure remains **neutral-to-bearish below $4,368**. Strong DXY and elevated US yields continue to limit upside, while geopolitical risk and physical demand provide some support.
A sustained break above **$4,368** could shift momentum toward **$4,400**, while failure below **$4,335** keeps the downside structure active toward **$4,266–$4,235**.
**KEY LEVEL TO WATCH: $4,368 — STRUCTURE SHIFT**
*Not financial advice. Manage risk carefully.*
XAUUSD – COMPRESSED 4,289–4,347, AWAITING NEWSYour chart matches line for line: compression band 4,290–4,310, TURN H1 at 4,350 and 4,420, TURN H4 4,240 , green arrow to 4,420 and red arrow down to ~4,190. Live price 4,318.83 , session range 4,275–4,367 .
Macro worth noting: FOMC hiked 25bp to 3.75–4.00% overnight and signalled more to come. DXY reclaimed 100.27–100.31 , US10Y closed at 5.004% – a 19-year high. Yet gold still hasn't collapsed despite every headline being negative – meaning structural demand is holding underneath. Gold ETFs drew $17.1bn in August ($27.7bn YTD), central banks bought 289 tonnes in Q2 (+62% YoY).
Today at 12:30 GMT+0 : Philly Fed forecast 31.3 (prior 47.4, the highest since April 2021), Jobless Claims forecast 207K (prior 206K). Both lean mildly softer – if both print soft together, that opens a window for gold to bounce.
Why price moves as you projected : price gets pushed to retest the band floor 4,288 to sweep early-long liquidity, then structural demand lifts it to 4,347/4,350 – the exact launch pad of both arrows on your chart. Post-news: breaking 4,347 opens 4,420 → 4,483 → pullback 4,402 ; losing 4,289 points to 4,240 → ~4,190 → 4,168 . Note 4,168 sits below the 4,232 – 4,220 – 4,213 supports, so it's a final liquidity-sweep zone, not hard support.
Advice: 4,289–4,347 is a compression zone, not an entry zone . Wait for an M1/M5 Pinbar or CHoCH before clicking, and place SL outside the turn zone. Small size pre-news; don't enter in the first 5–15 minutes after the release . Move SL to breakeven at TP1. If you're not a pro, stay out and wait 30 minutes. USD just reclaimed 100 and yields are at a 19-year high – gold's upside is "climbing uphill", so don't all-in on the green arrow.
🛡️ LEO - WAR ROOM – sharing trading insights and supporting you in gold trading. A space to exchange perspectives, learn chart reading and capital management, and commit to the long haul while becoming more disciplined every day. Long 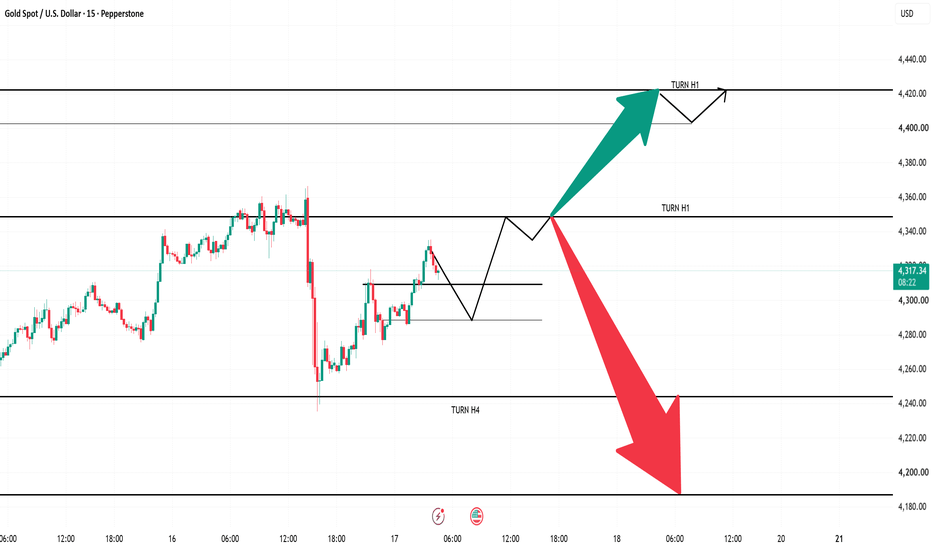
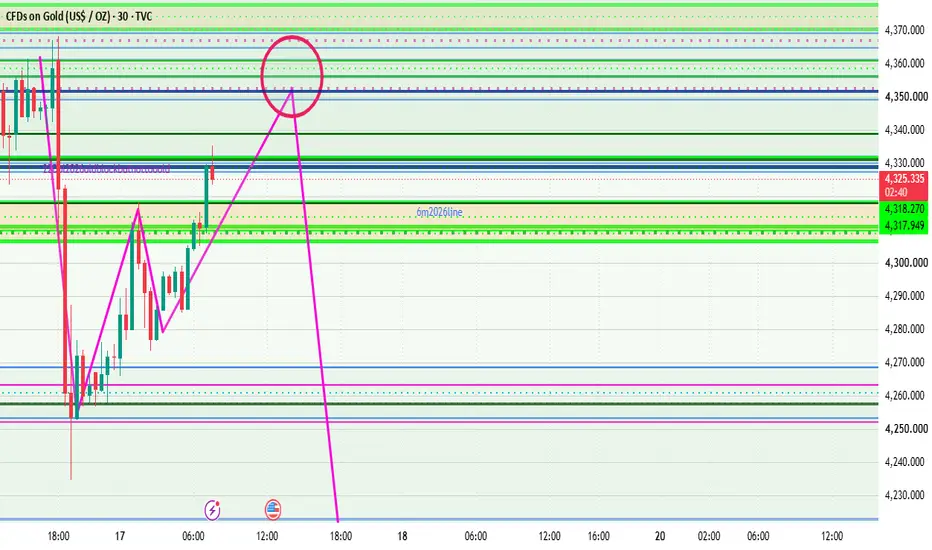
XAUUSD | 15M Timeframe | QB (Quantity Box) MethodMarkets don't move randomly — they move in repeating structural blocks. Every strong impulsive move originates from a specific price range where a large quantity of orders (institutional supply or demand) was absorbed before price expanded away. This origin range is the Quantity Box (QB).
The theory behind QB is simple: when price returns to revisit a zone that shares the same structural characteristics as a previous QB (similar range size, similar consolidation behavior, similar location relative to a liquidity sweep), it tends to react the same way the original box did — because the same type of order flow (quantity) is likely sitting there again.
How a QB Forms
Consolidation/Base – Price ranges sideways for a period, building a box of roughly equal highs and lows. This represents accumulation or distribution — a quantity of resting orders.
Liquidity Sweep (L-Sweep) – Before the real move, price often wicks below (or above) the box to grab stop-loss liquidity and trap late sellers/buyers. This sweep is a key confirmation that the box is "loaded."
Expansion – Price then explodes away from the box in the opposite direction of the sweep, leaving the QB as the origin of the impulsive leg.
Repetition – On the retracement leg, price often returns to a new zone with the same structural DNA (same box-size ratio, similar sweep-then-reversal pattern) as the original QB. This is where the pattern is expected to repeat.
Applying It to the Chart
On the left, the gray zones mark the original supply/demand structure where price consolidated before the sharp drop and subsequent rally.
After the drop, price built a base (rounded accumulation curve) and expanded upward through a repeating series of smaller QBs, each one launching the next leg higher.
Price is now approaching a new gray zone near the recent high, marked with a red circle — a level that structurally mirrors the earlier supply zone on the left.
Since this QB sits at a supply-type location after an extended rally, a bearish reaction is anticipated here, provided a bearish confirmation pattern prints at the zone (hence the "Need Bearish Pattern Here" note).
Key Rules for Identifying a Valid QB
Look for a clear range/box with defined highs and lows (not random noise).
A liquidity sweep beyond the box boosts validity — it shows stops were cleared before reversal.
Compare the box's proportions (height relative to the preceding move) to prior boxes on the same chart — structural repetition, not just visual similarity, is the key.
Wait for a confirmation candle/pattern (engulfing, pin bar, break of internal structure) inside or at the edge of the new QB before treating it as active — the box alone isn't an entry signal, it's a zone of interest. Short 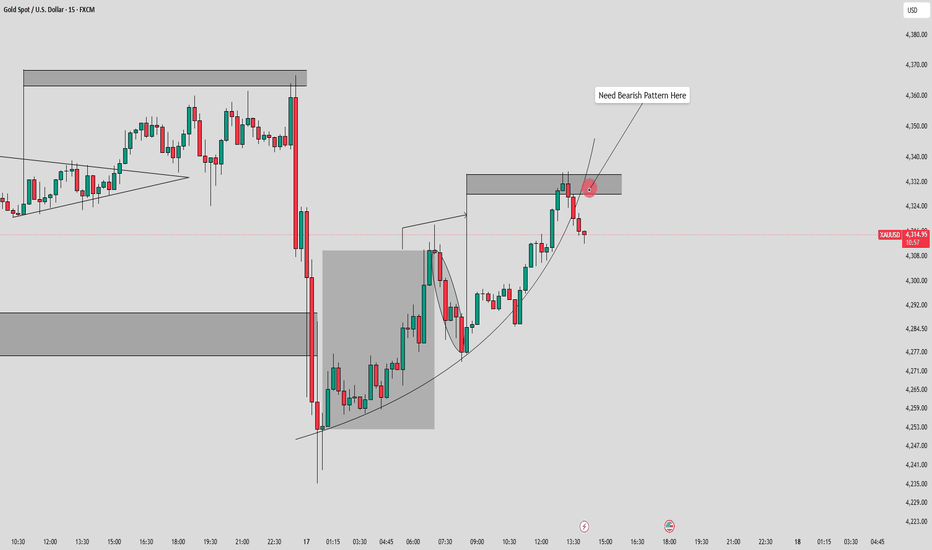
Short 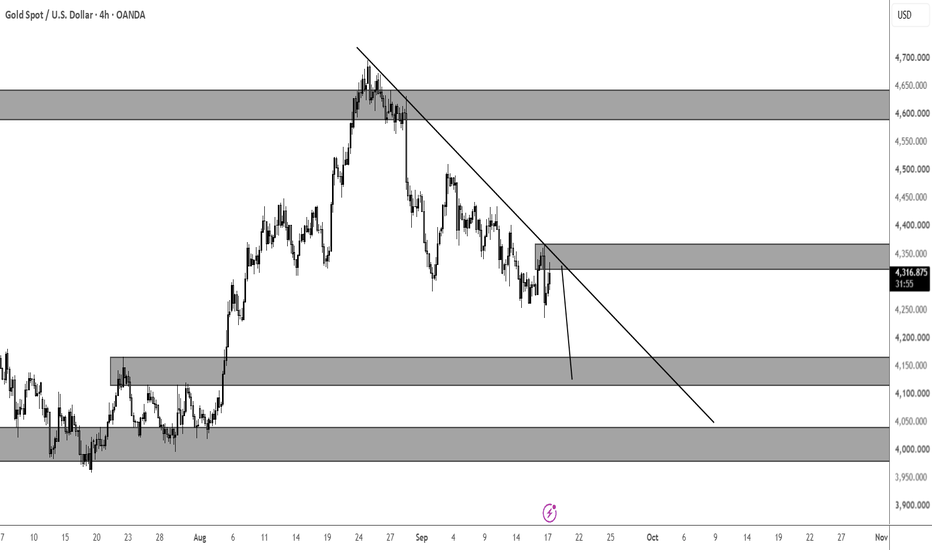
 Short
Short
Gold H4: 4,250 Sweep or 4,100 Next?
FOMC is over. Now the real liquidity test begins.
Gold remains trapped inside a broader H4 bearish structure after rejecting from the 4,680 area and continuing to print lower highs beneath the descending trendline.
But after the post-FOMC volatility, price is now reacting directly above a major H4 demand zone.
📊 H4 Market Structure
Current: 4,283.100
Trendline Resistance: 4,340–4,360
H4 Demand / SSL: 4,235–4,250
Lower H4 Demand: 4,095–4,120
The structure remains bearish below the descending trendline.
But selling directly into 4,235–4,250 offers poor structural confirmation.
🔴 Bearish Scenario
If H4 closes below 4,235–4,250 with displacement:
4,250 → 4,200 → 4,120–4,095
That would confirm continuation of the broader bearish structure.
🟢 Reversal Scenario
If Gold sweeps 4,235–4,250 and quickly reclaims 4,300 with a lower-timeframe MSS:
4,250 → 4,300 → 4,340–4,360
A sustained H4 reclaim above the descending trendline would weaken the current bearish structure.
🌍 Post-FOMC Context
The Fed raised rates by 25 bps to 3.75%–4.00%, while its projections kept further tightening risk on the table.
Gold initially sold off toward the 4,240 area, then recovered as markets digested the decision and oil's rally lost momentum.
The next move may depend less on the headline rate decision and more on which liquidity pool gets taken first.
Does 4,250 become the post-FOMC floor — or the next breakdown trigger? Short 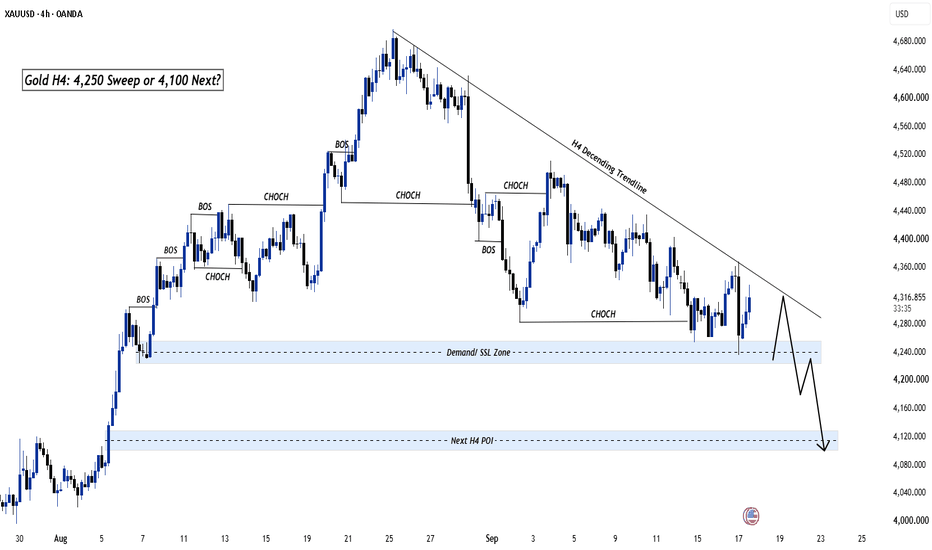
Gold: Buyers Face a Key Test After the CorrectionGold has experienced a significant retracement from the 4,690+ region after failing to sustain the previous upside move.
Price has now returned toward the 4,285–4,320 support area, where recent price action has shown signs of buying interest.
The first major resistance sits around 4,360–4,400, with 4,430–4,470 forming the next important area above.
A sustained recovery through 4,400 would begin to improve the short-term structure, while a break below current support could bring 4,220–4,260 into focus.
The 4H structure remains corrective, so confirmation around the current support and resistance boundaries remains important. We would like to see whether buyers can reclaim the first resistance area or whether sellers continue to pressure the lower support structure.
Key Levels
Support: 4,285–4,320
Major Support: 4,220–4,260
Resistance: 4,360–4,400
Major Resistance: 4,430–4,470
This Article is for informational and educational purposes only and does not constitute investment advice. It does not consider the financial situation, needs, or objectives of any specific individual. Any reference to past performance is not a reliable indicator of future results.
Risk Warning: 68% of retail investor accounts lose money when trading CFDs with this provider. You should consider whether you can afford to take the high risk of losing your money. Please refer to our full risk disclaimer on our website. Gold Under Pressure — Sellers Remain in ControlXAUUSD is currently showing a clear short-term BEARISH bias , as both the post-Fed macro backdrop and the H1 technical structure remain unsupportive of a sustainable recovery.
From a fundamental perspective , gold remains under pressure after the Fed raised interest rates by 25 basis points and left the door open for further tightening if inflation does not cool sufficiently. U.S. Treasury yields remain elevated, while the dollar continues to receive support following the decision. This high-rate environment remains unfavorable for gold , making short-term rebounds vulnerable to renewed selling pressure.
On the H1 timeframe, the bearish structure remains clearly intact . XAUUSD continues to trade below the descending trendline drawn from previous highs, while the latest rally reached the trendline area before being quickly rejected. Price is also trading around the Ichimoku structure, suggesting that buyers have yet to produce a breakout strong enough to change the current market structure.
The 4,335–4,345 area remains a key resistance zone . As long as XAUUSD stays below this region and the descending trendline remains intact, rebounds are likely to attract sellers. If bearish pressure returns, the 4,235–4,250 area becomes the next important downside target.
Overall, XAUUSD currently looks like a technical recovery within a broader bearish structure . I continue to favor SELL setups on rebounds into resistance with price-action confirmation , rather than trying to catch the bottom before buyers have clearly regained control. Short 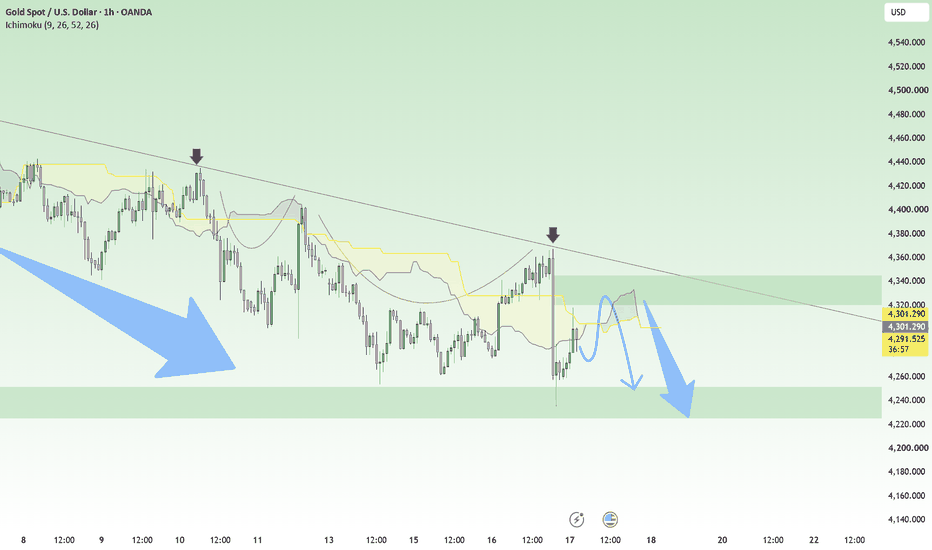
XAGUSD: The Next Big Move Could Be DOWNSilver has bounced from the support area and is attempting to push higher. However, I still don't see this move as the return of a bullish trend . On the H4 chart, XAGUSD remains below the descending trendline connecting the recent highs, while previous recovery attempts have repeatedly stalled as price approached the supply zone above.
That makes the 64.45–65.30 area an important zone that could determine the next move. If price pushes deeper into this region while buying momentum begins to fade, the risk of another rejection will increase. The Ichimoku structure also adds another layer of resistance overhead, meaning buyers will need more than a short-term bounce to genuinely shift the market structure.
At the moment, the macro and technical pictures are broadly aligned . Following the Fed's hawkish signal, a stronger USD and elevated Treasury yields continue to create an unfavorable environment for precious metals. This does not prevent silver from producing temporary rebounds, but it could make it difficult for buyers to sustain upside momentum once price reaches resistance.
For that reason, my primary scenario remains bearish continuation : allow price to recover toward resistance, watch how it reacts, and only favor SELL opportunities if a clear rejection develops. If that scenario plays out, 62.17 is the next area I expect XAGUSD to retest.  Short
Short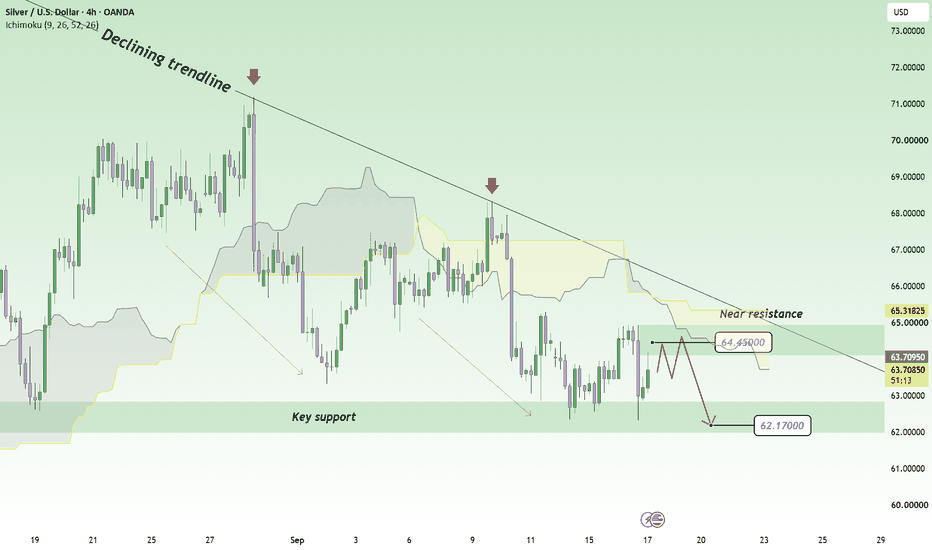
Long 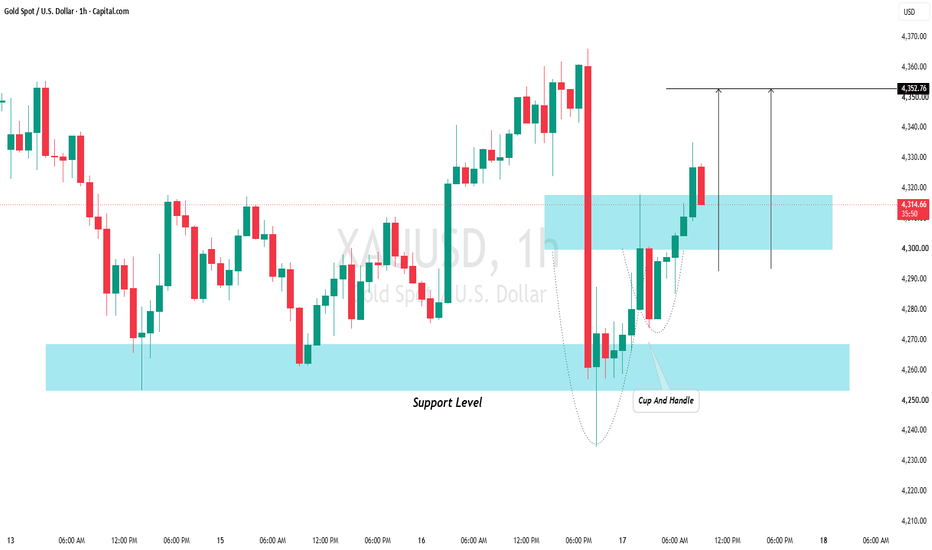
XAUUSD Technical Analysis — Bearish Structure📊 XAUUSD Technical Analysis — Bearish Structure
Current price: ~4,301
🔴 Trend: Price remains below the descending bearish trendline, keeping the short-term structure bearish.
🟢 Key support: 4,240–4,260 is the major structural support zone and bullish trendline area.
⚖️ Decision area: 4,280–4,320. A sustained break from this zone could determine the next move.
📉 Resistance: 4,400–4,450 is the important resistance/supply zone.
🎯 Upside target: A confirmed bullish breakout above the bearish trendline and 4,450 could open the path toward 4,520+.
🔻 Bearish scenario: Rejection from the trendline/resistance followed by a break below 4,240 would strengthen the bearish continuation setup. Long 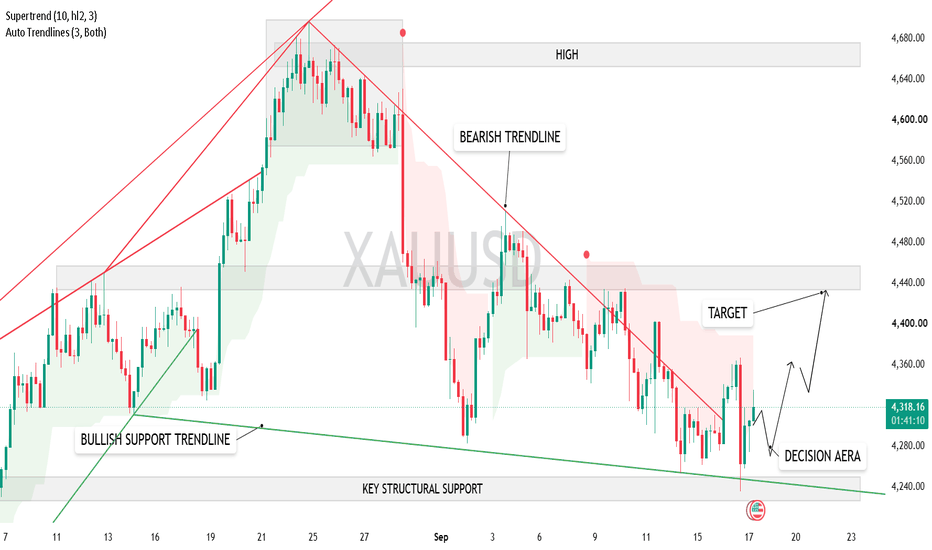
FOMC Sweep Recovery Likely Fake-Out; Deeper Sell-Side Liquidity.
Combining the 4H and 5-minute charts gives a clearer picture of the current market narrative. On the 4H chart, gold rallied from the early-August low into the "Buy Side Liquidity" zone near 4,680–4,720, then reversed sharply from the "Strong FVG" / HTF trendline resistance zone around 4,480–4,600. Price declined through a defined HTF trendline channel, breaking below the "Order Block" and into the "FVG" + "Sell Side Liquidity" pool near 4,240–4,300 — the same demand zone respected back in early August. This decline is exactly where the 5-minute chart picks up the story.
On the 5-minute chart, the sharp drop labeled "FED LIQUIDITY FOMC" shows the immediate bearish reaction to the FOMC event — price fell fast from the "Premium Zone" into the "Discount Zone," sweeping the marked "Sell Side Liquidity" level near 4,230–4,240. This is the same liquidity pool highlighted on the 4H chart, confirming that the FOMC-driven selloff was essentially a liquidity grab into an already-anticipated demand zone.
After that sweep, price is shown recovering — forming higher lows and higher highs back up toward the "Buy Side Liquidity" line near 4,360–4,370, drawn with a green bullish arrow projecting continued upside. This matches the 4H chart's "FED LIQUIDITY INJECT" arrow, which also projects a bullish move back up toward the 4,480–4,600 supply zone.
However, per your view, this recovery leg is being read as a corrective bounce, not the final reversal — meaning after this short-term bullish push toward 4,360–4,370 (buy-side liquidity on the 5-min chart), price is expected to roll over again and push lower to fully retest and sweep the sell-side liquidity near 4,230–4,240 (or potentially lower, toward the 4H "FVG"/"Order Block" zone) before any sustainable reversal happens. This aligns with typical ICT/SMC logic: a liquidity sweep often gets partially recovered (inducement) before price returns to take out remaining liquidity below, especially when the higher timeframe (4H) structure is still technically bearish/ranging until a clear break of structure occurs above the HTF trendline resistance.
Key takeaway: The current bullish bounce is likely a retracement/inducement move within a larger bearish-to-neutral structure. The higher-probability path, per this analysis, is one more leg down to fully clear the sell-side liquidity pool near 4,230–4,240 before a genuine bullish reversal targets the 4,480–4,720 supply/buy-side liquidity zone. Short 
Short 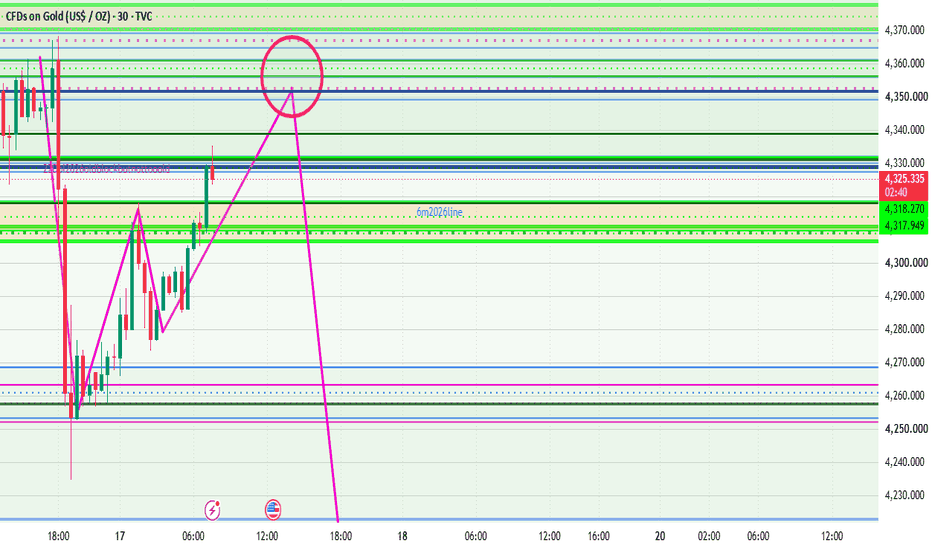
 Short
Short
XAUUSD 1H: Supply Zone Rejection & Trendline Resistance SetupMarket Overview
Gold (XAUUSD) on the 1-hour timeframe has completed a corrective pull-back into a strong higher-timeframe bearish structure. Price broke down sharply from an earlier consolidation range, establishing a clear Break of Structure (BOS) to the downside.
Technical Breakdown
Break of Structure (BOS): Price aggressively impulsed downward from the prior consolidation block, shifting medium-term momentum bearish.
Liquidity Sweep & Trendline Resistance: The recent upward retracement swept liquidity above recent short-term highs and tested a descending trendline originating from the previous consolidation high.
Supply Zone Tap: Price expanded directly into the marked Supply Zone (4,330 - 4,360), reacting sharply with selling pressure.
CHoCH (Change of Character): Prior minor higher highs shifted momentum back down, signaling lower-timeframe distribution within the supply block.
Trade Plan
Bias: Bearish / Short
Entry Zone: 4,330 – 4,345 (Supply Zone Re-test)
Stop Loss (SL): 4,365 (Above Supply Zone & Liquidity Highs)
Take Profit (TP): 4,280 (Target Level / Support Low). Short 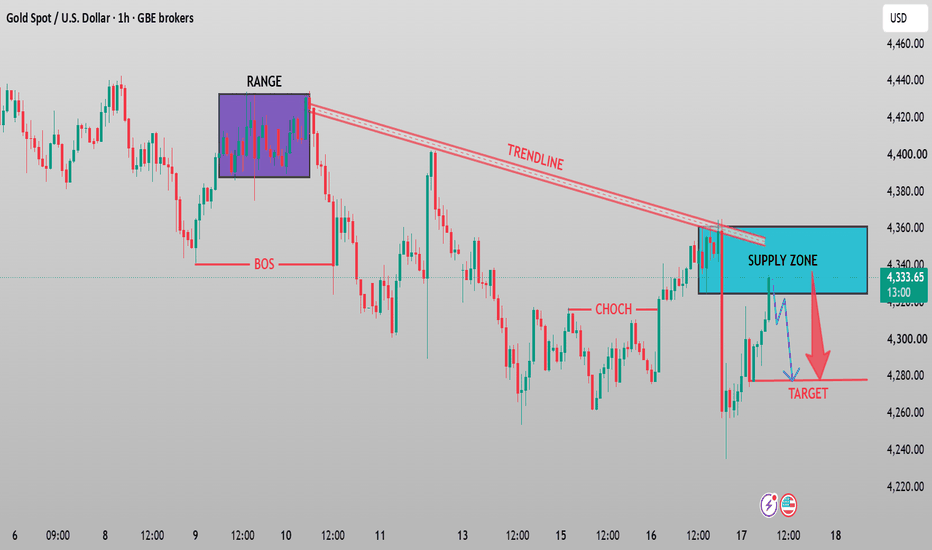
XAU/USD 17 September 2026 Intraday AnalysisH4 Analysis:
-> Swing: Bullish.
-> Internal: Bearish.
Bias and analysis to remain the same as analysis dated 30 June 2026.
Price did not print bullish CHoCH to indicate bullish pullback phase initiation. Price instead printed a new low followed by a bullish CHoCH
Price is currently trading within and established internal range, however, I will continue to monitor price with respect to depth of pullback.
Intraday expectation:
Price to trade up to either premium of internal 50% EQ, or H4 demand zone before targeting weak internal low, currently priced at 3,942.100.
Note:
Gold remains volatile as tensions between the US, Israel, and Iran keep safe‑haven demand elevated.
Markets are reacting quickly to every headline, while uncertainty around the Fed’s easing path and shifting U.S. policy under President Trump, especially tariffs continues to fuel choppy price action.
For newer traders, the key is simple, stay flexible and manage risk carefully, as fast spikes and sudden reversals are a normal part of the current XAU/USD environment.
H4 Chart:
M15 Analysis:
-> Swing: Bearish.
-> Internal: Bearish.
Price has printed according to analysis dated 14 September 2026 whereby I mentioned price to target weak internal low priced at 4,282.625. However, I am not entirely convinced at the nature of the iBOS as the break was minimal and was caused by last night's FED interest rate decision.
We are also seeing a drastic reduction in the depth of the internal range.
Price is currently trading within an internal low and fractal high. CHoCH positioning is the same as the fractal high.
Intraday expectation:
Price to trade up to either premium of internal 50% EQ, or M15 demand zone before targeting weak internal low, currently priced at 4,235.165.
Alternative Scenario:
Due to the narrowing of the internal range, price could potentially strong internal high and print a bullish iBOS.
Note:
Gold remains highly reactive on M15 as geopolitical risk continues to drive quick, headline‑led moves.
The tension between the US, Israel, and Iran is keeping safe‑haven demand elevated, with markets still sensitive to any sign of escalation.
At the same time, shifting US tariff policy under President Trump is adding extra uncertainty, fuelling sharp intraday swings and increasing the likelihood of sudden sentiment flips. Liquidity pockets and whipsaws remain common, making disciplined risk management essential.
Gold’s geopolitical premium is still firmly in place, and until tensions ease, short‑term volatility is likely to stay front‑loaded.
M15 Chart: GOLD (XAUUSD) H1 — Intraday Chart For 17 Sep 26Gold (XAUUSD) is showing a short-term bullish recovery from the 4,260–4,258 support zone, after a sharp downside move. On the H1 chart, price has recovered back toward the 4,318–4,355 resistance area, while the RSI is recovering and the chart shows a bullish RSI divergence.
🔴 Key Resistance Levels
4,318.12 — Immediate resistance / structure level
4,355.83 — Important intraday resistance
4,390–4,401 — Major SBR Structure Shifting Zone
4,448.99 — Strong resistance
4,510.19 — Higher SBR Structure Shifting Zone
A clean H1 breakout above 4,355.83 could open the way toward 4,390–4,401. If Gold breaks and holds above 4,401, the next important upside area is 4,448–4,450.
🟢 Key Support Levels
4,318 — Immediate support if reclaimed
4,282.35 — Important intraday level
4,258.66 — Major support
4,227.71 — Major RBS Structure Shifting Zone
The 4,258–4,228 zone remains the major downside protection area. A break below 4,227 would weaken the current recovery structure.
📈 Bullish Intraday Scenario
Price has recovered strongly from the 4,258 support after the sharp Fed-related selloff. The H1 structure now shows a potential recovery toward the upper resistance zones.
If Gold sustains above 4,318 and breaks 4,355.83, the next targets are:
4,355 → 4,390–4,401 → 4,449
A confirmed H1 breakout above 4,401 would be a stronger bullish structure shift.
📉 Bearish Intraday Scenario
The broader H1 structure remains under pressure while price trades below the 4,390–4,401 SBR zone.
A rejection from 4,355–4,401 could bring sellers back toward:
4,318 → 4,282 → 4,258
If 4,258 fails, the next major area is 4,228 RBS.
📊 RSI & Market Structure
RSI is currently around 57, recovering from the sharp drop toward the oversold region. The chart's RSI bullish divergence indicates that downside momentum has weakened and supports the current recovery.
However, RSI above 50 alone does not confirm a full bullish reversal. The key confirmation remains the price reaction around 4,355–4,401.
🔎 Intraday Outlook
H1 Bias: Short-term bullish recovery within a broader bearish structure.
Resistance: 4,355 → 4,401 → 4,449
Support: 4,318 → 4,282 → 4,259 → 4,228
The major fundamental backdrop remains the recent FOMC rate hike. Gold initially sold off sharply after the Fed decision, reaching roughly $4,235, before recovering back above $4,300.
Key level to watch: 4,355.83. A breakout can extend the intraday recovery, while rejection keeps the H1 bearish structure active.
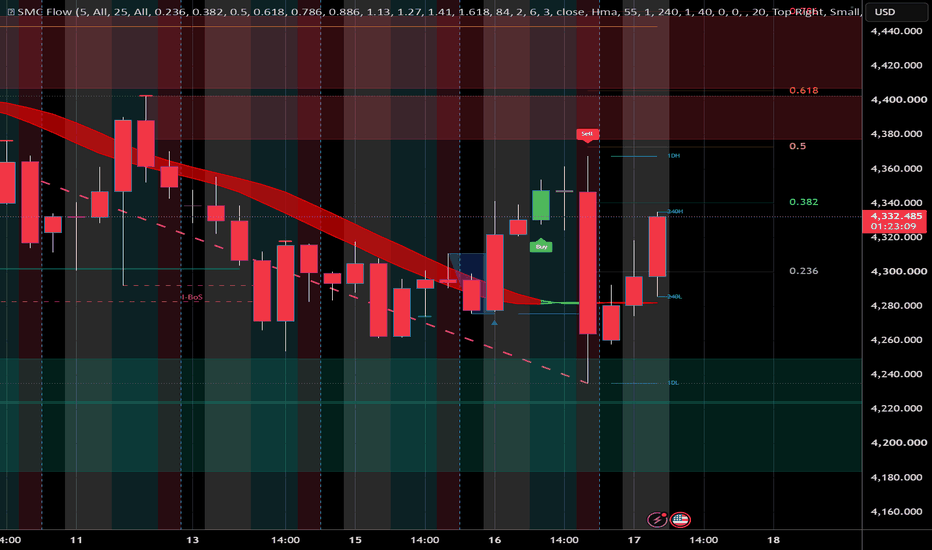
This analysis is for educational purposes only and is not financial advice. XAUUSD Breakout & Retest: Key Levels & Trade ScenariosFollowing a breakout above the descending red trend channel, XAUUSD reached a high near 4,380 before pulling back to establish a clean higher low around 4,270–4,280. Price is currently testing immediate resistance at 4,334–4,340 (0.382 Fib retracement).
Key Technical Levels
Resistance: 4,340 (0.382 Fib), 4,368–4,380 (0.5 Fib & recent high), 4,405 (0.618 Fib)
Support: 4,300 (0.236 Fib), 4,270–4,280 (Higher Low / Structural Demand)
Trade Scenarios
Bullish Continuation (Breakout): Look for a 4H candle close above 4,340 to confirm momentum toward 4,368–4,380, with extended targets at 4,405. Invalidated below 4,315.
Long on Dip (Demand Retest): A controlled pullback into the 4,295–4,300 zone with lower-timeframe bullish rejection wicks offers a long entry back toward 4,340 and 4,380. Invalidated below 4,270.
Bearish Short (Resistance Rejection): If price fails to clear 4,340–4,350 and forms heavy rejecti
on wicks, expect a move back down toward 4,300 and 4,275. Invalidated above 4,360. Long