Short
Short
 Short
Short
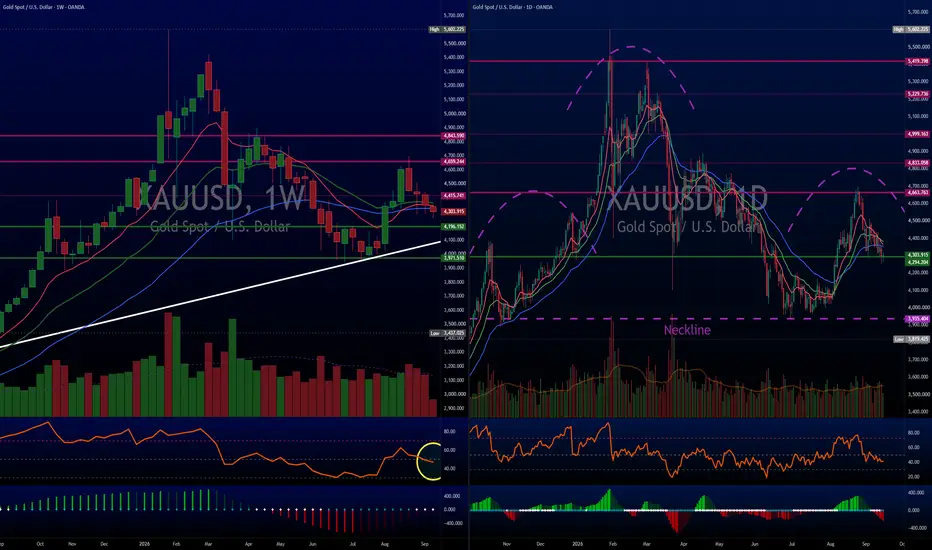
GOLD: Technical Warning, Retail Trap, & Real OpportunityThe daily and weekly charts are carving out a textbook Head and Shoulders distribution pattern. If the structural neckline below gives way, gravity takes over. When an asset finishes a parabolic run, the psychology always flips the exact same way.
Retail Bell Has Rung
Look at the sentiment markers around you. When everyday shoppers are tossing one ounce bullion bars into their shopping carts right next to bulk groceries at Costco, the mania has reached peak saturation. Retail FOMO is in full force.
Most people buying physical over the counter treat gold like an overnight momentum trade. They do not realize that wholesale bullion dealers and coin shops will haircut them when they try to sell. Costco certainly will not buy those bars back.
THOSE FOLLOWING US FOR SOME TIME KNOW WE LOVE GOLD!!! But there is also a "trading" aspect to it pushed by media.
Media Shift and Capitulation
If that neckline confirms a breakdown, financial news outlets will suddenly plaster the drop everywhere. The euphoria will vanish instantly and the headlines will scream about gold dying, the inflation trade ending, and real yields crushing commodities. Late buyers who bought the hype will get burned, panic, and likely swear off the metal entirely.
That emotional capitulation is where the next major bottom gets built.
What About Central Bank Buying?
Everyone points to foreign central banks hoarding physical gold as a reason the price can never fall. Central bank accumulation is massive for sovereign reserves, but it is microscopic compared to the paper market. The paper futures and wholesale clearing markets in New York and London trade that equivalent tonnage in a matter of weeks.
Sovereign central banks are patient, unhedged, and long term. They do not chase green daily candles. When leveraged paper contracts liquidate and trend following algorithms dump their positions, paper volume completely overwhelms physical buying in the short term. Central banks will simply sit back, let the paper market flush, and quietly reload at a steep discount.
Opportunity OPINION
DO NOT let the coming headlines blind you.
A technical flush would simply clean the speculative leverage out of the system. Once the retail crowd is disgusted, the pattern completes its measured move, and negative headlines peak, smart money will step back in to accumulate.
If you missed the last major multi year breakout, a full flush and neckline breakdown COULD hand you the generational buying opportunity you thought you lost.
Watch the neckline. Let the liquidation play out first.
TGtg! XAUUSD 1H: Descending Channel Continuation SetupTechnical Overview:
Gold (XAUUSD) 1-Hour timeframe par ek clear Descending Channel ke andar trade kar raha hai. Overall price action bearish trend ko continue kar raha hai aur resistance levels se rejection dekhne ko mil rahi hai.
Key Levels to Watch:
Resistance / Stop Loss Zone: 4,360 - 4,365 area ke paas strong resistance majood hai.
1st Target Area: 4,280 (Support Line / Key Pullback level)
2nd Target Area: 4,240
Final Target Area: 4,200 (Lower Channel Boundary)
Trade Idea & Execution Plan:
Price abhi upper trendline resistance ke qareeb react kar rahi hai. Agar breakout nahi hota aur rejection continue rehti hai, toh breakdown ke baad target zones ki taraf move expect ki ja sakti hai:
First retest ke baad 4,280 tak short-term move.
4,280 ke neeche continuous pressure se price 4,240 aur phir final support 4,200 tak slide kar sakti hai.
TradingView post ki visibility aur reach barhane ke liye yeh hashtags use karein:
#XAUUSD #GoldAnalysis #ForexTrading #TechnicalAnalysis #PriceAction #TradingSetup #ForexMarket #TradingView Long 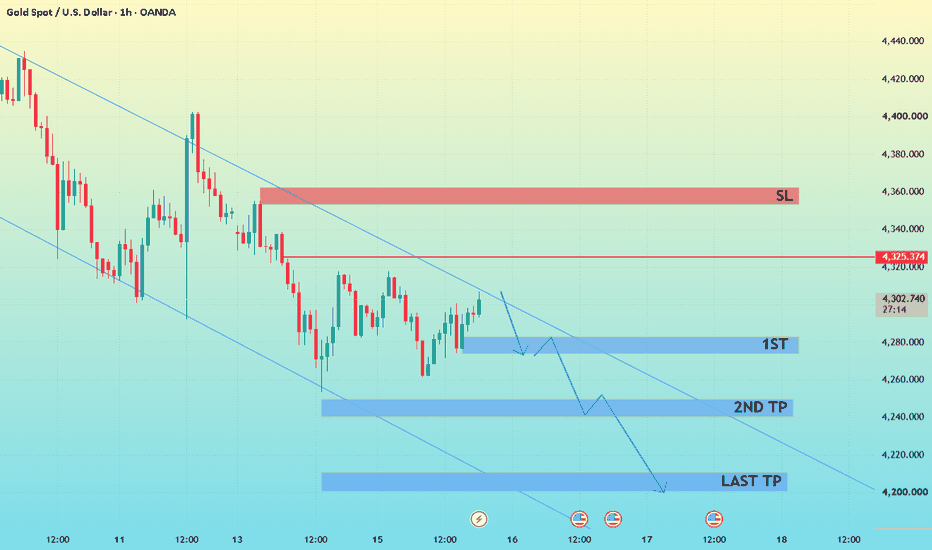
Short 
WTI Crude (USOIL): Long breakout to $110–$120Entry Trigger: Confirmed Daily Close above the multi-month descending trendline ($88.00–$88.50)
Targets: TP1: $102.00 | TP2: $112.00 | TP3: $120.00
Invalidation / Stop Loss: Daily close below the higher-low swing shelf at $80.50
1. Market Structure & Futures Curve (CL1! - CL2!)
The front-to-second month prompt calendar spread ( NYMEX:CL1! - NYMEX:CL2! ) is holding firmly in backwardation at +$2.11/bbl.
Backwardation confirms that commercial buyers and refineries are actively paying a premium for immediate physical delivery over deferred contracts.
This dynamic signals tight physical inventories at the Cushing delivery hub and provides a positive roll yield environment for long positions.
2. Refining Demand (3:2:1 Crack Spread)
The US Gulf Coast 3:2:1 Crack Spread is consolidating around $60.00/bbl, maintaining levels well above the $30 historical baseline and above its 20-day SMA.
Elevated refinery margins incentivize refiners to operate near full capacity, ensuring sustained demand for physical crude feedstock to produce gasoline and distillates.
Note: I cannot embed the multi-pane indicator chart directly here without a paid TV tier, but the open-source Pine Script code is publicly available on my GitHub repository: github.com
3. CFTC COT Report
Managed Money Net Length: ~123.4k contracts (rebounding from summer lows of ~62k).
Speculative positioning remains far below historical overbought extremes (350k–450k contracts). This leaves substantial dry powder for systematic CTAs and momentum funds to add long exposure without immediate risk of positioning exhaustion.
4. Technical Setup
Price Action: USOIL is breaking out of a multi-month descending wedge/trendline originating from the Q2 highs, while forming a series of higher swing lows since July.
Risk/Reward Profile:
Entry: ~$88.50
Stop Loss: $80.50 (Risk: $8.00/bbl)
TP1: $102.00 (1.68 R): Intermediate resistance / Q2 consolidation shelf
TP2: $112.00 (2.93 R): Major supply zone
TP3: $120.00 (3.93 R): Cycle high retest
5. Fundamentals & Geopolitics
Structural Deficit: Global supply contraction outpaces demand adjustments, driving sustained draws across commercial storage.
Exhausted Policy Buffer (US SPR): The US Strategic Petroleum Reserve sits near ~293M barrels (a 40-year low). The policy lever used in 2022 to suppress price spikes via massive strategic releases is largely absent.
OPEC+ Restraint: True immediate spare capacity remains concentrated almost exclusively in Saudi Arabia and the UAE, limiting the coalition's ability or willingness to suddenly flood the market.
US Upstream Discipline: The US oil rig count (~447 rigs) reflects strict E&P capital discipline, prioritizing free cash flow and dividends over aggressive production growth.
Maritime Chokepoint Risk: Elevated security risks in the Strait of Hormuz and Red Sea maintain high war-risk tanker insurance premiums, driving international buyers to pull replacement barrels from the US Gulf Coast.
Infrastructure Bottlenecks: Mediterranean supply disruptions and extended dark-fleet voyage times increase the volume of global oil locked in transit on water.
6. How to Play This
A. Direct Futures
Instruments: Standard WTI ( NYMEX:CL1! , 1,000 bbls) or Micro WTI ( NYMEX:MCL1! , 100 bbls).
Mechanics: 1:1 spot exposure with positive roll yield in backwardation.
Best For: Active commodity traders seeking pure spot alpha with defined leverage.
B. Defined-Risk Options Spreads
Instruments: Bull Call Vertical Spreads on AMEX:USO or NYMEX:CL1! (3–6 month expiry, Long $90 Call / Short $115 Call).
Mechanics: Capped risk limited strictly to the net premium paid. Selling the higher strike call neutralizes theta (time decay) and offsets high implied volatility.
Best For: Traders wanting asymmetric upside while completely eliminating margin liquidation risk.
C. High-Beta ETFs & Pure Drillers
Instruments: AMEX:XOP or pure upstream producers like NYSE:OXY , NASDAQ:FANG , $NYSE:EOG.
Mechanics: Upstream drillers have fixed lifting costs (~$35–$45/bbl). When crude rallies from $88 to $115+, operating cash flows expand by >50%, giving AMEX:XOP a historical beta of ~1.3–1.6x relative to $TVC:USOIL.
Best For: Equity traders seeking capital appreciation via corporate earnings growth.
D. Integrated Energy Majors
Instruments: AMEX:XLE or individual majors ( NYSE:XOM , NYSE:CVX ).
Mechanics: Integrated giants capture refining margins ($60/bbl crack spread) while paying a stable ~2.8%–3.3% dividend yield.
Best For: Conservative swing traders and long-term investors prioritizing downside protection and dividend income.
E. Commodity Exchange-Traded Funds
Instruments: AMEX:USO
Mechanics: Equity ETF holding front/second-month crude futures and US Treasuries.
Best For: Standard equity brokerage accounts.
 Long
Long
WTI Crude Oil (1D): $106 Breakout & Textbook ABC ImpulseTitle: WTI Crude Oil (1D): $106 Breakout & Textbook ABC Impulse Toward $120+ 🛢️🚀
🧠 Fundamental Overview (Geopolitical Spike & Macro Supply Shock):
WTI Crude Oil (SPOT) has exploded higher, pushing past the critical $105–$106/bbl threshold to trade at its highest levels since early May. The rally is heavily backed by severe supply disruptions and escalating geopolitical tensions:
Geopolitical Escalation & Supply Risk: Following renewed drone strikes in the Middle East that shut down critical infrastructure—including Saudi Arabia's East-West pipeline—and intensified maritime friction around the Bab al-Mandab strait and the Strait of Hormuz, the supply risk premium has expanded aggressively.
Inflationary Spillover: As highlighted by The Kobeissi Letter, U.S. crude prices are up over +57% since July 2nd , pushing average retail gasoline prices up to $4.33/gallon . WTI is now sitting roughly 13% away from the peaks reached at the onset of the conflict, directly stoking global stagflation and interest rate worries.
📊 Technical Breakdown (1D Timeframe):
On the daily chart, price action is unfolding a textbook bullish ABC impulse off the multi-month ascending baseline:
1️⃣ Confirmed ABC Wave Structure & Dynamic Reclaim:
After an initial impulse to the $102.45 peak (Wave A), the corrective Wave (B) bottomed within a deep retracement between the 61.8% ($91.97) and 78.6% Fibonacci levels, briefly testing the rising macro Trendline B around $75.22. From that floor, the market triggered an aggressive Wave (C) expansion that cleanly sliced through the 50-day EMA ($88.35) , the 200-day EMA ($82.22) , and descending Trendline A —a dynamic diagonal ceiling that had contained every rally attempt for months.
2️⃣ Volume Expansion:
The last two daily sessions have recorded a noticeable volume spike (reaching ~86.97k ticks), proving heavy institutional participation driving this breakout rather than a low-volume liquidity squeeze.
3️⃣ MACD Convergence:
The daily MACD exhibits total directional alignment with price action—printing expanding green histogram bars and an aggressive bullish crossover without showing technical overbought exhaustion yet.
4️⃣ Fibonacci Extension Targets:
Target A (1.618 Fib Extension / Macro Ceiling): $119.40 – $120.00 USD (Direct confluence of the 1.618 Fib extension and the previous macro highs).
Target B (2.000 Fib Extension): $129.88 USD (Full measured impulse expansion).
🎯 Conclusion & Trading Strategy:
The technical structure is decisively bullish, pointing straight toward the macro resistance block at $120 USD.
However, from an execution standpoint, chasing fresh long positions right here at $106.75 means entering late with unfavorable asymmetry. The optimal entries were either:
Aggressive Entry: Directly in the 61.8%–78.6% Fib reversal zone ($75–$78).
Conservative Confirmation: On the breakout above both EMAs and Trendline A around $83–$84 USD.
At current levels, price is only about 10% away from its major macro target, while the downside exposure on a sharp mean-reversion is wide. A local pause or corrective pullback near the intermediate $109–$110 supply zone to digest gains would be healthy before attempting the final push to $120. If such a pullback occurs, watch closely for fading volume and potential oscillator divergences to gauge whether it is a continuation flag or a deeper reversal.
Are you trailing profits toward $120 or looking to short the extension? Let's discuss in the comments! 👇
⚠️ Disclaimer: This analysis is strictly for educational purposes and intended solely to intellectually enrich our trading community. It does NOT constitute financial or investment advice. Always perform your own research and manage your risk strictly. Long 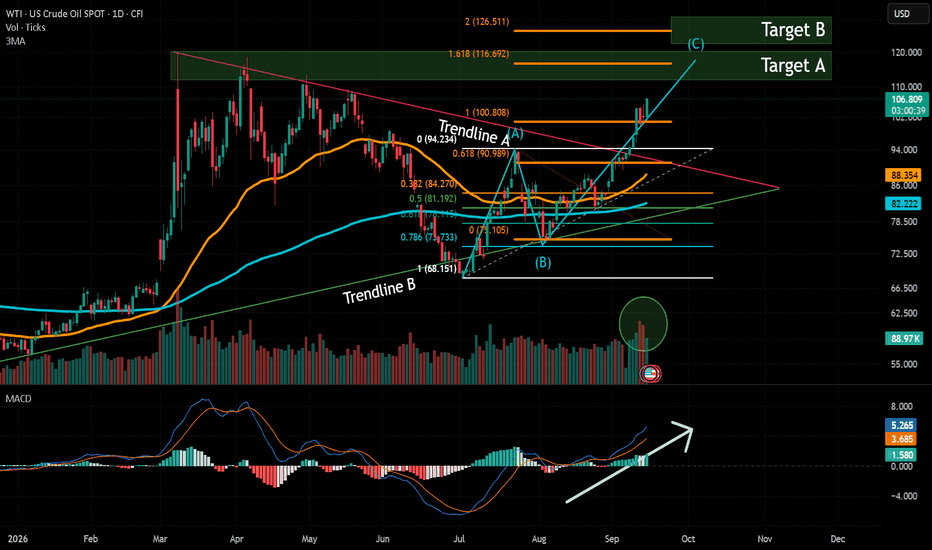
GOLD Price Update – Clean & Clear ExplanationGOLD is showing continued bearish pressure on the 1H timeframe, with price repeatedly failing to sustain moves above key resistance zones. The market is forming lower highs while remaining below the descending trendline, indicating that sellers are still controlling the short-term structure.
Technically Price recently rejected the 4,380–4,400 resistance area and moved back toward the 4,320 support zone. A sustained break below this area could open the way for further downside toward 4,280, followed by the major 4,250–4,245 target zone.
The bearish setup remains valid while Gold stays below the 4,400–4,420 resistance region. A strong breakout and close above this zone would weaken the bearish structure and could trigger a recovery.
overall short-term bias remains BEARISH below 4,400–4,420. Sellers appear to be targeting the lower liquidity zones, while a confirmed breakdown below 4,320 could accelerate the downside move. Short 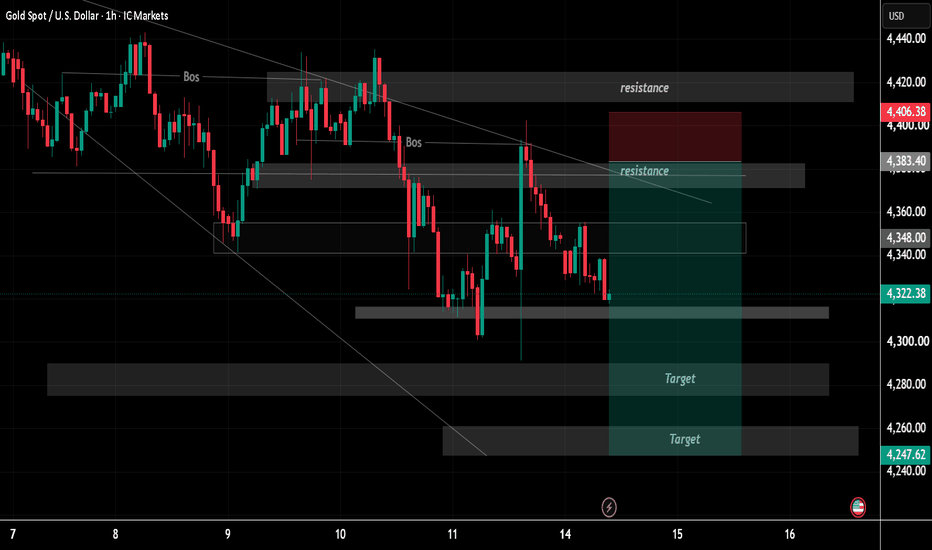
Trendline Break + Retest — A Smarter Way to Confirm a Trend ChanTrendline Break + Retest is a simple but powerful price-action concept that can help traders avoid chasing breakouts and instead wait for confirmation. Many traders see price breaking a trendline and immediately enter a position, but a trendline break alone does not guarantee that the market has completely changed direction. Price can break the trendline, create a false breakout, and quickly move back into the previous trend. This is why understanding the complete sequence — Trendline Break → Retest → Market Structure Confirmation → Entry Planning — is important.
First, identify the existing market trend and structure. During a bearish trend, price normally creates Lower Highs and Lower Lows, while during a bullish trend, price creates Higher Highs and Higher Lows. A descending trendline can be drawn across important swing highs during a downtrend, while an ascending trendline can connect important swing lows during an uptrend. The trendline should be based on meaningful price swings rather than random candles.
Once the market reaches the trendline, watch how price reacts. If price breaks and closes beyond the trendline with strong momentum, this can be an early indication that the previous trend is losing strength. However, instead of entering immediately after the breakout candle, traders can wait for price to return toward the broken trendline. This is known as the retest.
The retest is important because it allows us to see whether the breakout is being accepted by the market. For example, if price breaks above a descending resistance trendline and later returns to the same area, the old resistance may potentially become new support. If buyers defend that area and price begins moving higher again, the setup becomes more interesting. On the other hand, if price falls back below the trendline and continues making lower lows, the breakout may have failed.
After the retest, the next important factor is market structure confirmation. Look for a BOS (Break of Structure) or a clear transition from Lower Highs/Lower Lows toward Higher Highs/Higher Lows. A Higher Low after the retest can show that buyers are beginning to defend higher prices, while a new Higher High can provide additional confirmation that bullish momentum is developing.
The same concept works in the opposite direction. During an uptrend, price may break below an ascending trendline, return to retest it from underneath, and then reject the level as new resistance. If bearish market structure confirms the move through a Lower High and Lower Low, traders may then evaluate a potential bearish setup.
The main idea is not to predict the market before confirmation. Instead, allow price to show its intentions. A trendline break tells you that something may be changing. The retest shows how price reacts to the broken level. Market structure confirmation provides additional evidence. Only then should you consider a potential Entry, Stop-Loss and Take-Profit according to your trading plan.
For risk management, the stop-loss should be placed at a logical invalidation point where the setup would no longer make sense. Targets can be planned around previous swing highs or lows, major support and resistance, liquidity areas, or predefined risk-to-reward levels. Never increase risk simply because the breakout looks strong.
One of the biggest mistakes traders make is chasing the breakout. When price moves quickly, emotions can create FOMO, causing traders to enter at poor locations. Waiting for a retest can provide a more structured opportunity and a clearer point where the trade idea can be considered invalid.
However, remember that not every breakout will retest. Sometimes price will continue immediately without giving another entry opportunity. That is completely fine. A trader does not need to catch every movement in the market. The goal is to follow a clear process rather than force a trade.
🔥 THE COMPLETE PROCESS
1️⃣ Identify the Trend
Understand whether the market is bullish, bearish, or ranging.
2️⃣ Draw the Trendline
Connect meaningful swing points and avoid forcing the line.
3️⃣ Wait for the Break
Look for a convincing break and preferably a candle close beyond the trendline.
4️⃣ Wait for the Retest
Allow price to return toward the broken trendline instead of chasing the initial move.
5️⃣ Watch the Reaction
Look for rejection, acceptance, or a clear change in momentum.
6️⃣ Confirm Market Structure
Look for BOS, Higher High/Higher Low for bullish confirmation or Lower High/Lower Low for bearish confirmation.
7️⃣ Build the Trade Plan
Define your Entry, SL, TP1, TP2 and TP3 before taking unnecessary risk.
🧠 KEY LESSON
TRENDLINE BREAK = WARNING
RETEST = REACTION
BOS = CONFIRMATION
ENTRY = TRADE PLAN
The market does not owe us an immediate entry. Sometimes the best trade is the one we wait for.
The strongest habit to develop is patience. Rather than buying the first breakout candle or selling the first breakdown candle, wait for price to return, observe the reaction, confirm the structure, and then decide whether the setup actually fits your plan.
📌 Remember:
BREAK → RETEST → CONFIRM → PLAN → EXECUTE
This approach does not guarantee winning trades, but it gives traders a clearer and more structured way to analyze potential trend changes while keeping risk management at the center of the decision.
Education 
FOMC Is Testing Gold and Bitcoin Differently: XAUUSDT vs BTCFOMC Is Testing Gold and Bitcoin Differently: XAUUSDT vs BTC
One macro catalyst can create very different setups across TradFi and crypto.
With the FOMC decision approaching, oil remains above $100 while US Treasury yields are elevated. That creates a difficult environment for both gold and Bitcoin, but the way they respond to rates and risk sentiment is different.
🟡 XAUUSDT My Selected Setup
Gold is currently trading around $4,290, caught between safe-haven demand and pressure from higher yields.
The key area I’m watching is $4,267 support.
I don’t want to chase the current price. My preferred setup is a liquidity sweep into $4,267–$4,285 followed by a bullish reclaim.
Long idea: $4,270–$4,285 after confirmation
Invalidation:Clean break below $4,253
Target 1:$4,300–$4,318
Target 2: $4,330
Target 3: $4,355
If buyers reclaim $4,300–$4,318 and hold it after the FOMC volatility, the upside structure becomes much stronger.
If $4,253 breaks decisively, I would abandon the long thesis and wait for a lower setup.
🔵 BTC Supporting Comparison
BTC is also sensitive to the FOMC, but its reaction is more closely tied to liquidity and overall risk appetite.
I’m watching the $75K–$76K support zone. A reclaim of $77K–$78K after the FOMC reaction would improve the short-term structure, while losing $75K would keep downside pressure elevated.
📊 Why XAUUSDT Has the Cleaner Setup
For this catalyst, I prefer Gold because the relationship between Fed policy → yields → USD → gold gives me a clearer framework.
BTC adds another layer through broader crypto risk sentiment.
So my plan is simple:
No pre FOMC chase. Wait for the liquidity sweep, then trade the confirmation.
The reaction matters more than the headline.
This is my market analysis and trading plan, not financial advice. Long 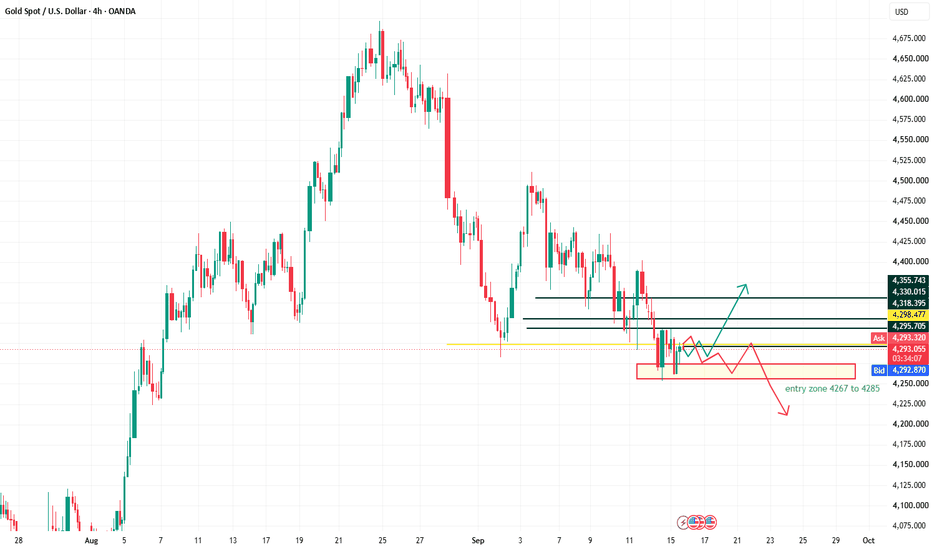
Short 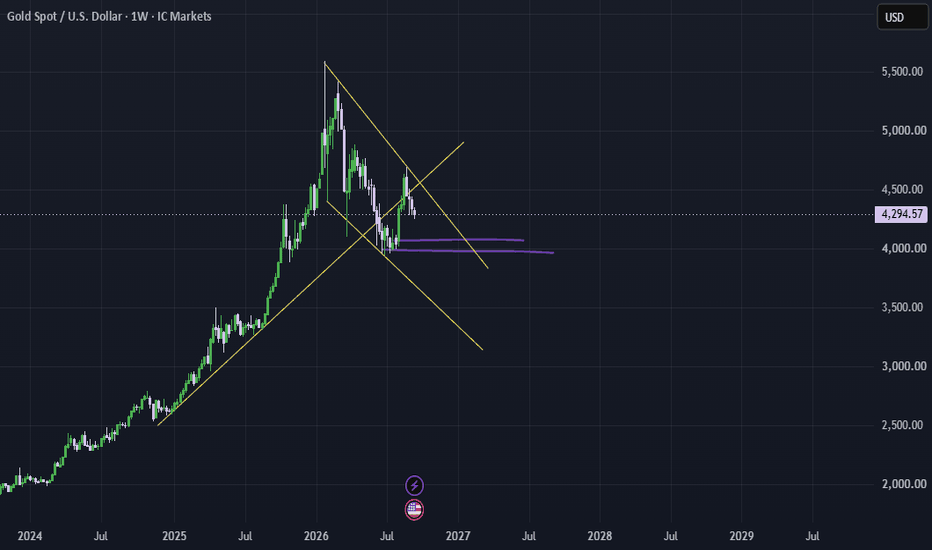
Long 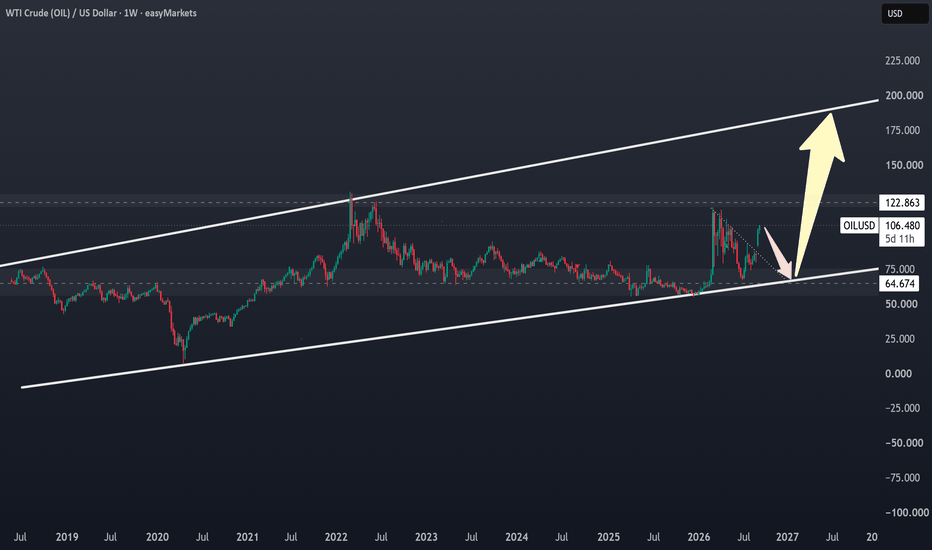
Short 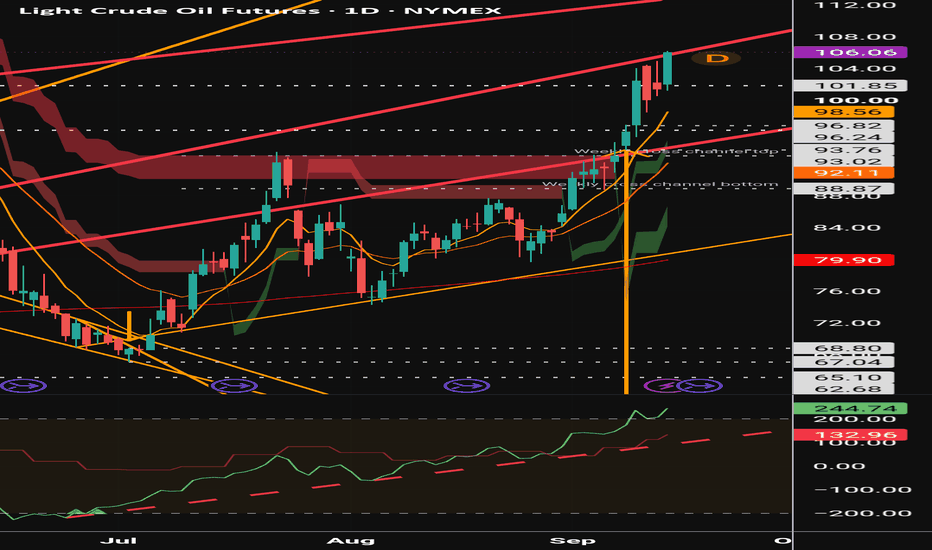
Short 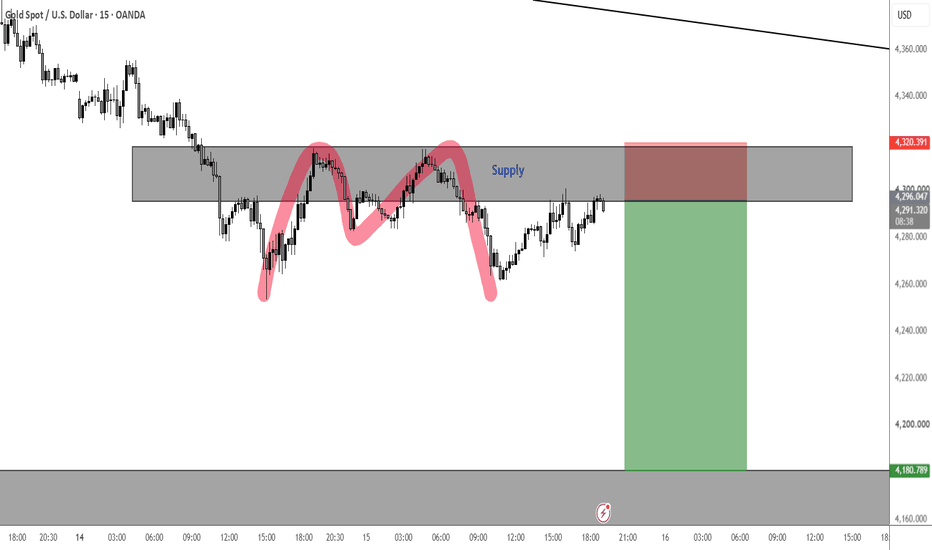
Short 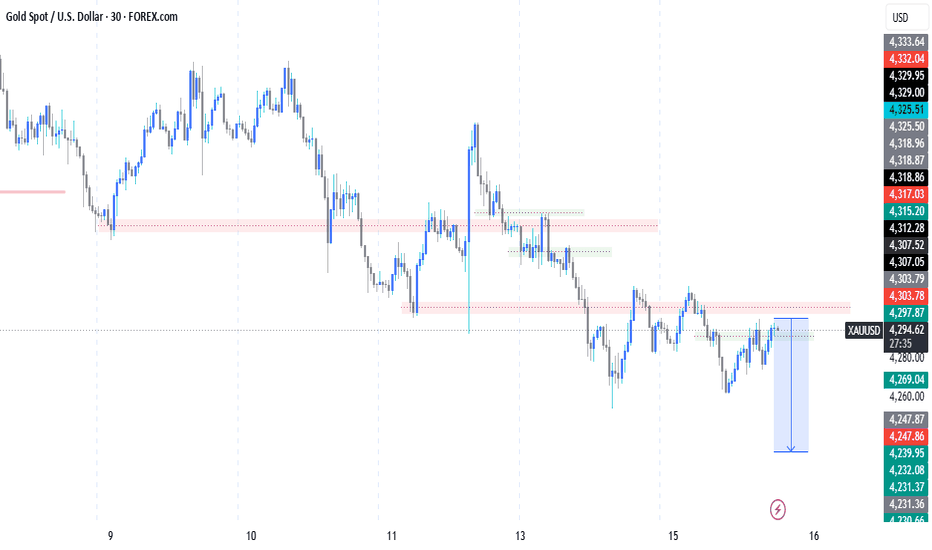
maintain selling pressure below 4,3001. Market Structure
Bias: Bearish – Downtrend / Bearish Continuation
Gold is trading around 4,274.8, below both moving averages:
EMA 9: 4,287.7
EMA 89: 4,325.6
EMA 9 < EMA 89 → bearish momentum remains dominant.
Price continues to respect a descending channel, forming a sequence of Lower Highs and Lower Lows.
2. Resistance
4,285–4,300: EMA 9 + short-term recovery zone
4,320–4,330: EMA 89 + major resistance
4,350–4,380: upper channel resistance
A sustained break above 4,330 would weaken the current bearish structure.
3. Support
4,250–4,255: immediate support / channel bottom
4,220–4,230: major downside target and demand zone
A clean break below 4,250 could accelerate the decline toward 4,225.
----------------------
signal : BUY GOLD : 4225 - 4222
SL : 4217
TP : 4235 - 4250 - 4277
----------------------- Short 
Short 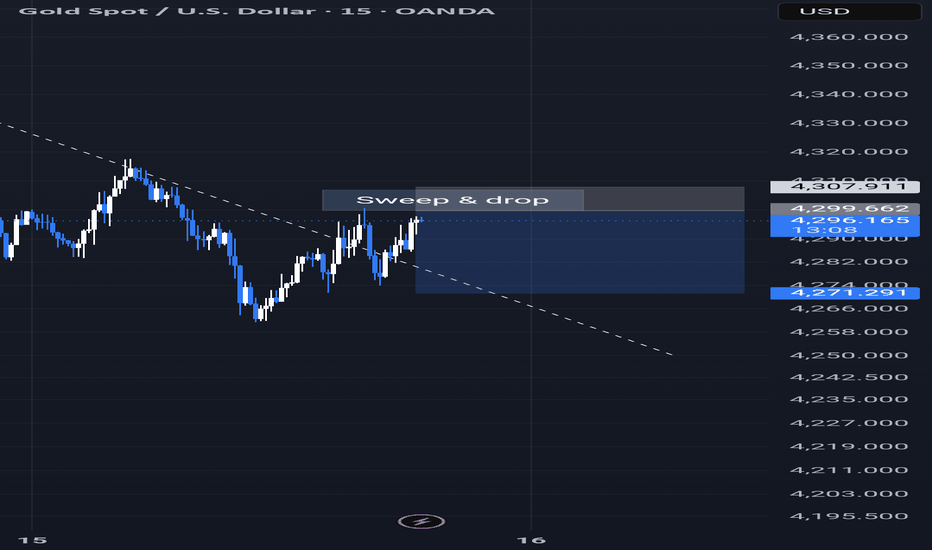
Long 
Short 
SilentEntry - GOLD (XAUUSD) Daily Outlook-15 September 2026 | H1Gold remains within a broader bearish H1/H4 structure, but price is currently consolidating after buyers defended the 4260–4280 First Support zone.
Price is now trading around 4292, directly inside the 4285–4300 Decision Area. This is currently a WAIT zone, not an ideal location to chase either direction.
The recent H1 structure has created liquidity on both sides. Buyers have defended the lows around 4260–4280, while recovery attempts continue to struggle around 4310–4330.
📊 Market Structure
D1: 🔴 Bearish / Corrective
H4: 🔴 Bearish
H1: 🟡 Bearish / Consolidation & Recovery Attempt
The broader structure continues to favor sellers while Gold remains below 4330–4355.
However, sellers need to break 4260 before the next bearish continuation can be considered confirmed.
🟢 BUY Scenario
Gold needs to defend 4285–4300 and reclaim 4310.
The stronger confirmation would be an H1 break and acceptance above 4310–4330.
If confirmed:
🎯 TP1: 4310–4330
🎯 TP2: 4340–4355
🎯 TP3: 4385–4400
Acceptance above 4330 would strengthen the recovery structure.
A sustained reclaim above 4355 would represent a more meaningful bullish structural improvement.
🔴 SELL Scenario
The broader structure still favors sellers while Gold remains below 4310–4330.
A rejection from 4310–4330, followed by a loss of 4285, would favor another move lower.
🎯 TP1: 4260–4280
🎯 TP2: 4230–4250
🎯 TP3: 4190–4215
Alternatively, an H1 break and acceptance below 4260 would provide direct bearish continuation confirmation.
⚠️ Below 4230 = current recovery thesis invalidated.
💧 Liquidity Map
Buy-side liquidity:
4310–4330 → 4340–4355
Sell-side liquidity:
4260–4280 → 4230–4250
Watch carefully for a liquidity sweep.
A temporary break below 4260 followed by a rapid reclaim of 4280–4300 could indicate sellers being trapped.
Likewise, a spike into 4310–4330 followed by rejection back below 4300 could represent a buy-side liquidity sweep before another bearish move.
⚠️ Current Trading Area
Gold is currently around 4292, inside our 4285–4300 Decision Area.
Do not chase the middle.
The cleaner confirmation areas remain:
🟢 Above 4310–4330 → recovery continuation
🔴 Reject 4310–4330 + lose 4285 → bearish continuation
🔴 Below 4260 with H1 acceptance → stronger bearish continuation
Until one of these conditions develops, patience is preferred.
🗺️ Key Levels
Major Resistance: 4340–4355
Near Resistance: 4310–4330
Decision Area: 4285–4300
First Support: 4260–4280
Major Support / Defence: 4230–4250
Recovery Invalidation: Below 4230
Deeper Bearish Target: 4190–4215
📌 Current Bias: Bearish structure, but WAIT for confirmation because price is trading between nearby buy-side and sell-side liquidity.
The trend favors sellers, but entry location matters more than simply following red candles.
⚠️ Disclaimer: This analysis is for educational and informational purposes only and is not financial advice. Market levels and scenarios are not guaranteed. Gold can be highly volatile, especially around major economic news. Always wait for confirmation, manage risk carefully, and trade according to your own risk tolerance.
🥷 SilentEntry — Precision Entries, Smart Risk
Trade the Plan, Not the Emotion.