GOLD 4H: Liquidity Sweep → Bullish Breakout Setup | XAUUSD MarkeXAUUSD / GOLD – 4H Technical Analysis
Gold is currently trading around 4,368, with the chart showing a clear market-structure setup built around liquidity, FVGs, demand protection, and a potential bullish breakout.
🔍 Market Structure
Price previously pushed strongly higher and created a series of bullish impulses. After reaching the 4,630–4,680 area, price entered a corrective phase and moved back toward the lower demand region.
The current structure suggests that the key question is whether Gold can reclaim the 4,400–4,500 resistance/decision area with confirmation.
🟢 Key Demand / Protection Zone
The chart highlights approximately 4,240–4,280 as the important Demand Protection area.
This zone is significant because:
Previous price reactions occurred around this region.
Liquidity appears to have been taken below nearby lows.
A strong rejection from this area could support a recovery.
Losing this zone would weaken the bullish structure shown on the chart.
🟡 Intraday Decision Zone
The 4,400–4,450 region is an important decision area.
A strong reclaim and hold above this region could indicate that buyers are regaining control. A rejection here could instead send price back toward the lower demand/FVG areas.
🚀 Bullish Breakout Level
The chart marks approximately 4,500 as the Bullish Breakout Level.
If price breaks and sustains above this area, the next upside objective shown on the chart is the 4,630–4,700 liquidity zone.
💧 Liquidity Target
The upper 4,630–4,700 region is marked as a Liquidity Zone. If bullish momentum continues, price may seek liquidity resting around previous highs.
📊 FVG Alignment
Several Fair Value Gaps (FVGs) are marked throughout the structure. These areas can act as potential reaction or mitigation zones as price moves through the market.
🧠 Trading Idea
The chart favors waiting for confirmation rather than chasing the move.
Bullish scenario:
Demand holds → price reclaims 4,400–4,450 → breakout above ~4,500 → potential move toward 4,630–4,700 liquidity.
Bearish/invalidation scenario:
Price gets rejected from the decision/breakout area and loses the 4,240–4,280 demand protection zone, which would weaken the bullish setup and expose lower levels.
Key concept: Liquidity + Market Structure + FVG + Demand = confirmation-based setup.
⚠️ Risk management: This is technical analysis, not a guaranteed prediction. Wait for confirmation and manage risk according to your own trading plan.  Long
Long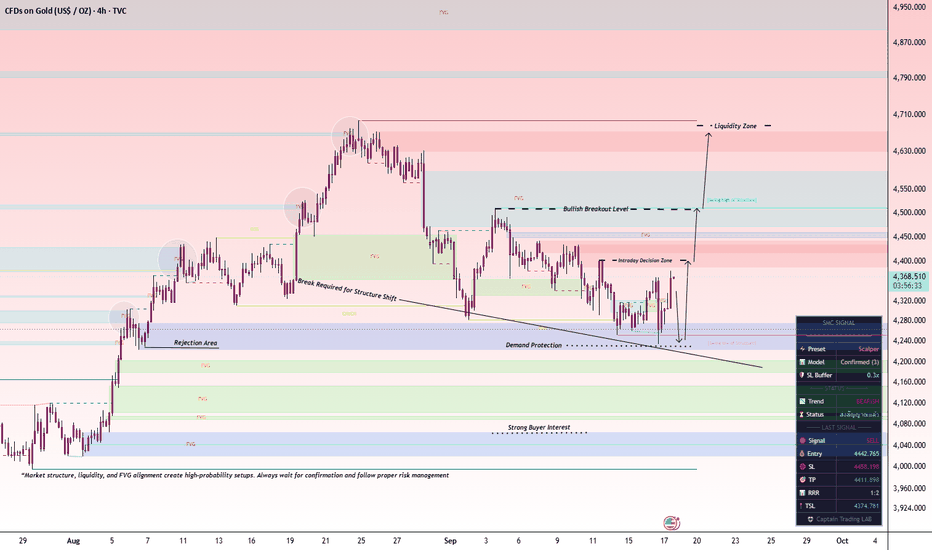
XAGUSD — Rally Into Major Resistance | Bears Still in Control?Silver has made an aggressive recovery from the 62.32 swing low, but the important question is not whether buyers have momentum — it’s what happens now that price has reached resistance.
What I’m watching
Price has retraced through several Fibonacci levels from the 62.32 → 68.33 range:
0.236 — 63.74
0.382 — 64.62
0.50 — 65.33
0.62 — 66.05 ⭐
0.79 — 67.07
1.00 — 68.33
Current price near 65.60 has already reclaimed the 0.50 level, but it is moving directly into the 0.62 Fibonacci retracement around 66.05.
That makes 65.60–66.05 the key decision zone.
Why this area matters
There is a strong concentration of resistance here:
Descending trendline + Fibonacci 0.62 + horizontal resistance + moving-average resistance.
In other words, buyers are running into several technical barriers at approximately the same price.
That is exactly the type of confluence zone I want to see before looking for the market's next larger move.
Bigger-picture structure remains bearish
Despite the strong move off 62.32, price is still trading beneath the major descending trendline originating from the highs near 71.00.
The market continues to show a broader sequence of lower highs and lower lows.
So for now, I view the rally as a retracement within the downtrend rather than a confirmed bullish reversal.
The next few candles are extremely important.
Bearish scenario 📉
If sellers defend approximately 65.60–66.05 and we receive bearish confirmation, my downside roadmap becomes:
TP1 — 64.62
0.382 Fibonacci
TP2 — 63.74
0.236 Fibonacci
TP3 — 62.32
Previous swing low
A clean break beneath 62.32 would confirm another lower low and expose the Fibonacci extension targets:
TP4 — 60.70
-0.27 extension
TP5 — 58.61
-0.618 extension
That final area also aligns closely with the lower portion of the broader descending channel, making 58.61–60.70 especially interesting if bearish momentum accelerates.
Bullish scenario 📈
I'm not ignoring the buyers.
A convincing close above 66.05 and the descending trendline would materially weaken this bearish setup.
Above there, the next resistance becomes:
67.07 — 0.79 Fib
followed by:
68.33 — previous swing high
If buyers reclaim 68.33, the market structure would require a major reassessment because price would no longer simply be retracing within the current downswing.
The key takeaway:
This isn't the area where I want to chase the rally.
It's the area where I want to watch the reaction.
Silver has rallied from roughly 62.32 → 65.60, but it has now reached one of the strongest technical resistance clusters on the chart.
Below 66.05: bearish structure remains intact.
Above 66.05: bulls begin gaining control.
Above 67.07: bullish continuation becomes increasingly significant.
Below 62.32: bearish continuation is confirmed.
My current bias:
Short-term: Bullish retracement 🟢
Overall structure: Bearish 🔴
Critical battlefield: 65.60–66.05
The setup becomes particularly attractive if price sweeps into the 0.62 level, rejects the descending trendline, and then closes back beneath the 0.50 Fib at 65.33. That would give sellers considerably stronger confirmation than simply entering because price reached resistance.  Short
Short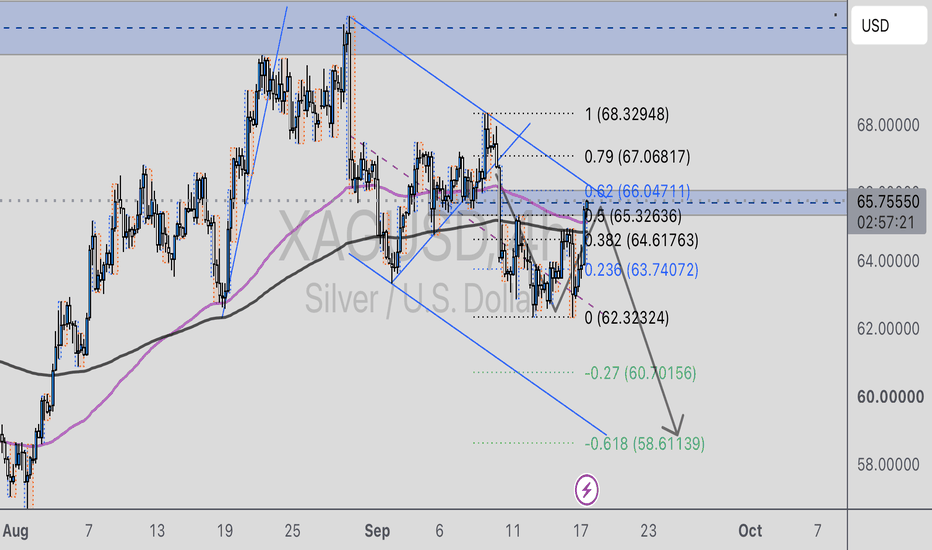
Elliott Wave Analysis – XAUUSD 17/9/2026
H4 Timeframe
After the FOMC announcement, we witnessed a very strong bearish H4 candle. At the moment, price is making a rebound after that sharp decline.
As I mentioned yesterday, trying to label the wave structure precisely at this stage is not really necessary. What matters is that the corrective move has already reached the 0.618 retracement of the previous 1–2–3–4–5 wave structure. This is often a target area where a correction may come to an end, also known as the OTE zone.
Looking at the Volume Profile, we can clearly see liquidity clusters forming around different price levels.
Most importantly, the recent decline closed below the major liquidity zone around 4316. This suggests that 4316 may now act as resistance. If price retraces back into this area, there is a strong possibility that another bearish move could develop.
Next, pay attention to the price zone between 4112 and 4223. This is a liquidity void, while directly above this area there is an important low at 4223.
What does this mean?
There is likely a large amount of Stop Loss liquidity resting below the 4223 low, together with a significant number of pending sell orders below this area. Therefore, price may continue to sweep below 4223 in order to take this liquidity before potentially reacting and moving higher again.
So, at the moment, there are two key price zones I am focusing on:
4316: the area where I will watch for a potential Sell setup if price retraces higher.
4223: the area where I am waiting for a liquidity sweep below the low, followed by a possible bullish reaction. Short 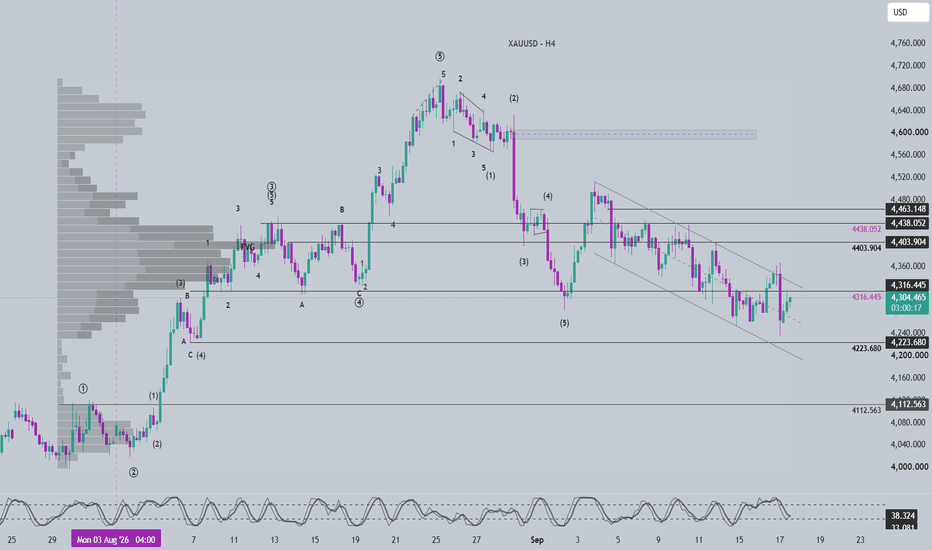
Short 
Long 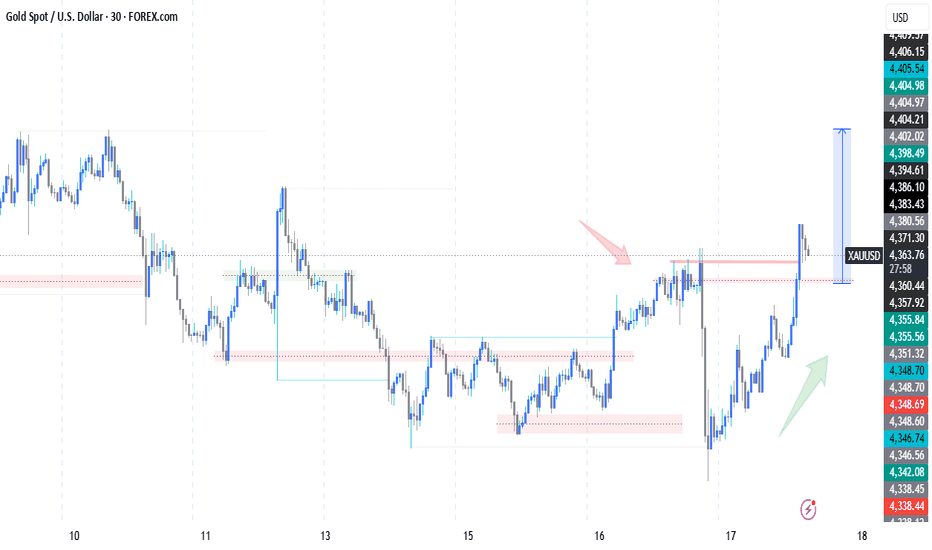
The Fed Raised Rates, Yet Gold Is Still Rising!The gold market has once again surprised investors. After the Fed raised its interest rate by 25 basis points to 3.75–4.00% on September 16 , gold did not continue falling. Instead, it reversed higher. On September 17, XAUUSD gained around 1.6% and rose toward $4,330 per ounce , even though prices had fallen to approximately six-week lows just the day before.
At first glance, this reaction may seem illogical: higher interest rates usually strengthen the dollar and reduce gold’s appeal. But this time, the market reacted differently — and that is the key to understanding the current move.
Why Is Gold Rising Despite Higher Rates?
The rate hike had already been priced in . The Fed’s decision itself did not come as a surprise to the market. Therefore, after the announcement, some market participants began closing their previous short positions in gold.
Investors are focused not on the hike itself, but on what comes next . The Fed has indeed maintained a hawkish tone and left the door open to another rate hike before the end of the year. However, the market has already started assessing how far the regulator can actually go if the economy begins to slow down.
The oil rally has paused . Reduced pressure from oil prices has somewhat eased concerns about another wave of inflation. This is important for gold because it lowers the risk of even more aggressive Fed tightening.
Demand for safe-haven assets remains strong . Despite the rate hike, geopolitical tensions in the Middle East and overall nervousness in global markets have not disappeared. This continues to support interest in gold as a safe-haven asset.
For the market, it is now important not only to consider the current interest-rate level, but also how quickly the Fed can continue tightening without causing serious damage to the economy and stock market. This is why gold has an opportunity to recover: investors have seen that a hawkish Fed decision does not necessarily mean an automatic continuation of the XAUUSD sell-off.
According to FreshForex analysts, the current gold recovery shows that the market is still willing to buy XAUUSD dips when signs of stabilization emerge . If prices hold above the $4,300 area, buyers may attempt to extend the move toward $4,400–4,500 .
Long 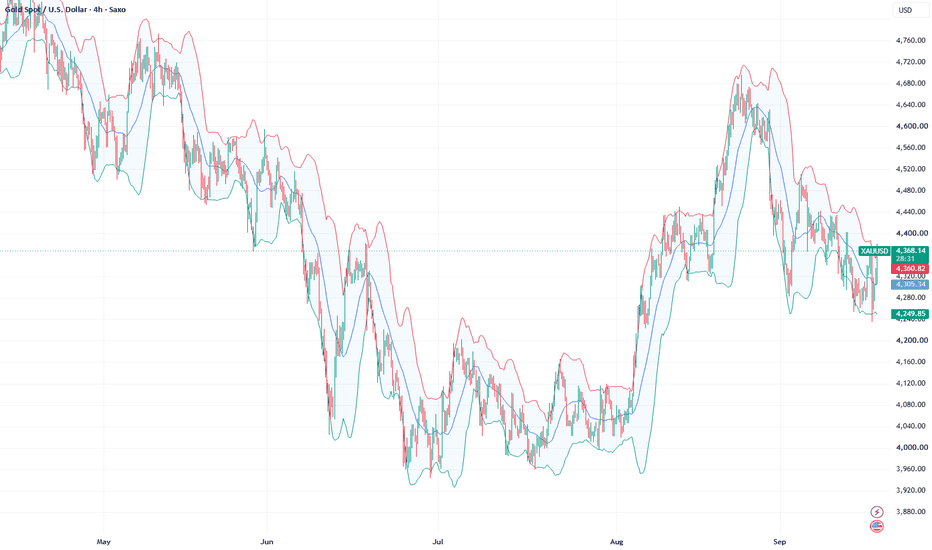
Short 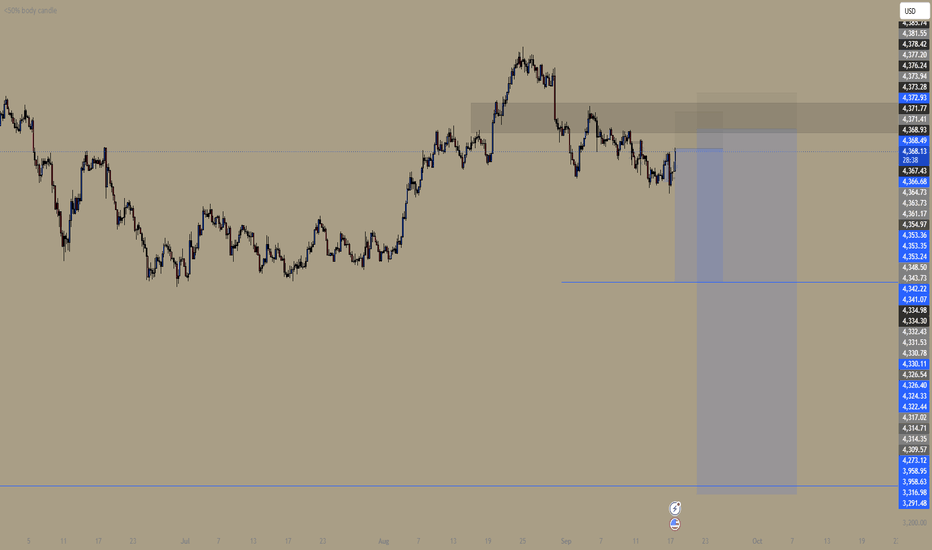
Long 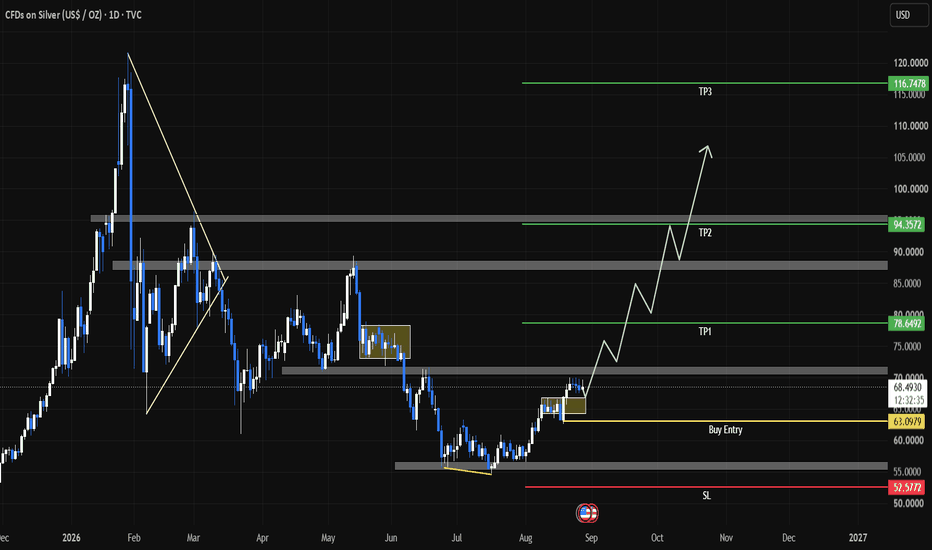
Long 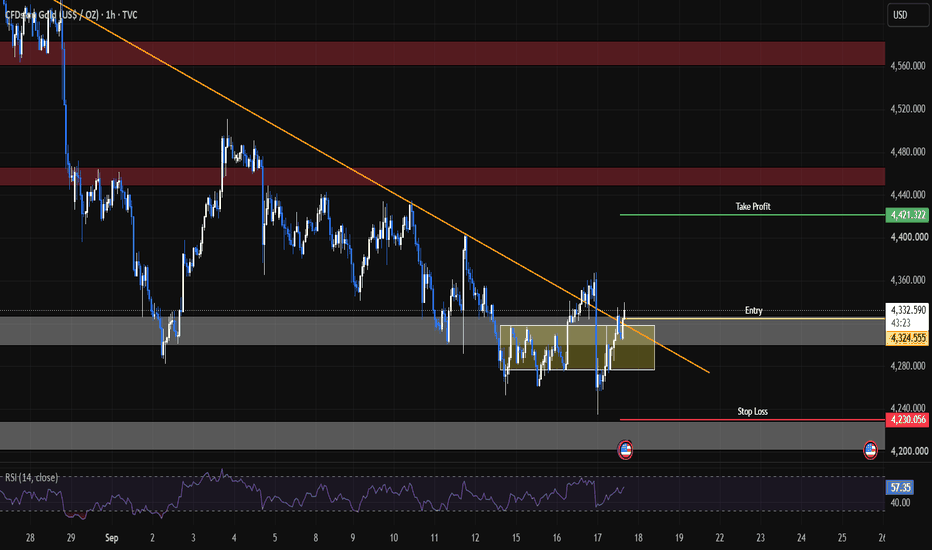
XAUUSD: FOMC Broke the Pattern. Now Gold Must Prove ItGold did not simply fall after FOMC.
It broke something first.
For several sessions, XAUUSD had been climbing inside a short-term rising structure. Buyers gradually pushed price from the 4,250 area toward 4,360.
Then FOMC arrived.
One violent move erased that entire climb, broke the rising structure and drove Gold toward 4,235.
But here is the part I care about:
Gold did not stay there.
Price immediately recovered from the low, returned above 4,260 and is now trading around 4,290.
So instead of asking “Was FOMC bullish or bearish?”, I am asking a much more useful question:
Was 4,235 the beginning of another sell-off — or the liquidity event buyers needed?
⚡ THE FOMC CANDLE CREATED TWO EXTREMES
Look at the chart and ignore everything in the middle for a moment.
The FOMC move gave us two important points:
4,235 below.
4,320 above.
I see the current price trapped between those two extremes.
And until Gold escapes one side, I do not need to predict anything.
I need to react.
The interesting detail is what sits between current price and the FOMC low.
There is an H1 order block around 4,258–4,275.
That zone has already produced a reaction.
For buyers, this is their shelter.
For sellers, it is the floor they need to destroy.
🟢 I WILL BUY WEAKNESS — BUT ONLY WHILE THIS FLOOR SURVIVES
I am not interested in buying randomly around 4,290.
I would rather see Gold return toward 4,260–4,275.
Why?
Because that gives buyers a simple job:
Defend the order block.
If price trades into this area, rejects it and an H1 candle closes back above 4,275, I would consider the dip successfully defended.
BUY Entry: 4,268–4,278 after H1 rejection/reclaim
Stop Loss: 4,248
TP1: 4,305
TP2: 4,320
TP3: 4,345–4,355
I would not expect a straight-line rally.
4,320 is the first checkpoint.
That is where the post-FOMC recovery has to show that it is more than a temporary bounce.
🧩 4,320 CHANGES THE TYPE OF TRADE
This is where my plan becomes more aggressive.
If Gold reaches 4,320 and gets rejected, I simply keep treating the market as a recovery inside damaged structure.
But if an H1 candle closes above 4,320, something changes.
Buyers would have recovered the upper section of the FOMC breakdown.
I would then wait for a pullback rather than chase the breakout.
Breakout BUY: 4,312–4,322 after successful retest
Stop Loss: 4,292
TP1: 4,350
TP2: 4,365
TP3: 4,395–4,405
The final target matters because 4,402 sits around the larger resistance visible on the chart.
That is where I would expect the next major argument between buyers and sellers.
So my bullish roadmap is simple:
Protect 4,260 → recover 4,320 → attack 4,350 → challenge 4,402.
Each step has to be earned.
🔴 THE SHORT I WANT REQUIRES SOMETHING TO BREAK FIRST
Selling while the order block is still holding does not interest me.
I want sellers to prove that the reaction from 4,235 has failed.
The proof would be an H1 close below 4,258.
Not a wick.
Not a five-minute spike.
A proper H1 close below the order block.
Then I want price to return toward 4,258–4,270 and fail to recover it.
That would turn today's support into resistance.
SELL Entry: 4,258–4,268 after bearish retest
Stop Loss: 4,282
TP1: 4,240
TP2: 4,235
TP3: 4,215–4,220
This setup tells me something very different from a normal pullback:
The FOMC low is no longer being defended.
And once 4,235 breaks on an H1 closing basis, I would stop looking for an immediate bullish recovery.
🎯 THERE IS ALSO A SELL ABOVE CURRENT PRICE
There is one scenario where I do not need the order block to fail.
Gold could rally first.
If buyers push into 4,345–4,360 but cannot hold the move, I will watch closely for an H1 rejection.
A strong upper wick followed by a close back below 4,345 would tell me that yesterday's broken rising structure is still attracting sellers.
Rejection SELL: 4,345–4,355
Stop Loss: 4,370
TP1: 4,320
TP2: 4,290
TP3: 4,265
But there is a strict rule here:
No SELL if Gold closes above 4,365 and holds it on the retest.
At that point, I would rather follow the recovery toward 4,395–4,405.
🧠 IF YOU ARE NEW, READ ONLY THIS PART
You do not need to predict the next 100 dollars.
Let Gold answer four smaller questions:
Does 4,260–4,275 hold?
Then buyers still have a base.
Does 4,320 break and hold?
Then the recovery becomes stronger.
Does 4,345–4,360 reject price?
Then sellers may regain control.
Does 4,258 break and fail on the retest?
Then I switch bearish toward 4,235 and potentially lower.
That is my entire map.
No guessing required.
FOMC damaged the short-term bullish structure.
But it also created a violent rejection from 4,235.
That leaves Gold in an unusual position today:
The old bullish structure is broken, but the bears have not finished the job.
Now 4,260–4,275 becomes the evidence.
If buyers keep it, yesterday's collapse may eventually become the foundation for a larger recovery.
If sellers take it away, 4,235 comes back into play very quickly.
Your call: was the FOMC drop a real breakdown — or just a massive liquidity sweep before Gold goes after 4,400 again? Long 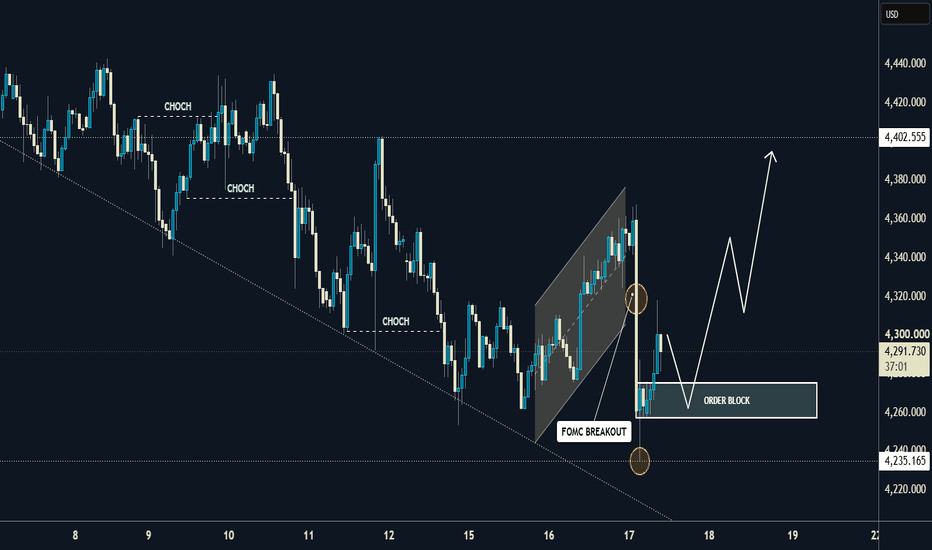
XAUUSD H1: The Floor Has Been Hit. Now Gold Must Prove ItGold has already shown us where buyers care.
The question is whether they care enough.
On the H1 chart, price has repeatedly attacked the 4,253–4,260 area. Each time Gold enters this pocket, selling pressure struggles to continue.
That makes this zone more than ordinary support.
It is where liquidity is concentrated — and right now, it is the most important piece of today's chart.
But there is one thing I do not want to do:
Buy simply because support exists.
Support gives us a location.
Price action gives us the trade.
🧲 THE MAGNET BELOW PRICE
Look at what happened around 4,253–4,260.
Gold traded into this area, bounced aggressively toward 4,360, then came all the way back and tested almost the same floor again.
For a new trader, think of it this way:
Sellers have already pushed on this floor several times.
They still haven't broken it.
That makes another reaction interesting — but also dangerous, because every additional test puts more pressure on the level.
So my first setup requires Gold to show its hand.
If price sweeps 4,253–4,260, returns above approximately 4,269 and produces an H1 bullish reaction, I want the recovery trade.
BUY: 4,265–4,275 after the reclaim
SL: 4,242
TP1: 4,300
TP2: 4,318
TP3: 4,350–4,367
I am deliberately not chasing Gold around 4,290–4,300.
The closer I can enter to the liquidity floor after confirmation, the cleaner the idea becomes.
🎯 4,318 IS WHERE THE EASY PART ENDS
A bounce and a bullish continuation are two different things.
That distinction matters today.
Gold can rebound 30 or 40 dollars from liquidity and still accomplish almost nothing structurally.
For me, 4,318 is the checkpoint.
An H1 close above it changes the conversation.
If Gold breaks 4,318, then pulls back and keeps that level underneath price, I would consider a second long setup rather than waiting for another visit to 4,260.
BUY: 4,315–4,322 on a successful retest
SL: 4,294
TP1: 4,345
TP2: 4,367
TP3: 4,395–4,402
Why 4,367?
Because that is where the next real test begins.
A market can bounce easily.
Reclaiming old territory is harder.
⚠️ THERE ARE TWO DIFFERENT WAYS I WOULD SELL GOLD
This is where today's plan gets interesting.
I don't need Gold to be bearish everywhere to find a short.
SELL #1 — Buyers reach 4,367 and run out of fuel
If the recovery reaches 4,360–4,370, I start watching the H1 candles carefully.
A clear rejection from that area followed by a close back below approximately 4,355 tells me buyers reached the next obstacle but failed to own it.
Then:
SELL: 4,355–4,365 after rejection
SL: 4,378
TP1: 4,330
TP2: 4,318
TP3: 4,280–4,260
This is not a blind limit sell.
No rejection = no entry.
🕳️ SELL #2 — THE FLOOR FINALLY GIVES WAY
This is the scenario dip buyers need to respect.
If an H1 candle closes below 4,253, the same liquidity zone that currently supports the bullish idea becomes a warning.
But I still would not immediately press SELL.
I want Gold to come back toward the broken floor and fail to recover it.
That turns support into resistance.
SELL: 4,250–4,260 after failed reclaim
SL: 4,276
TP1: 4,235
TP2: 4,215
TP3: 4,190
This would also cancel my dip-buying plan.
Once the floor is genuinely broken, I stop asking it to save buyers.
🔓 4,402 WOULD CHANGE THE CHARACTER OF THIS CHART
There is still one level sitting above everything else:
4,402.
Gold previously reacted aggressively from this region.
So reaching 4,402 is one thing.
Living above it is another.
If H1 closes above 4,402 and the following pullback holds approximately 4,390–4,402, I would treat that as a much stronger structural recovery.
My continuation setup becomes:
BUY: 4,395–4,405 after confirmation
SL: 4,375
TP1: 4,425
TP2: 4,443
TP3: 4,465
At that point I would stop treating the move as merely another bounce from liquidity.
Buyers would have reclaimed meaningful H1 territory.
🧠 IF YOU ARE NEW, IGNORE EVERYTHING EXCEPT THIS
Today's chart can be reduced to four decisions:
4,253–4,260 holds → buyers still have a launchpad.
4,318 reclaimed → the bounce gains credibility.
4,367 rejected → sellers may get another opportunity.
4,402 reclaimed → the recovery becomes structurally much more important.
And if 4,253 breaks and fails on the retest, don't keep buying simply because the zone worked before.
Markets don't owe a support level another bounce.
Today I am not choosing between “bullish” and “bearish.”
I am watching who survives the second test of 4,253.
That answer could decide where Gold travels next. Long 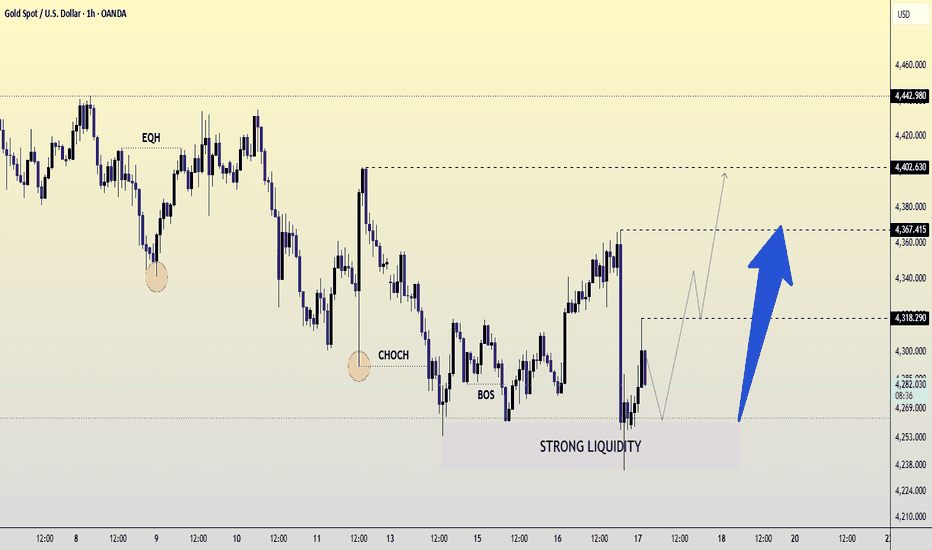
Short 
Trendline Mastery | Price Action Trading StrategyTrendline Mastery | Price Action Trading Strategy
This Trendline Price Action Trading Chart explains how traders understand market movement using trendlines, candlestick behavior, support & resistance, breakouts, retests, and market structure. Every candle has a purpose — it shows the balance between buyers and sellers and helps identify possible continuation or reversal areas.
---
1. Bullish Trendline Candles (Uptrend)
Candle Behavior:
Price creates higher highs and higher lows while respecting an upward trendline.
Reason:
Buyers are consistently defending the trendline support. Each pullback creates an opportunity where demand enters the market.
Trading Lesson:
A valid uptrend continues while candles respect support and maintain higher lows.
---
2. Bearish Trendline Candles (Downtrend)
Candle Behavior:
Price forms lower highs and moves below resistance trendline.
Reason:
Sellers are controlling the market and rejecting higher prices.
Trading Lesson:
Rejection candles near a downward trendline show selling pressure.
---
3. Breakout Candles
Candle Behavior:
A strong candle closes above resistance or below support.
Reason:
Momentum increases as one side takes control and breaks the previous structure.
Trading Lesson:
A breakout candle is stronger when supported by volume and confirmation.
---
4. Retest Candles
Candle Behavior:
After breaking a trendline, price returns to test the broken level.
Reason:
The market checks whether old resistance has become new support or old support has become resistance.
Trading Lesson:
A successful retest can confirm the strength of the breakout.
---
5. Channel Trendline Candles
Candle Behavior:
Price moves between two parallel trendlines.
Reason:
Buyers and sellers are respecting clear boundaries.
Trading Lesson:
Upper channel areas can act as resistance, while lower channel areas can act as support.
---
6. Triangle Pattern Candles
Candle Behavior:
Candles become smaller while highs and lows come closer.
Reason:
Market pressure is building as buyers and sellers wait for a decisive move.
Trading Lesson:
The breakout direction confirms the next momentum phase.
---
7. Support Reaction Candles
Candle Behavior:
Long lower wicks appear near trendline support.
Reason:
Sellers push price down, but buyers absorb the pressure and reject lower levels.
Trading Lesson:
Rejection candles show buyer interest at important zones.
---
8. Resistance Rejection Candles
Candle Behavior:
Long upper wicks appear near resistance.
Reason:
Buyers attempt higher prices, but sellers enter and push price back.
Trading Lesson:
Resistance rejection can signal a possible pullback.
---
9. Confirmation Candles
Candle Behavior:
Strong candles follow the breakout or trendline reaction.
Reason:
The market confirms that momentum is continuing in the chosen direction.
Trading Lesson:
Patience and confirmation reduce emotional trading decisions.
---
Final Trading Lesson
Every candle tells a story:
Large Body Candle → Strong Momentum
Long Wick → Rejection & Liquidity Reaction
Small Candle → Market Indecision
Trendline → Direction & Dynamic Support/Resistance
Breakout → Change in Momentum
Retest → Confirmation Area
Structure → Market Direction
Professional traders do not follow candles blindly. They study the reason behind every candle, the location of the price, and the reaction around important trendlines before making decisions. Education 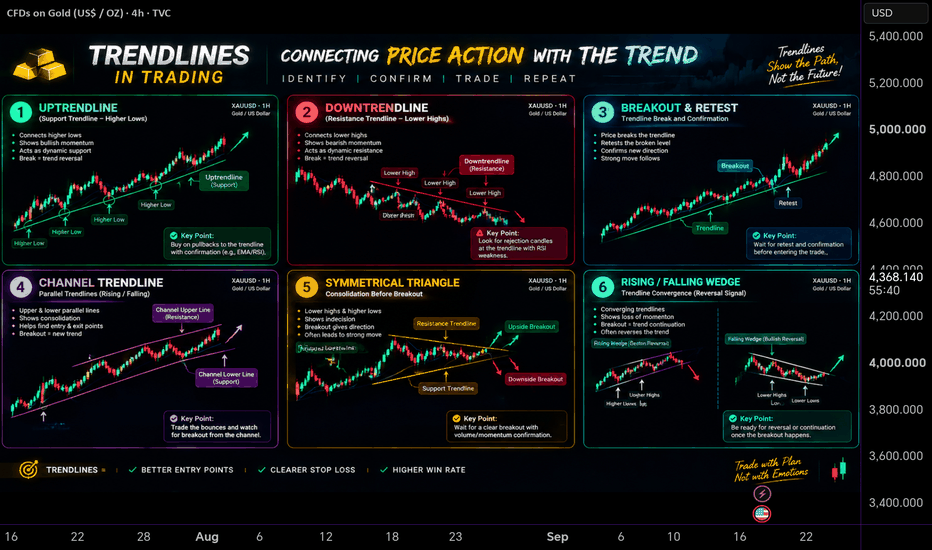
 Long
Long
Short 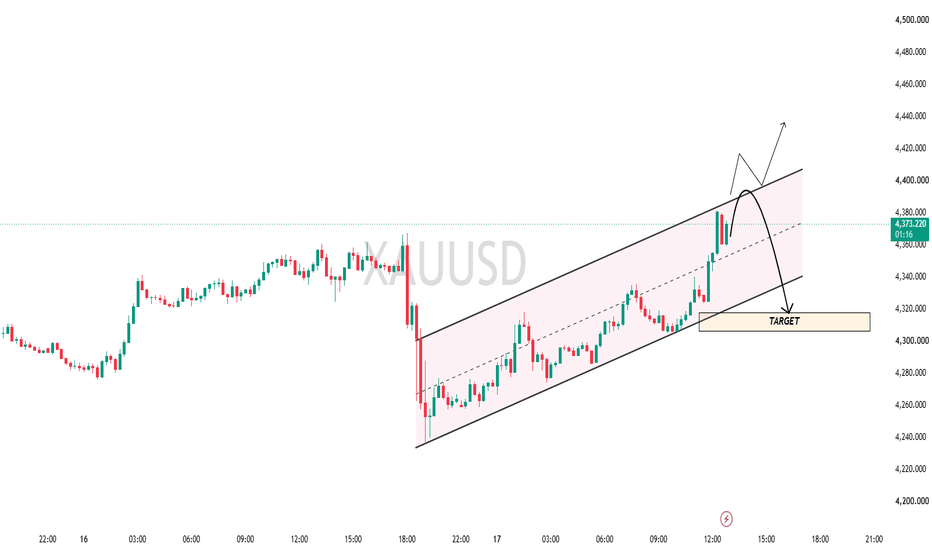
Gold pierced the 61.8% on the Fed move, then reclaimed itYesterday gold fell 132 dollars in four hours. Today it has taken all of it back and more.
The Federal Reserve raised the target range by 25 basis points to 3.75% to 4.00% in a unanimous decision, said inflation remains elevated, and left the door open to more. The candle that opened at 17:00 UTC ran from 4,367.76 down to 4,235.21 and closed at 4,264.19. Since then the market has rallied 138.51 dollars to 4,373.72, and trades at 4,373.19 on the ThinkMarkets feed with the candle still open.
What the low actually touched
The 61.8% retracement of the advance from 3,959.08 to the 24 August record at 4,696.56 sits at 4,240.80. Yesterday's low printed 4,235.21, which is 5.59 dollars beneath it, and the same candle closed at 4,264.19, some 23.39 dollars above it. So the level was breached intrabar and reclaimed by the close, not held untouched.
That is the deepest retracement gold has tested in this decline. The reaction has produced a 138.51 dollar rally from the low, just over three current four-hour ATRs of 44.6 dollars.
The descending boundary still overhead
Draw a line from the 24 August record through the 28 August high at 4,631.54 and every high since has stayed beneath it. It is worth about 4,386 today, roughly 12 dollars above this morning's high at 4,373.72. With two defining anchors it is a reference boundary rather than a multi-touch trendline, and the absence of candles above it supports its relevance without giving it independent tests.
That puts the whole of today's rally inside the zone that decides the structure: 4,367 to 4,390 holds yesterday's pre-decision high at 4,367.76, today's high, the 100 EMA at 4,375.93 and the descending line itself.
The rest of the map
Above that band, 4,402 to 4,435 carries the highs of 10 and 11 September, and 4,443 to 4,511 the highs of early September. Below price, 4,318 to 4,348 holds the 20 EMA at 4,317.78, the 50 EMA at 4,347.04, the 50% retracement at 4,327.82 and the 8 September low. Then 4,274 to 4,292, then 4,235 to 4,255 where the 61.8% and the last two lows sit.
RSI is 57.7 against its own average at 46.1, the highest reading since 10 September. Checked by hand against the last three lows, 4,291.96, 4,253.75 and 4,235.21, both price and momentum made lower lows, so there was no divergence at the bottom. Average true range is 44.6 dollars, which makes today's 138 dollar move slightly more than three average candles.
Scenarios
● Bullish: A four-hour close above 4,390 clears the 4,367 to 4,390 zone and the descending reference boundary together, the first improvement in the short-term structure since 24 August. The range high at 4,402.32 remains the next structural test, and a close above it would put 4,402 to 4,435 fully in play, with 4,443 to 4,511 beyond.
● Bearish: A four-hour close below 4,348 loses the upper edge of the first support zone and the 50 EMA, weakening the rebound. A close below the 50% retracement at 4,327.82 adds confirmation, and a break beneath roughly 4,317.7 clears the rest of the zone and the 20 EMA, exposing 4,274 to 4,292 and then 4,235 to 4,255.
● No confirmation: Four-hour closes between 4,348 and 4,390 leave gold without a confirmed break. Closes between 4,348 and 4,367 keep price below the resistance zone while the rebound holds above first support, and closes inside 4,367 to 4,390 are a test of the decision zone rather than a break through it.
What this tells us
A level that gets pierced and recovered in the same candle is more informative than one that is respected to the dollar. The 61.8% was breached by 5.59 and reclaimed by 23.39 on the close, which shows demand appeared quickly after the break and was strong enough to take the level back within the same four hours.
The harder question is overhead, and it has two parts. Clearing 4,390 would break the resistance zone and the boundary; the range high at 4,402.32 is a separate test after it. So: does this rally clear the first, and then the second?
Any opinions, news, research, analyses, prices or other information contained on this website is provided as general market commentary and does not constitute investment advice. ThinkMarkets will not accept liability for any loss or damage including, without limitation, to any loss of profit which may arise directly or indirectly from use of or reliance on such information.
Long 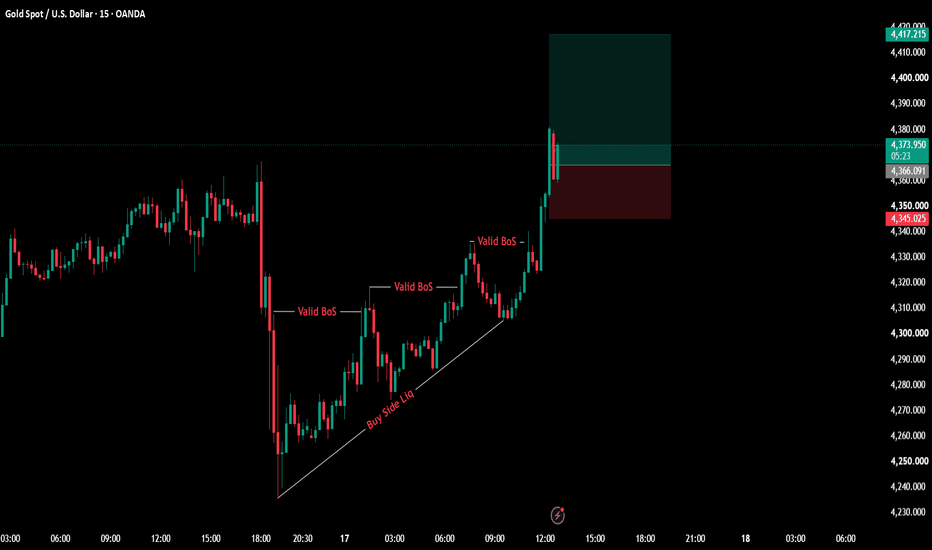
WTI: Oil Rally Tests the $104.30 Breakout ZoneWTI is trading near $103.40 after another push toward the $104.30 resistance. The move is still driven by two forces: Middle East supply risk today and tomorrow’s EIA inventory data.
The news background remains supportive. Reports of regional supply and shipping risks are keeping a geopolitical premium in oil. When traders see risk to export routes, pipelines or tanker traffic, oil can rise before the disruption fully appears in inventories.
Tomorrow’s EIA report is the next test. After the previous crude draw of -0.391M barrels, another draw would support the bullish story and could help buyers break $104.30. A surprise inventory build may trigger profit-taking after the sharp rally.
Technically, the 4H chart remains bullish. WTI is above EMA 9, SMA 50, EMA 200 and SMA 200. RSI near 65 shows strong momentum, but price is now testing an important resistance area rather than a fresh support zone.
Scenario: a clean 4H close above $104.30 may open the way toward $105.50 and $108.00. If price rejects from $104.30, the first pullback zone is around $101.50, followed by $97.23.
Key idea: WTI is still supported by supply-risk premium, but $104.30 is the breakout test. EIA data tomorrow may decide whether the rally extends or cools.
⚠️ Not financial advice.  Long
Long