Short
Short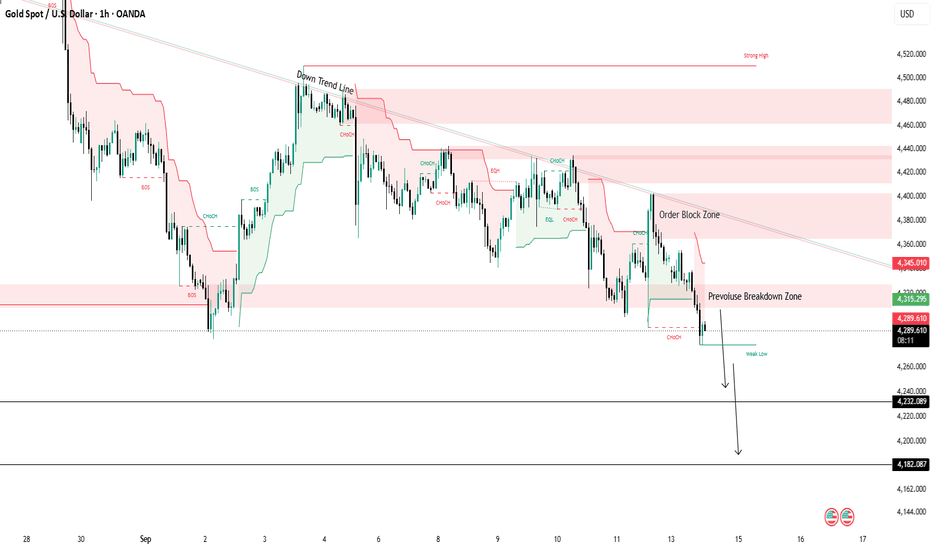
XAUUSD — Internal Supply Sell Before FOMC
Gold is trading around $4,326 after a corrective recovery from the recent sell-side liquidity sweep. Despite the bounce, H1 price remains beneath the descending HTF trendline, and the broader sequence of lower highs continues to favor bearish delivery.
Macro risk is concentrated around today’s FOMC decision. Markets are pricing roughly a 92% probability of at least a 25 bp Fed hike, while the U.S. dollar remains near multi-week highs. Gold has recovered modestly ahead of the announcement, but a hawkish Fed message could reinforce yield pressure on the metal.
Oil has eased after an unexpected rise in U.S. inventories, although Brent remains above $100 and Middle East supply disruptions continue to keep inflation risk elevated.
SMC View
The H1 structure remains bearish below dynamic supply. The recent bullish MSS explains the current corrective repricing, but it has not yet broken the broader bearish structure.
Price is now moving back toward the $4,395-$4,405 Internal Supply area. This is the nearest mitigation zone and the main location where sellers may attempt to regain control.
The $4,385–$4,405 Premium Bearish OB remains the higher resistance zone if FOMC volatility drives a deeper liquidity sweep.
Main Trading Scenario
Sell Priority: $4,395-4,405
Condition: Wait for price to retrace into Internal Supply and show bearish rejection, failed acceptance above the zone, or a lower-timeframe bearish MSS/CHOCH.
Entry: $4,395-4,405 after confirmation
SL: Above $4,355 and the rejection structure
TP1: $4,280–$4,295
TP2: $4,252–$4,268
Key Zones to Watch
$4,395-$4,405 — Premium Bearish OB
$4,330–$4,345 — Main Internal Supply
$4,283–$4,318 — FVG / mitigation area
$4,252–$4,268 — Internal SSL
HTF descending trendline — Dynamic resistance
Above $4,355 — Immediate sell setup weakens
Prime Gold View
The sell bias remains favored while Gold stays beneath Internal Supply and the HTF bearish trendline.
A confirmed rejection from $4,395-$4,405 could reopen delivery toward the exposed sell-side liquidity below. With the FOMC decision approaching, sharp two-sided liquidity sweeps are possible, so the reaction after mitigation matters more than anticipating the first move.
No confirmation, no trade. Long 
Short 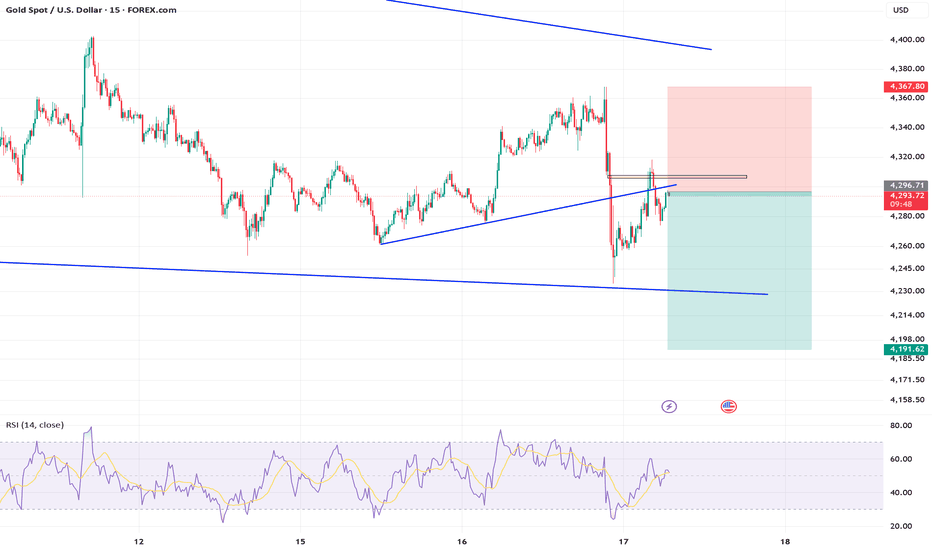
Gold – Bearish Zig-Zag Correction Setup
The chart shows a clear sequence of lower highs and lower lows after the major peak near 4,680, indicating that the short-term trend has turned bearish. The repeated zig-zag structure suggests that each recovery is being followed by another sharp decline, with the latest rebound reaching around 4,370 before facing rejection. If this structure continues, the current leg could develop into another sharp fall, with the projected move reaching around 3,950–4,000 levels. A sustained move above the recent swing high near 4,370–4,400 would weaken this bearish structure and require reassessment of the setup. The overall chart structure currently supports the possibility of another downward leg.
Idea Rating: 8.5/10
Disclaimer: This is a technical-analysis idea for educational purposes only and is not financial or investment advice. The projected path and target are possible scenarios, not guaranteed outcomes. Please do your own analysis and use appropriate risk management before making any trading decision.
Short 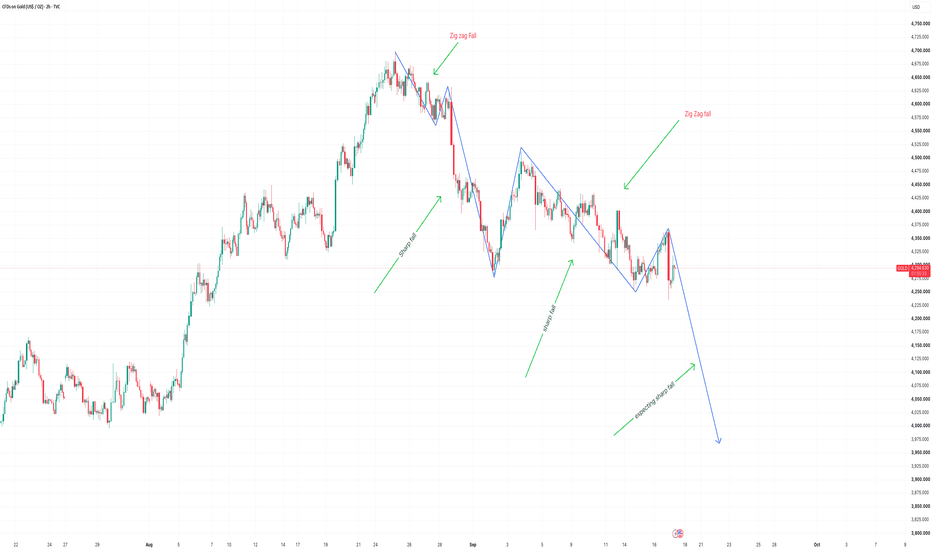
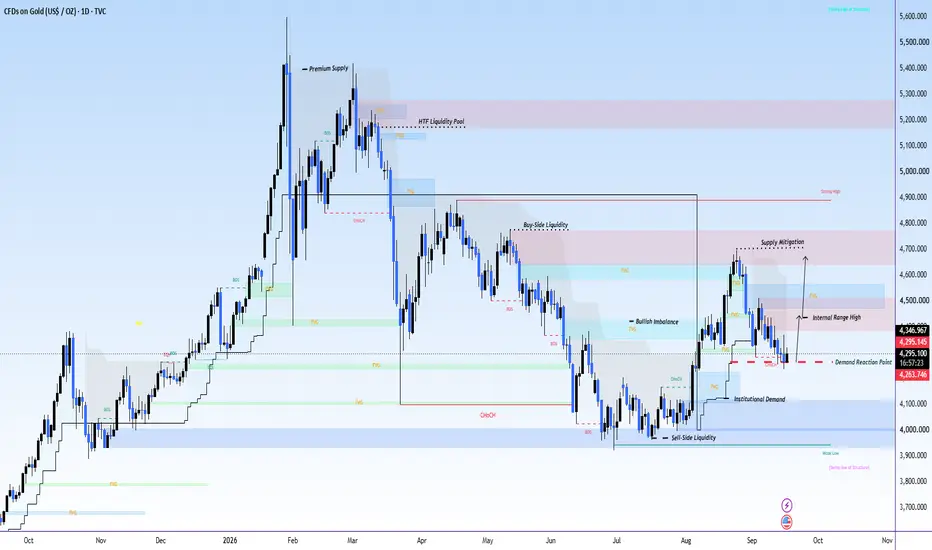
GOLD Daily| SMC Institutional Demand Mitigation& setup ExpansionGOLD Daily | Smart Money Concepts (SMC) Institutional Demand Mitigation & setup Expansion
1. Premium Supply Distribution & Macro Highs (~5,400+)
Price reached the macro higher-timeframe Premium Supply zone, leaving dramatic upper rejection wicks followed by strong bearish displacement candles.
Reason: Institutional sellers absorbed lingering buyer momentum at peak liquidity, initiating macro distribution and marking the top of the overall market structure.
2. bearish-Side Liquidity (SSL) Run into Institutional Demand (~3,950 – 4,000)
Extended downside expansion candles swept clean bearish-Side Liquidity (SSL) beneath key historical swing lows, driving price straight into the primary blue Institutional Demand block.
Reason: Smart money engineered a liquidity raid to trigger retail opposite side, gathering high-volume discount orders required for large-scale position accumulation.
3. Impulsive Bullish Displacement & Imbalance Creation (~4,100 – 4,500)
Consecutive long-bodied green expansion candles broke internal market structure to the upside (CHoCH/BOS), leaving wide Bullish Imbalance (FVG) pockets in their wake.
Reason: Aggressive institutional buying shifted market character, creating price inefficiencies and establishing buyer dominance across key timeframes.
4. Supply Mitigation & Local Retracement (~4,700 down to 4,293.359)
After hitting the upper Supply Mitigation block near 4,700, price printed a corrective sequence of lower-high and lower-low candles down to the Demand / Reaction Point (~4,293.359).
Reason: Market participants took profit near local supply, forcing a controlled pullback into discount FVG/demand zones to re-mitigate open bullish orders.
5. Current Demand Defense & Bullish Expansion Path (Arrow Path)
Recent candles show buyer absorption at current demand, projecting an upward run targeting the Internal Range High and higher supply levels.
Reason: Defense of key discount demand maintains the overall bullish structure, clearing path for bullish-side liquidity runs at overhead resistance. Long 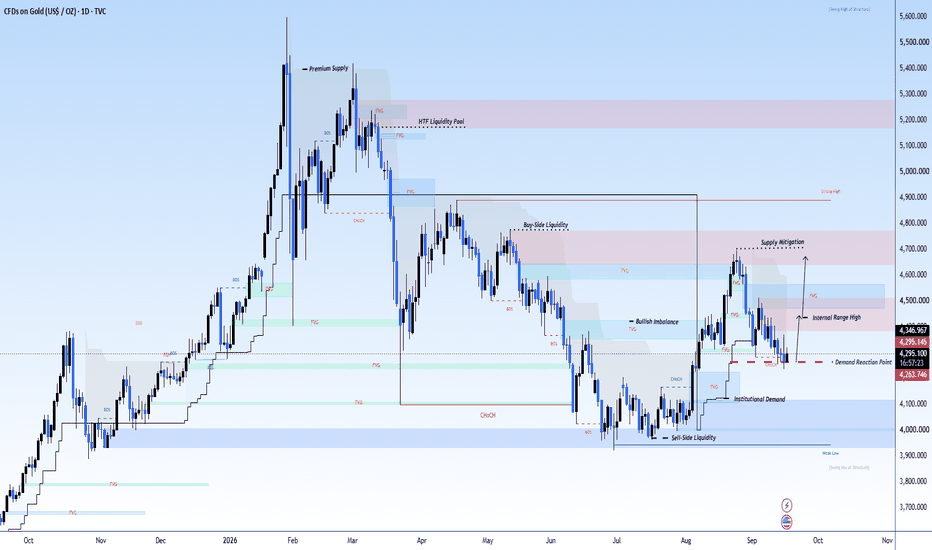
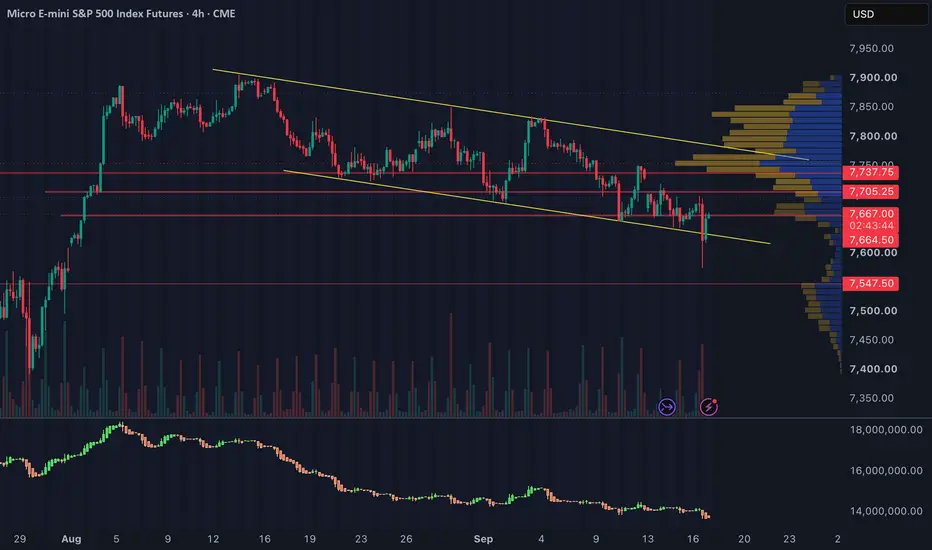
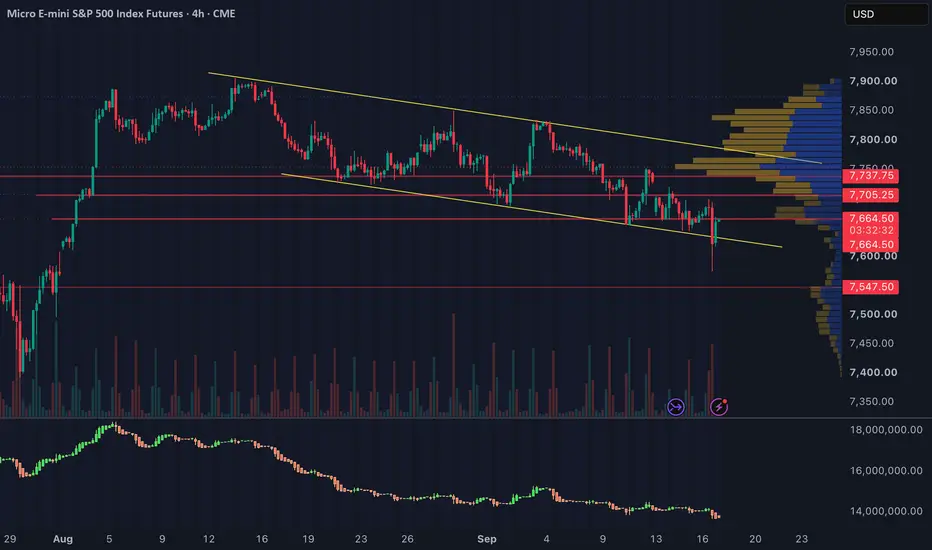
09/17/26 Ideas1. Preferred Short: Upper Repair-Band Failure
Location: 7,685–7,707.75
Setup: SR-with-retest progressing into Combination Confirmation
Ideal sequence:
MES trades into 7,685–7,707.75.
Buyers fail to establish acceptance.
Price breaks back below 7,685.
The recovery attempt into 7,685 fails.
Enter only after the failed reclaim, not on the initial touch.
This is the cleanest short location because it allows the post-FOMC rebound to reach meaningful resistance before asking sellers to prove themselves.
Targets: 7,666.50 → 7,655.75 → 7,634
Structural invalidation: Acceptance above 7,707.75, especially with broad improvement.
2. Nearer Short: Decision-Zone Failure
Location: 7,666.50–7,685
Setup: Combination Confirmation
Ideal sequence:
MES rejects 7,666.50–7,685.
Price loses 7,655.75.
The retest of 7,655.75–7,666.50 fails from underneath.
Sellers then receive permission to target 7,634.
This is valid but slightly less attractive than the higher short because current price is already inside this decision area. We need separation from the zone before entering.
Targets: 7,634 → 7,578.50
Invalidation: Recovery and sustained acceptance above 7,685.
3. Best Continuation Short
Location: Below 7,634
Setup: Break & Retest
Ideal sequence:
MES breaks 7,634 decisively.
Do not chase the first flush.
Price returns to 7,634 from below.
The level rejects the reclaim.
Enter on renewed downside expansion.
Targets: Post-FOMC low/approximately 7,600 → 7,578.50
Invalidation: Reclaim and sustained hold above 7,634.
This becomes much stronger if volatility firms and breadth deteriorates during the retest.
4. Best Bullish Repair Setup
Location: Above 7,685
Setup: Break & Retest long
Ideal sequence:
MES accepts above 7,685, not merely wicks through it.
Price pulls back into 7,666.50–7,685.
Buyers defend the former resistance zone.
Price expands away from the retest.
Targets: 7,707.75 → 7,728.50 → 7,740.25
Invalidation: Loss of 7,666.50, with a deeper failure below 7,655.75.
This is the setup that would challenge the tactical risk-off thesis. We should not remain married to the short if the repair receives broad confirmation.
5. Failed-Breakdown Reversal
Location: 7,634
Setup: Breakdown failure + reclaim/retest
Ideal sequence:
MES breaks beneath 7,634.
Volatility and breadth fail to confirm.
Price quickly reclaims 7,634.
A retest holds above it.
That would suggest sellers could not produce acceptance below the breakdown level.
Targets: 7,655.75 → 7,666.50 → 7,685
Invalidation: Renewed acceptance below 7,634. Gold Pre-FOMC: 4,260 Sweep Before 4,370?
Market Overview
• Macro Driver: Spot Gold hovers near $4,313 on Wednesday, September 16, 2026, as global markets brace for today's pivotal FOMC Interest Rate Decision and the release of the updated Summary of Economic Projections (SEP / Dot Plot). While policy rates are widely projected to remain steady at 3.50%–3.75%, institutional desks are hyper-focused on Fed Chair Kevin Warsh's forward guidance regarding persistent underlying inflation and balance sheet velocity.
• Market Condition: Institutional order flow reflects a classic pre-FOMC volatility compression. After absorbing sell-side liquidity at the 4,260 Demand Zone, smart money is coiling price within a tight range between the 4,260 base and 4,320 Resistance Zone, preparing for an aggressive post-announcement directional expansion toward overhead channel resistance.
Technical Context
• Structure: Re-Accumulation within Bearish Descending Channel. On the 1H timeframe, Gold remains bound beneath the multi-week descending trendline from the 4,511.089 Strong High. Following multiple CHoCH and BOS downside sweeps, price printed a double-bottom absorption at the Demand Zone (4,260 – 4,275).
• Liquidity & Imbalance: Price delivery shows immediate rejection at the 4,310–4,320 Resistance Zone (current market price: 4,313.03). The technical roadmap anticipates a shallow corrective retest into the 4,260–4,275 Demand Zone to engineer final buy-side liquidity, followed by an impulsive breakout push piercing through 4,320 to target the Intermediate Supply Block (4,350 – 4,370) and test the descending channel ceiling.
Key Zones
• Macro Structural Ceiling (Strong High): 4,511.08
• Upper Supply Block: 4,420.000 – 4,435.000
• Intermediate Supply Target (Blue Box): 4,350.00 – 4,370.00
• Immediate Overhead Resistance Zone (Grey Box): 4,310.00 – 4,322.00
• Current Market Price: 4,313.03
• Structural Demand Zone Base (Grey Box): 4,260.00 – 4,275.00
Trading Plan (IF–THEN)
• IF price delivers a corrective liquidity tap into the 4,260 – 4,275 Demand Zone AND validates lower-timeframe (M5/M15) bullish displacement/CHoCH -> THEN look to execute Long positions targeting 4,315, expanding through 4,322 directly toward the 4,350.00 – 4,370.00 Intermediate Supply / trendline ceiling.
• IF price confirms a decisive 1H close below 4,250 during the FOMC rate release -> THEN the demand accumulation thesis is invalidated, unlocking a deeper sell-side flush toward 4,220.
MMFLOW View
• Bias: Pre-News Accumulation / Post-FOMC Bullish Expansion. Fading the range midpoint at 4,313 ahead of the Fed rate decision presents poor risk-to-reward; our mathematical edge favors buying verified liquidity defenses at the 4,260–4,275 demand floor to ride the expansion wave into descending channel resistance. Long 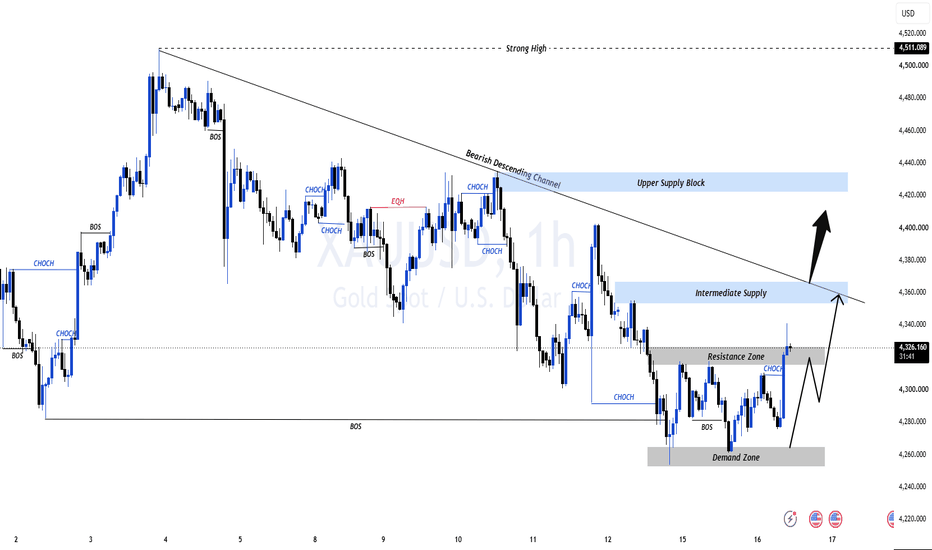
Gold Week 38/2026: Gold ETFs Push Back Against Rising RatesGold Week 38/2026: Stuck as Gold ETFs Push Back Against Rising Rates
Two days before the Fed meeting, the world's largest gold fund bought another 2.86 tonnes.
Let me say that again: bought more, right before a meeting the whole market had already priced at a 92% chance of a rate hike. A rate hike is the thing gold fears most, because gold pays no interest. And yet the money kept coming in.
That is the detail I have thought about most in week 38, more than the Fed decision itself.
🏛️ The Fed hiked, but gold did not break down
Early Thursday morning Vietnam time, the Fed raised rates to 3.75% to 4.00%, a 25 basis point hike. The first increase since July 2023. The vote was 12 to 0, not a single dissent.
The projections that came with it were tougher than the decision itself. The median rate for end 2026 is 4.10%, which implies at least one more hike across the two meetings left. The Fed raised its inflation forecast to 3.70% while cutting its unemployment forecast to 4.10%. Put plainly, they still have room to tighten, and they intend to use it.
The US 10 year yield touched 5.01%, the highest since 2007. Chairman Kevin Warsh said at the press conference that the Fed cannot affect any individual price, but it will stop that change from broadening into second and third order effects. In plain language: the Fed knows a rate hike does not produce a single extra barrel of oil, it is hiking to protect its credibility.
With that much bad news, gold should have broken down. On 16 September the price spiked to 4,367 then fell straight to 4,235, a 132 dollar range in one session. But it still closed at 4,280, and this morning it is trading around 4,299.
No breakdown. No return to the 39xx area. Every drop has been bought back quickly.
💰 The flows are what matter
I pulled the fund numbers to check. From 31 August to 16 September, gold lost $233.84 an ounce. Over the same stretch the fund's holdings rose from 1,042.36 tonnes to 1,050.28 tonnes, almost 8 tonnes more.
Price falling, fund accumulating. Those two things happened at the same time, and not by accident.
Wider still, World Gold Council data shows global gold ETFs took in $17.86 billion in August alone. The full year to 11 September is $33.20 billion. So a single month of August is worth more than half of the entire year.
This is not fast money chasing headlines. This is long term allocation, and it does not reprice because of one meeting.
I think this point matters more than any resistance line drawn on a chart. Trading against flows that size is an expensive habit.
🇯🇵 There is still one more meeting to come
The BoJ meets on Friday morning. A Bloomberg survey has 52 out of 52 economists expecting Japan to raise rates from 1.00% to 1.25%.
This is where it gets interesting. If the BoJ hikes and pairs it with a tone tougher than the Fed's, the rate gap between the US and Japan narrows, the yen strengthens and the dollar softens. A softer dollar gives gold room to breathe.
The BoE reports tonight as well. UK labour data on Tuesday afternoon was ugly: the claimant count rose by 27.8 thousand against a forecast of only 8.3 thousand, and it had been falling the month before. Inflation says hike, jobs say stop.
Three major central banks deciding across three consecutive days. Flows cannot reprice all of that in a single night. They need time to redistribute. That is why I am not drawing conclusions from the market's first reaction.
📊 Where gold is stuck
On the 1 hour chart, gold sits at 4,299, hugging the 10 EMA at 4,294, with RSI around 47.8. No clear momentum either way.
The short term resistance zone I have marked is 4,413 to 4,455. It lines up with the 0.382 Fibonacci level at 4,413.68 of the decline from the 4,695 high to the 3,958 low, and it also lines up with the area that has capped price several times in September.
The short term support zone is 4,169 to 4,229. The 0.618 Fibonacci sits at 4,239.62, just above the top of that zone. The low of the Fed session on 16 September was 4,235, which means price tagged the edge of the zone and bounced straight back.
The rising trendline drawn from the July low has been broken, so I no longer treat this as one continuous uptrend.
My forecast is that gold stays stuck between 4,169 and 4,455 until a daily candle closes decisively outside the range.
🎯 What I am thinking
I am not betting on either side of the meeting. I wait for the reaction first.
For the 4,169 to 4,229 support zone, I treat it as an area to watch for a chance to trade with the direction the money is moving, not an area to catch a falling knife. The condition is that price has to show it is stopping right there, not simply touching it.
For the 4,413 to 4,455 resistance zone, I treat it as a place to trim a position if I am holding, not a place to short just because the chart has a horizontal line there.
Sellers need to be very careful here. Yields at a nineteen year high, the dollar recovering and printing a short term top, the Fed just hiked and is threatening more. And gold still refuses to break down. When bad news stops pushing price any lower, it is usually because someone is buying underneath. The fund numbers above show there really is someone there.
⚠️ What would prove me wrong
The scenario that most clearly proves me wrong is oil cooling off.
This whole inflation story rests on the oil price. Saudi Arabia's East-West pipeline was hit by drones on 11 September and has been shut since, pushing oil up almost 24% in a month. If the repair is as quick as the US Energy Department says, a matter of days, then oil falls, inflation cools and the Fed has its excuse to stop. The story changes completely at that point.
The second scenario is the BoJ hiking but signalling softly. The dollar holds its strength and gold loses the support it was getting from the currency side.
And if price closes a daily candle below 4,169, I drop the entire range scenario above. The next area below is the 0.786 Fibonacci at 4,115.
This is my personal view, not a recommendation to buy or sell. Your money, your decision.
---
P/S: Don't forget to leave a Like and ask anything you'd like to discuss to trade better every day!
Follow tohaitrieu on TradingView to stay connected for the long haul, and talk through each trade together. I believe sharing and discussion help us learn more, and make every analysis and every comment on TradingView more useful for everyone ⚡️ XAUUSD: First Fed Hike in 3 Years — Can Daily Support Hold?📊 Market Context
The Fed just delivered its first rate hike since 2023 — 25bp to 3.75%–4%, unanimous 12-0. Chair Kevin Warsh made the message unmistakable: inflation has been "too high for too long." The statement dropped references to temporary energy shocks, placed the burden squarely on monetary policy, and signaled one more hike may be coming this year. Middle East tensions were explicitly cited as a contributing factor.
For gold, the macro read is straightforwardly bearish: higher real yields, a stronger dollar, rising opportunity costs for a non-yielding asset.
Yet XAUUSD TVC:GOLD is sitting at 4,282 — right on a daily support zone that has been holding. This is a decision zone, not a breakdown zone.
📉 Technical Structure
Price has pulled back sharply from the 4,697 swing high, printing lower highs and lower lows. Multiple moving averages sit overhead. The short-term trend is under pressure.
Key levels:
Resistance: 4,315–4,331 (MA cluster) → 4,350–4,371 (recovery zone) → 4,408–4,415 (major resistance) → 4,434–4,510 → 4,697 (swing high)
Support: 4,276–4,282 (current) → 4,252 → 4,100 → 3,942 (higher-timeframe)
🎯 Core Thesis
Below 4,350–4,371, the bias stays bearish. The cleanest setup is a short on a rejection into that zone — look for a bearish rejection candle, a lower high, and failure to reclaim 4,315–4,331. Confirmation from a stronger dollar or rising Treasury yields would add weight.
Bearish targets: 4,252 → 4,100 → 3,942 (extended if macro pressure accelerates).
A daily close below 4,276 would confirm the support has failed and sellers remain in control.
⚠️ Risk View
But support hasn't broken yet. If 4,276–4,282 holds and price reclaims 4,315–4,331, a relief rebound is live — especially if the dollar fades, yields retreat, or the hike was already fully priced in. A sustained break above 4,350–4,371 would be the first real sign the bearish structure is cracking. Above 4,415, the bearish thesis is invalidated.
🔑 Conclusion
The FOMC created a fundamentally bearish setup for gold — higher rates, elevated real yields, potential dollar strength. But price is testing daily support, not breaking it.
My read: below 4,350–4,371, stay bearish. Watch 4,276–4,282 for the next move — a break below opens 4,252 and 4,100; a hold and reclaim of 4,331 shifts the tone.
I'm tracking the dollar and Treasury yields alongside price for confirmation of the next XAUUSD move.
Trade gold and major stock indices through Bitget CFD, including XAUUSD, the Dow Jones, S&P 500 and Nasdaq — and stay prepared for opportunities created by FOMC, CPI, nonfarm payrolls and Treasury-yield volatility.
⚠️ Risk warning
CFDs are leveraged derivatives and can result in rapid losses. Losses may exceed your initial margin. This analysis is for educational and informational purposes only and does not constitute financial advice. Always manage your leverage, position size and risk before trading.
XAUUSD H1: Gold Just Escaped. 4,400 Is Waiting UpstairsForget yesterday’s bearish structure for a moment.
Something changed.
Gold spent nearly three days doing almost nothing between 4,270 and 4,312. Every attempt higher was pushed back. Every bounce looked temporary.
Then one H1 candle erased that patience.
Price ripped through the range ceiling and landed around 4,335.
So I am not interested in asking:
“Is Gold bullish or bearish?”
That question is too early.
There is a better one:
Was that candle an escape — or bait?
🚪 4,324 IS THE DOOR GOLD JUST KICKED OPEN
The breakout point is more useful to me than the breakout candle itself.
That point sits around 4,324.
If Gold comes back here, slows down, tests the area and refuses to trade below it, then buyers have done something meaningful:
They have turned yesterday’s ceiling into today’s floor.
I would trade that.
4,325–4,333 → BUY
Protection: 4,309
First cash-out: 4,365
Main destination: 4,395–4,405
I do not need another huge green candle.
Actually, I would rather see Gold pull back first.
A calm retest gives me a much cleaner trade than buying after a vertical move.
🧱 THEN GOLD WALKS INTO THE WRONG NEIGHBORHOOD
There is a problem waiting roughly $60 higher.
4,395–4,405.
Look left.
That box is not randomly drawn on the chart.
It is the area from which sellers previously managed to push Gold away, and now the breakout path points almost directly back toward it.
This creates an unusual situation:
I can be bullish at 4,330 and bearish at 4,400 on the same day.
There is no contradiction.
Location changes the trade.
If Gold reaches 4,395–4,405 and buyers begin getting rejected on H1, I switch sides.
4,395–4,405 → SELL after rejection
Protection: 4,420
First target: 4,365
Second target: 4,348
Final target: 4,325
No rejection?
No short.
I would rather miss the top than stand in front of a breakout that is still accelerating.
🪤 NOW FOR THE SETUP THAT COULD HURT LATE BUYERS
Suppose Gold does exactly what breakout traders want.
It trades above 4,324.
People buy.
Then price suddenly closes an H1 candle back underneath 4,324.
That would immediately make today's move suspicious.
I call this the “return ticket.”
Gold escaped the range…
…and then came straight back.
If that happens, I would wait for a failed attempt to recover 4,324 and use it as my short trigger.
4,316–4,324 → SELL
SL: 4,343
TP1: 4,292
TP2: 4,272
TP3: 4,255
Notice what I am not doing:
I am not selling because Gold “looks overbought.”
I am selling because the market would have failed to keep territory it just broke.
That is a completely different reason.
🧨 AND IF 4,405 BREAKS?
Then I throw the previous script away.
Seriously.
An H1 close above 4,405, followed by a retest that stays above approximately 4,395, would mean sellers failed at the exact location where they were supposed to appear.
That failure is information.
I would then look for:
BUY: 4,398–4,408 after the hold
SL: 4,380
TP1: 4,430
TP2: 4,465
TP3: 4,490–4,500
At that stage, I would no longer describe Gold as simply bouncing from 4,255.
The H1 structure would be attempting something much bigger.
♟️ MY BOARD FOR TODAY
I only need to remember two numbers:
4,324 tells me whether the breakout deserves trust.
4,405 tells me whether the old bearish story still deserves respect.
Everything between them is the battlefield.
So if Gold pulls back to 4,324, I watch buyers.
If Gold reaches 4,400, I watch sellers.
If 4,324 collapses, I follow price back downstairs.
If 4,405 collapses, I follow price upstairs.
Simple.
Yesterday, sellers had the chart.
Today, buyers have stolen the first move.
Now we find out whether they stole the trend too. Long 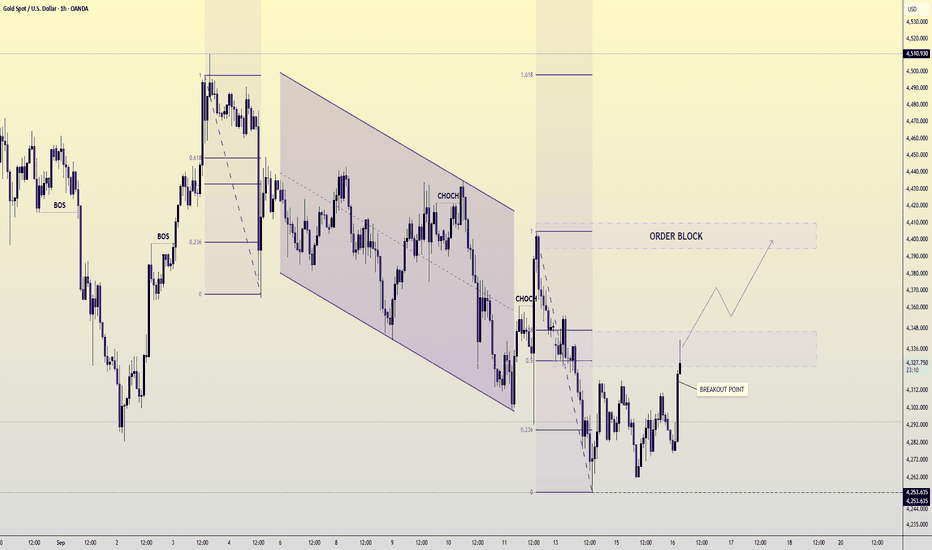
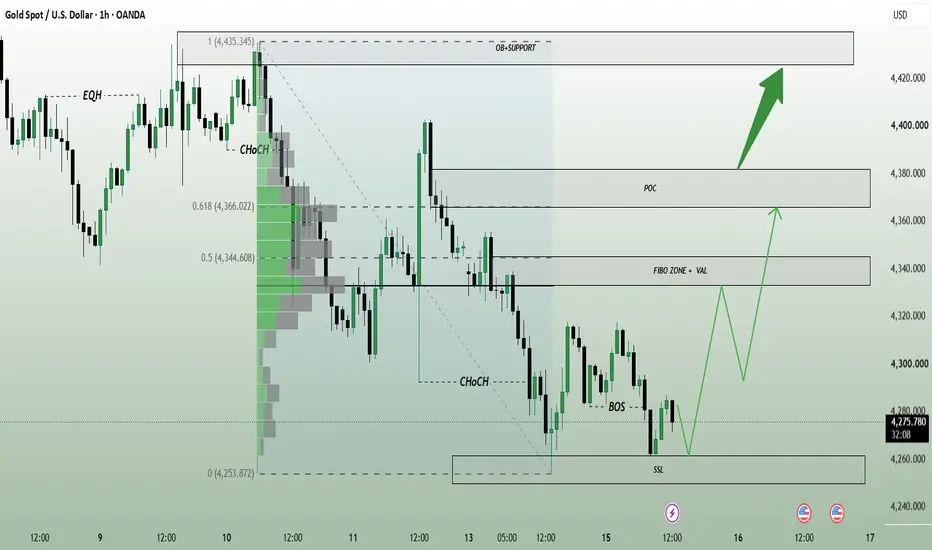
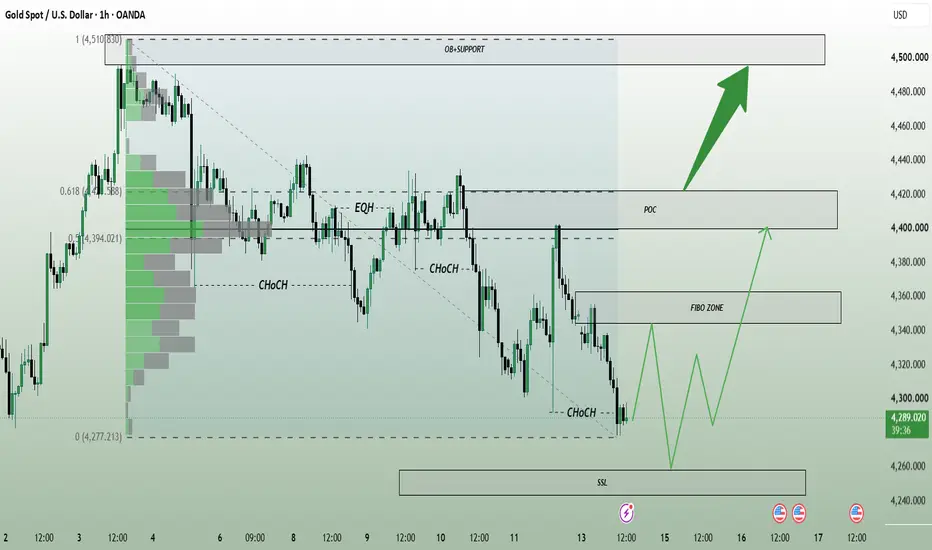
SSL Sweep Before Recovery WaveSSL Sweep Before Recovery Wave
Fundamental Analysis
Gold remains under pressure ahead of the September 16 Fed decision. Markets are pricing roughly a 94% chance of a 25 bp rate hike, while the U.S. 10-year yield has climbed above 5% and oil near $108 is reinforcing inflation concerns. These conditions continue to support the dollar and limit Gold’s recovery for now.
Technical Analysis
On H1, Gold remains in a bearish structure after the latest CHoCH and BOS, with price now near 4,284.
The key area is the 4,252–4,262 SSL. A final liquidity sweep into this zone could complete the bearish wave and create a cleaner base for recovery.
If buyers confirm from SSL, the first upside reaction area is the 4,332–4,346 Fibo Zone + VAL, followed by the 4,366–4,382 POC.
Important Key Levels
4,425–4,438 — OB + Support / Major Resistance
4,366–4,382 — POC
4,332–4,346 — Fibo Zone + VAL
4,252–4,262 — SSL / Main Liquidity
Trading Scenario
Buy priority comes only after a sweep into 4,252–4,262 followed by bullish H1 confirmation.
Target: 4,332–4,346 first, then 4,366–4,382.
Invalidation: H1 acceptance below the SSL zone.
Overall View
The H1 trend is still bearish, so buying early is less attractive. The cleaner setup is to let Gold take lower liquidity first, then watch for a confirmed recovery toward the Fibo Zone and POC.
Will Gold sweep the SSL before starting the next recovery wave? Long 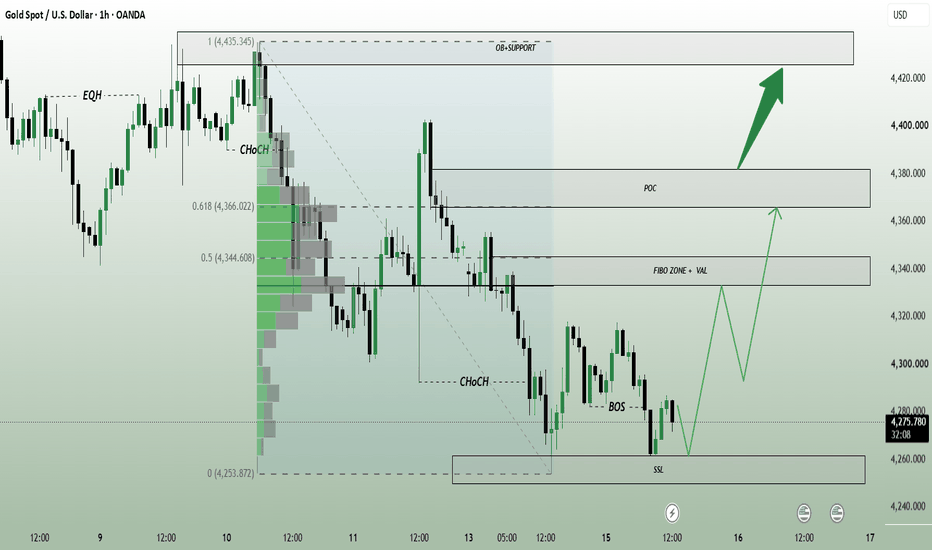
 Long
Long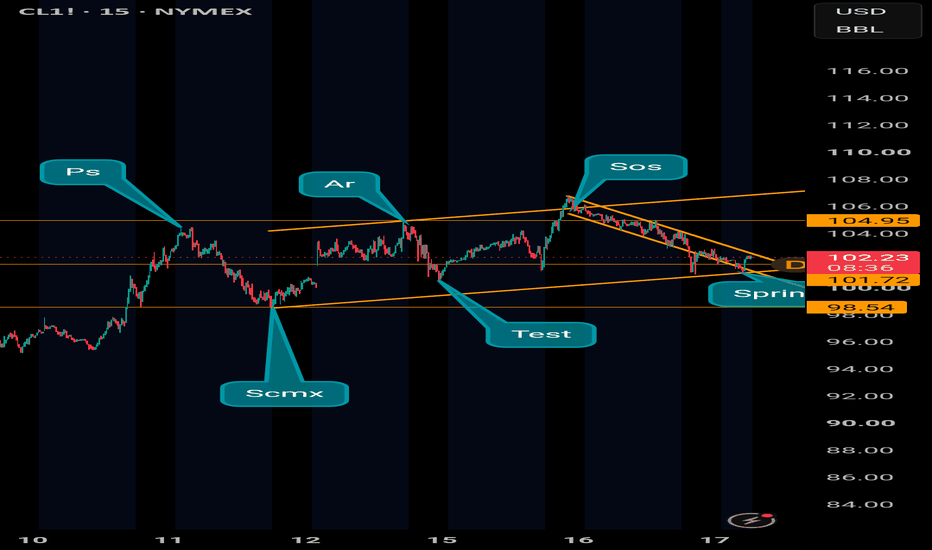
Post-FOMC Repricing Keeps MES in Tactical Risk-Off Post-FOMC Repricing Keeps MES in Tactical Risk-Off — Repair Rally Reaches Its First Test
Market Regime: Tactical Risk-Off / Hawkish Post-FOMC Price Discovery
Systemic Stress: Not confirmed
Confidence: High
Wednesday’s FOMC meeting produced a unanimous 25-basis-point rate increase, lifting the target range to 3.75%–4.00%. Policymakers’ projections also left another increase possible before year-end.
The market’s initial response was a sharp downside repricing followed by a meaningful after-hours recovery. That rebound has improved the immediate tape, but it has not repaired the broader structure.
MES is now pushing directly into its first major resistance area. Thursday’s question is whether buyers can convert the rebound into genuine acceptance—or whether former support becomes resistance again.
Index Structure and Breadth
SPY reacted cleanly around the 765, 761 and 757 areas, confirming that the market continues to respect established technical levels despite the FOMC volatility.
The broader structure remains mixed:
MES is trading below most of last week’s range.
RSP and SPY are approximately flat to slightly higher compared with similar levels from last week.
RSP is holding a major HVN/LVN decision area, but only narrowly.
RSP/SPY remains near an important support zone.
RTY and YM weakened materially.
ADD and VOLD finished negative, although not at capitulation readings.
Short- and intermediate-term S5 breadth gauges deteriorated sharply.
This is weak participation, but not yet an indiscriminate market breakdown. A decisive loss of the RSP HVN alongside further deterioration in RSP/SPY would provide much broader confirmation of downside continuation.
Volatility
Volatility delivered one of the session’s clearest warnings.
VIX strengthened, VIX1D was highly elevated around the event, and the front of the VX curve finished nearly flat—with VX1 and VX2 separated by very little.
That reflects strong immediate demand for protection. However, some of that demand may have been specific to the FOMC event.
Thursday’s confirmation test is whether volatility remains firm after the catalyst passes. If equities stabilize and VIX1D rapidly fades, the repair can continue. If MES rejects resistance while VIX and the front of the VX curve remain elevated, the bearish structure receives stronger confirmation.
Rates, Dollar and Inflation Pressure
The Treasury curve remains normally upward sloping, with the 30-year yield still the highest:
2-year: approximately 4.72%
5-year: approximately 4.85%
10-year: approximately 4.99%
30-year: approximately 5.33%
The concern is not curve inversion. It is the absolute level of rates and the continued weakness in longer-duration Treasuries.
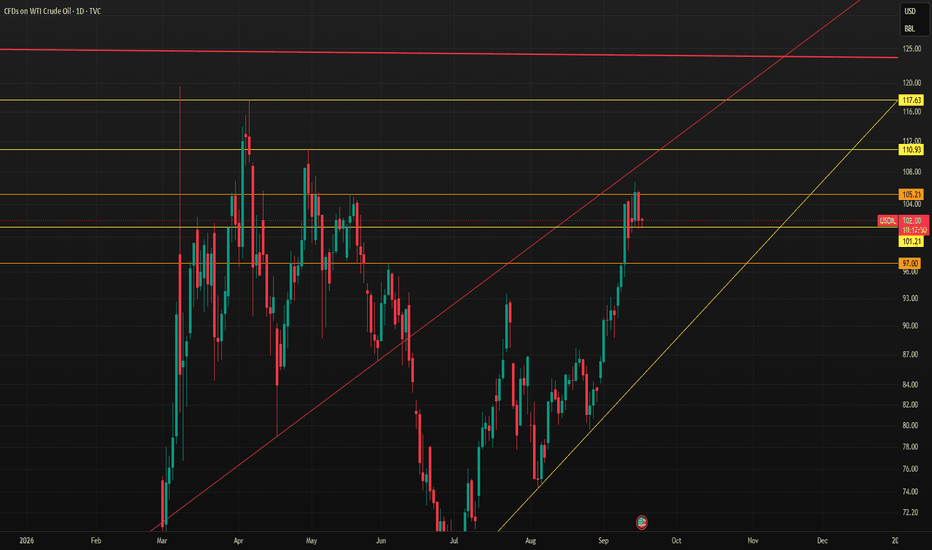
DXY is simultaneously testing the major 100 level, while crude oil remains elevated around $102. Sustained dollar strength, long-end pressure and high oil prices would represent a difficult combination for equities by tightening financial conditions and keeping inflation concerns alive.
Leadership and Sector Structure
Leadership remains fragmented rather than completely abandoned.
Areas showing the greatest weakness include:
XLF and KRE, with regional banks remaining particularly vulnerable.
XLY, which continues to trade in a weak structure.
MSFT and AMZN after losing important support.
NVDA, which has not repaired its break below the major rising trendline.
Small caps and the Dow following their post-FOMC breakdowns.
Relative strength remains concentrated in selected names:
AAPL and META continue to act as relative leaders.
AMD and SMH showed better relative strength.
ORCL is attempting to stabilize.
AVGO and MU remain less convincing.
Semiconductors are mixed, and isolated megacap strength is not enough to establish a broad risk-on regime.
Credit, Funding and Futures Basis
Credit and funding remain the primary counterevidence against a systemic-stress call:
HYG/LQD softened but remained inside its established range.
Overnight reverse-repo usage remains minimal.
The Treasury General Account declined, providing a modest liquidity tailwind.
There is no confirmed transmission from equity weakness into credit disorder.
The displayed 3.90% IORB versus 3.63% EFFR and 3.64% SOFR primarily reflects a timing mismatch. IORB changes immediately with the new policy decision, while EFFR and SOFR remain backward-looking fixings until the next publication.
The sharp expansion in the December ES–SPX basis is worth monitoring, but higher policy rates mechanically increase futures carrying value. Without simultaneous funding or credit deterioration, the move currently resembles post-FOMC carry and roll repricing more than a market-plumbing failure.
Key MES Levels
Support:
7,628.50 — immediate downside decision level
Approximately 7,600 — major psychological and structural support
7,554.00 — next important lower shelf
Resistance:
7,660.75–7,680.75 — immediate repair and rejection zone
7,691.75–7,700.00 — stronger balance and acceptance test
7,716.25–7,724.25 — broader bullish structural repair
Thursday’s Primary Question
Can MES accept above 7,660–7,680 and then clear 7,700 with improving breadth, financials, semiconductors and declining volatility?
If yes, Wednesday’s FOMC breakdown may continue repairing.
If MES pushes into 7,660–7,680 or 7,692–7,700 and rejects while DXY holds near 100, volatility remains firm and banks continue weakening, that would create a strong SR rejection or Combination setup.
If MES instead loses 7,628.50 and accepts below 7,600, the path toward 7,554 becomes increasingly relevant.
For now, the after-hours move is a repair rally—not confirmation that the tactical risk-off regime has ended. Gold is back above 4,300 — but the real test is still ahead.
XAUUSD has delivered a strong M30 recovery from the 4,260–4,280 area, pushing back toward the descending trendline and the 4,340 resistance.
This creates a critical FOMC-day decision zone.
M30 Market Structure
Current: 4,327.225
Decision Zone: 4,335–4,345
Reaction Zone: 4,315–4,325
Liquidity / Demand: 4,275–4,285
Major Supply: 4,395–4,405
The short-term momentum is bullish, but the broader M30 structure remains capped by the descending trendline.
Bullish Scenario
If M30 closes above 4,340 and holds the 4,315–4,325 retest:
4,340 → 4,360 → 4,395–4,405
A clean breakout could turn the current descending trendline into support.
Bearish Scenario
But if Gold sweeps 4,340 and quickly falls back below:
4,340 → 4,315 → 4,285
A break below 4,275–4,285 would invalidate the current recovery structure.
FOMC Catalyst
The Fed decision arrives today, with markets pricing roughly 92% probability of a 25bp hike. August CPI remained elevated at 3.4% YoY, while Treasury yields are around 5% and oil remains above $100.
That means volatility could expand sharply around the decision and guidance.
Is 4,340 the breakout trigger — or the liquidity trap before 4,280? Long 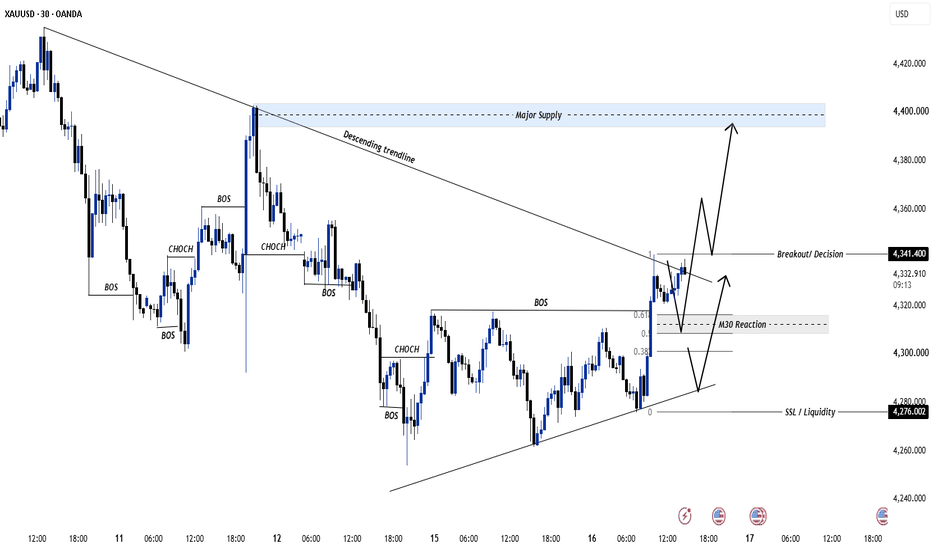
XAUUSD — Bullish Recovery After the PullbackMarket Pulse
Gold is recovering ahead of the Fed decision as the U.S. dollar, Treasury yields and oil prices ease.
A 25 bp rate hike is largely expected, so the bigger reaction may come from the Fed’s guidance. This could keep Gold volatile around the announcement.
What the Chart Says
XAUUSD is showing a stronger short-term recovery on H1.
Price has climbed from the 4,270 area and is now holding around 4,340, after breaking back above previous short-term structure.
The nearest support sits around 4,330–4,340. If this area holds, buyers may try to continue the recovery.
The next resistance is around 4,345–4,355. A clean move above this zone could open the way toward the stronger 4,395–4,405 resistance area.
A deeper pullback could still reach 4,300–4,320, which remains the stronger demand zone below.
Levels That Matter
4,395–4,405 — Main upside resistance
4,345–4,355 — First resistance
4,330–4,340 — Near-term support
4,300–4,320 — Main demand zone
4,270–4,280 — Recent swing support
My Main Plan
The main plan is bullish.
I prefer waiting for price to hold above 4,330–4,340 or make a controlled pullback toward 4,300–4,320.
If buyers return with clear confirmation, Gold could first challenge 4,345–4,355.
A clean breakout above that area may extend the recovery toward 4,395–4,405.
What I Need to See
I want to see the current recovery keep forming higher lows and price hold above the marked support structure.
A sustained H1 move below 4,300 would weaken the immediate bullish setup.
Final Read
The short-term H1 picture is improving, but Gold is approaching resistance just before the Fed decision.
For now, I prefer waiting for a pullback and bullish confirmation rather than chasing the move higher, with 4,395–4,405 remaining the main recovery target. Long 
XAUUSD — Bullish Retest Ahead of the FedFundamental Analysis
Gold is recovering ahead of today’s Fed decision as the U.S. dollar softens, Treasury yields retreat and oil prices ease. Markets currently price roughly a 92%–93% probability of a 25 bp hike, which would lift the target range to 3.75%–4.00%. With the hike largely priced in, the bigger reaction may come from the Fed’s guidance and outlook for further tightening.
Brent has eased toward $108 as Saudi Arabia offers additional crude via Oman and U.S. inventories rise, temporarily reducing some inflation pressure.
Technical Analysis
On H1, XAUUSD is trading near 4,348 after a strong rebound from the 4,268–4,280 demand area.
Price is now testing the descending resistance trendline and the 4,341–4,353 Fibonacci 0.786–0.618 zone. This area is the key short-term decision point.
If buyers defend the zone and price confirms a breakout/reclaim above the trendline, the next objectives sit near 4,368, followed by 4,378–4,394.
The 4,327 structure low remains the critical bullish invalidation level.
Important Key Levels
4,378–4,394 — Main target zone
4,368 — Intermediate resistance
4,341–4,353 — Main buy zone
4,327 — Key support / invalidation
4,295–4,315 — Deeper demand
Trading Scenario
Main Buy Setup
Entry: 4,341–4,353
Stop Loss: 4,324
Take Profit 1: 4,368
Take Profit 2: 4,378
Take Profit 3: 4,390–4,394
Buy Condition
Wait for the 4,341–4,353 zone to hold with bullish confirmation. A liquidity sweep, bullish engulfing candle, strong H1 reclaim, or confirmed break above the descending trendline would strengthen the setup.
A sustained H1 break below 4,327 invalidates the immediate bullish scenario.
Overall View
The short-term H1 structure is shifting toward recovery, but price is still confronting the major descending trendline. The preferred plan is to buy only after confirmation around 4,341–4,353, targeting 4,368 and 4,378–4,394.
With the Fed hike largely priced in, forward guidance may matter more than the rate decision itself for the next major Gold move.
Will Gold hold 4,341–4,353 and break the trendline before the Fed decision? Long 
Long 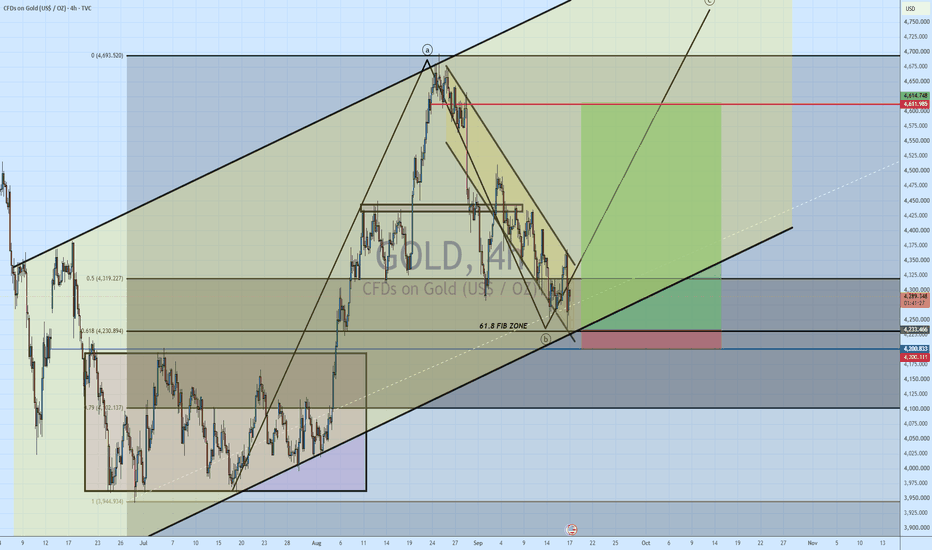
XAUUSD: Buyers Fired the First Shot. Now Comes the Hard PartYesterday, Gold did almost nothing.
Today, it finally did something worth watching.
After spending hours trapped inside the 4,260–4,315 accumulation box, XAUUSD has produced a strong bullish H1 candle and pushed through the top of that range.
That is the first positive signal buyers have shown in a while.
But there is a problem.
The breakout happened at the bottom of the battlefield.
Most of the resistance is still above us.
So today I am not treating Gold as simply “bullish” or “bearish.” I am watching whether buyers can turn this first punch into an actual change in H1 structure.
THE THREE DOORS ABOVE PRICE
Instead of filling the chart with dozens of levels, I only need three.
Door #1 — 4,337
This is the first test.
Gold is currently around 4,325, so buyers are already approaching it. Breaking 4,337 would tell me today's bullish candle has follow-through rather than being just a temporary spike out of yesterday's range.
Door #2 — 4,355
This one matters more.
The 4,337–4,355 area is where I expect the first serious fight between buyers and sellers.
If Gold can close above 4,355 and then defend it, the recovery has room to become much larger.
And then we reach the difficult part.
Door #3 — 4,385–4,405
This is the H1 order block marked on my chart.
It also sits close to major dynamic resistance, which makes this the area where I expect sellers to make their strongest stand.
For me, 4,405 is the level that separates a recovery from a potential H1 reversal.
🟢 MY FIRST BUY DOES NOT START AT 4,325
The large green candle looks attractive.
I don't want to chase it.
My preferred BUY requires Gold to clear 4,355 first.
I want to see an H1 candle close above 4,355 and then a pullback into the breakout area without immediately falling back underneath it.
If buyers defend that retest, I have my confirmation.
BUY Entry: 4,348–4,358 after H1 breakout + retest
Stop Loss: 4,328
TP1: 4,385
TP2: 4,400–4,405
TP3: 4,450–4,460
There is a reason TP1 and TP2 are relatively close together.
The order block at 4,385–4,405 is not an area where I want to assume buyers will simply walk through.
I would rather take profit into resistance and let the market prove the rest.
⚡ BUT 4,405 UNLOCKS A DIFFERENT TRADE
This is where today's chart becomes interesting.
Imagine Gold reaches the order block, sellers react, but price refuses to fall.
Then an H1 candle closes above 4,405.
That changes the game.
I would wait for Gold to revisit approximately 4,390–4,405. If the former resistance becomes support, I would consider a second BUY.
Breakout BUY Entry: 4,395–4,405 after successful retest
Stop Loss: 4,375
TP1: 4,440
TP2: 4,460
TP3: 4,475–4,485
That final zone is the larger target already visible on the chart.
In simple terms:
4,355 opens the road.
4,405 opens the highway.
🔴 THE SELL IS HIDING ABOVE, NOT HERE
I don't like selling directly into today's bullish impulse around 4,320.
If I want to sell, I would rather let buyers bring Gold into resistance first.
The area I want is 4,385–4,405.
If price enters that order block and an H1 candle shows a clear rejection — especially a long upper wick followed by a bearish close back below 4,385 — that tells me sellers are still defending the broader bearish structure.
That becomes my short setup.
SELL Entry: 4,382–4,392 after confirmed H1 rejection
Stop Loss: 4,412
TP1: 4,355
TP2: 4,337
TP3: 4,300
I would not short this setup if Gold has already established an H1 close above 4,405.
At that point, the reason for selling has disappeared.
🚨 THERE IS ONE FAILURE I WOULD NOT IGNORE
There is also a scenario where Gold never reaches the order block.
Today's breakout could fail.
If price loses 4,300 again and an H1 candle closes back inside yesterday's accumulation range, today's bullish move starts looking like a false breakout.
I would then watch a retest of 4,300–4,310 from below.
Failure there gives me another SELL.
Failed-breakout SELL: 4,300–4,310
Stop Loss: 4,325
TP1: 4,280
TP2: 4,260
TP3: 4,240
This setup is completely different from selling the order block.
One says:
“Buyers reached resistance and lost.”
The other says:
“Buyers never had a real breakout in the first place.”
That distinction matters.
THE NUMBER I WILL WATCH TODAY
Forget ten indicators for a moment.
If you are new to trading, watch what Gold does around these numbers:
Above 4,355 → buyers earn access to 4,385–4,405.
Rejected from 4,385–4,405 → sellers can send price back toward 4,355 / 4,337 / 4,300.
Above 4,405 and holding → the path toward 4,440–4,485 becomes much cleaner.
Back below 4,300 → today's breakout is in trouble.
Yesterday, Gold was building energy.
Today, that energy has finally been released.
Now the interesting question is no longer whether Gold can bounce.
It is whether buyers can survive what is waiting above them.
If you had to choose only one today: rejection from 4,400 or breakout toward 4,480? Long 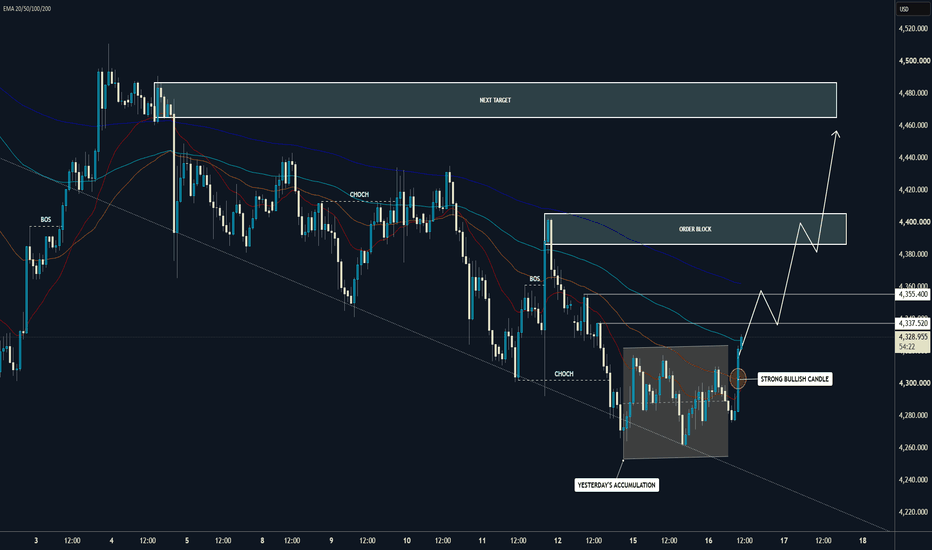
 Long
Long
SSL Sweep Before RecoveryFundamental Analysis
Gold remains under pressure ahead of the Fed meeting on September 15–16. Markets are pricing roughly an 89% probability of a 25 bp rate hike, while the U.S. dollar has reached a one-week high and the 10-year Treasury yield is near 5%. Brent above $107 is also keeping inflation concerns elevated. Middle East tensions still provide some safe-haven support, but the macro environment remains difficult for Gold in the short term.
Technical Analysis
On H1, Gold remains in a bearish structure after repeated CHoCH signals and lower lows.
Price is now trading near 4,296, close to the previous low around 4,277. The next important area is the 4,245–4,260 SSL, where a final liquidity sweep could complete the current bearish wave.
If buyers react strongly there, Gold may recover toward the 4,340–4,360 Fibo Zone, followed by the 4,400–4,420 POC.
Important Key Levels
4,490–4,510 — OB + Support / Major Resistance
4,400–4,420 — POC
4,340–4,360 — Fibo Zone
4,245–4,260 — SSL / Main Liquidity
Trading Scenario
Buy priority comes only after a sweep into 4,245–4,260 followed by bullish H1 confirmation.
Target: 4,340–4,360 first, then 4,400–4,420.
Invalidation: H1 acceptance below the SSL zone.
Overall View
The H1 structure remains bearish, so buying early is less attractive. The cleaner setup is to wait for lower liquidity to be taken before looking for a recovery wave.
Will Gold sweep the SSL first before recovering toward 4,400? Long 
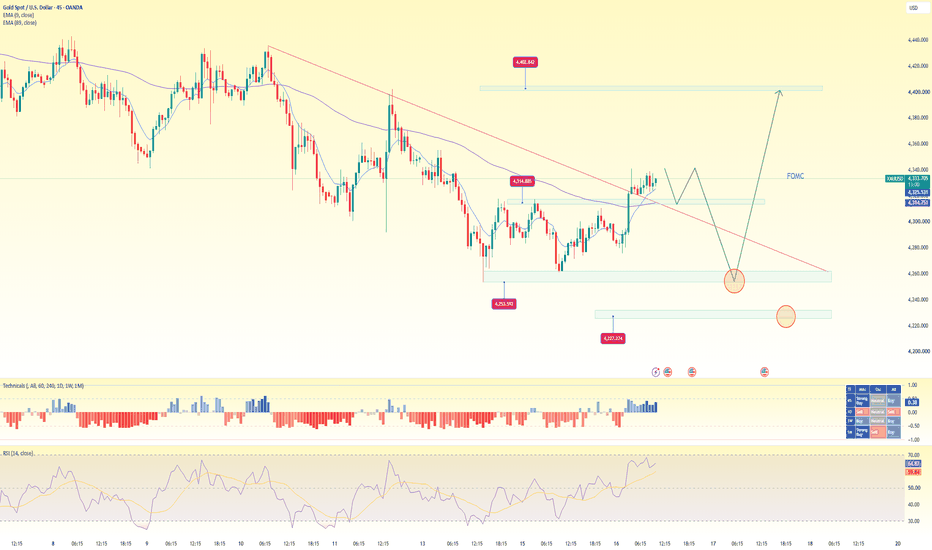
Gold prices await FOMC – interest rate hike expected.1. 📊 Market Structure
Bias: Bullish Recovery – Short-Term Bullish
Gold is trading around 4,330, showing a clear recovery from the 4,260–4,280 demand area.
EMA 9: 4,324.8
EMA 89: 4,314.7
EMA 9 > EMA 89 → bullish short-term momentum.
Price is holding above both EMAs, indicating that buyers have regained control.
RSI(14): ~63 → bullish momentum, but not yet deeply overbought.
The previous bearish structure is being challenged as price attempts to break above the descending trendline.
🔴 2. Key Resistance
4,335–4,345 → immediate resistance / descending trendline zone
4,400–4,405 → major resistance and breakout target
A confirmed break and H1 close above 4,345 would strengthen the bullish recovery and potentially open the way toward 4,400–4,405.
However, rejection around the trendline could trigger a short-term pullback.
🟢 3. Key Support
4,305–4,315 → EMA 89 / immediate support
4,255–4,265 → major demand zone
4,225–4,230 → deeper support
As long as 4,305–4,315 holds, the short-term bullish structure remains valid.
A deeper pullback toward 4,255–4,265 could provide another potential buyer reaction, as indicated on the chart.
-------------
BUY GOLD zone : 4225 - 4220
SL : 4215
TP : 4240 - 4266 - 4280 Short