Long
Long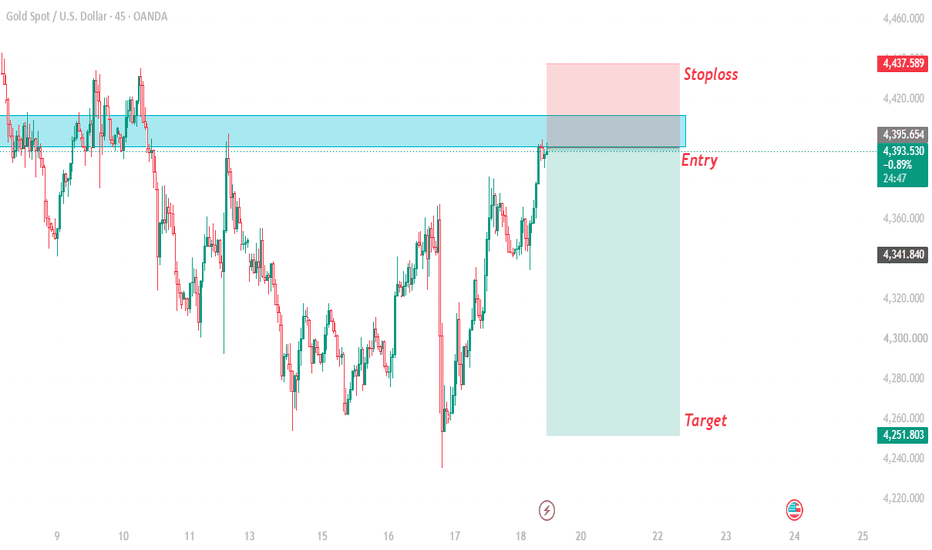
CLARITY FAILED: who benefits, what happens now? The U.S. Senate failed to advance the CLARITY Act.
The vote was 50–49 , short of the 60 votes required. The bill was designed to create a federal market-structure framework for digital assets, including clearer boundaries between the SEC and CFTC and rules for exchanges and other market participants.
So, does crypto actually need CLARITY?
Crypto can continue without it. The bigger issue is the rules governing the market around it.
Who benefits from the failure?
There is no single winner, but the vote exposed a major conflict between traditional banking and crypto.
Banks have argued that stablecoin rewards could pull deposits away from traditional banks. Deposits are an important source of bank funding, so banks pushed for restrictions on rewards that function economically like interest on deposits. The latest CLARITY draft included a mechanism allowing the Treasury to intervene if stablecoins caused substantial deposit outflows from community banks, but banking groups argued that this did not go far enough.
Crypto companies, meanwhile, have argued that restricting stablecoin rewards could reduce competition and innovation.
That makes the dispute bigger than crypto regulation.
It is also a competition over where money sits inside the financial system.
For retail traders and investors, the problem is different.
The failure leaves the U.S. without the comprehensive congressional market-structure framework CLARITY was intended to establish. Participants therefore continue operating under existing securities and commodities laws, agency interpretations and rulemaking rather than one comprehensive statutory framework.
That does not mean retail traders are automatically being “exploited.”
It means they remain exposed to a market where regulatory obligations, disclosures, investor protections and the treatment of different crypto activities can vary depending on the asset and intermediary.
What happens now?
Regulation does not stop because CLARITY stalled.
The SEC and CFTC already issued a joint interpretation in March clarifying how federal securities and commodities laws apply to different categories of crypto assets and activities, including digital commodities, stablecoins, staking, airdrops and wrapping.
And the SEC has continued moving independently. On September 17, it announced a five-year exemption framework for certain platforms trading tokenized stocks, showing that blockchain-market regulation can continue even without comprehensive legislation.
For traders, this distinction matters:
The CLARITY vote is not a fundamental change to Bitcoin. It is a regulatory event.
Bitcoin's network continues to operate. Exchanges continue operating. Institutions continue entering the market. But the long-term U.S. rules governing digital-asset markets remain unsettled.
Congress can still revisit market-structure legislation, while the SEC and CFTC continue developing the framework through their existing authorities.
What Did Bitcoin Do?
Bitcoin initially reacted negatively.
As it became clear that CLARITY would not advance, BTC fell sharply, dropping more than 5% during the September 15 session. Crypto-related equities and several altcoins experienced even larger declines.
But the reaction did not remain one-directional.
Bitcoin subsequently stabilized and recovered from the initial sell-off, trading around the mid-$76,000 area on September 16–17.
That price action is important.
The market clearly reacted to the legislation, but Bitcoin's recovery suggests the failed vote was not being treated as a change to Bitcoin's underlying network or existing regulatory status.
The bigger uncertainty sits around the broader crypto market: exchanges, stablecoins, token issuers, intermediaries and assets whose regulatory classification remains less settled.
In other words, CLARITY matters to the structure around Bitcoin more than to Bitcoin's ability to function.
For traders, that distinction matters. A sharp initial reaction does not automatically mean a lasting fundamental change. The recovery shows why the vote should be viewed alongside liquidity, rates, Treasury yields, ETF flows and broader risk appetite rather than in isolation.
Key Insight
CLARITY was never about whether crypto survives. It was about who regulates it, how crypto competes with traditional finance, how intermediaries operate, and how predictable the rules become for market participants.
The market can function without CLARITY.
The question is how long the world's largest financial market operates without a comprehensive statutory framework for digital assets.
put together by : Pako Phutietsile as @currencynerd
Education 
Long 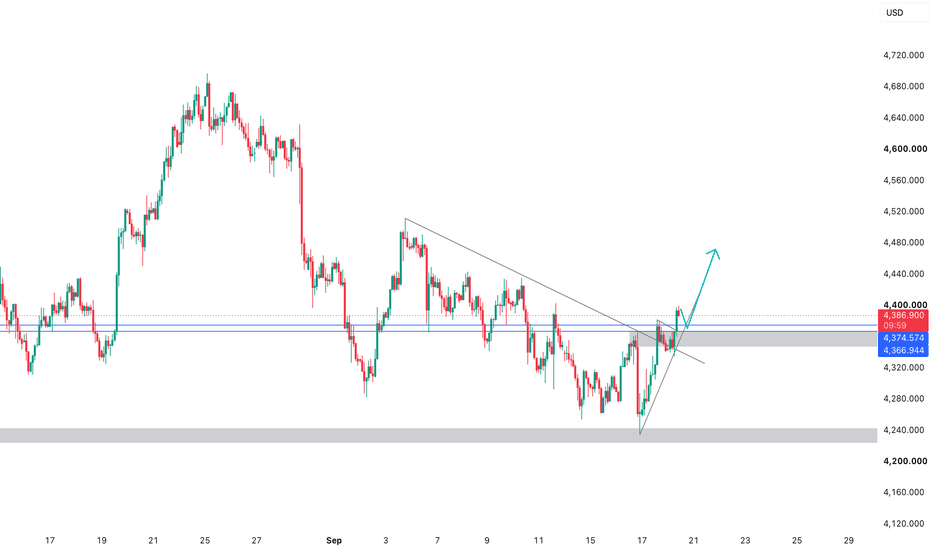
Long 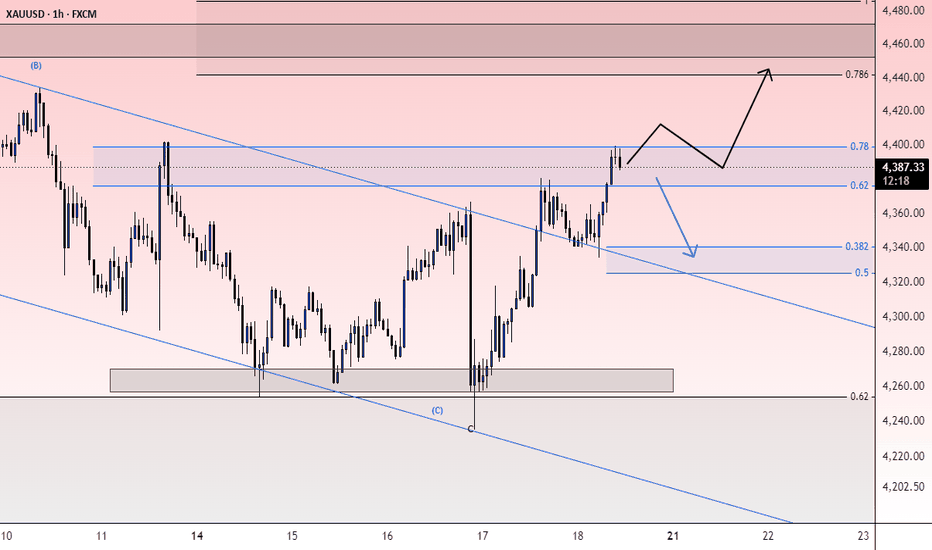
Long 
Long 
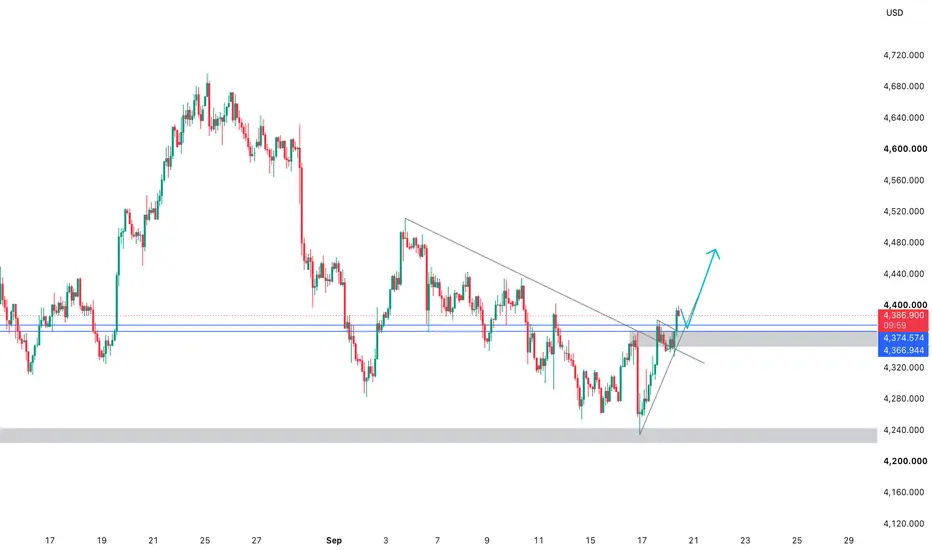
XAUUSD Reclaims 4,400 After the Fed Selloff - Can Buyers Hold ?Gold has staged a strong rebound after Wednesday's sharp post-Fed decline, recovering from the 4,240 area and pushing back toward/above 4,400. The recovery is constructive, but this remains an important decision area rather than a confirmed return to the broader uptrend.
DIRECTIONAL BIAS
Short-term: cautiously bullish while price holds above 4,350-4,370.
Broader confirmation: buyers still need sustained acceptance above 4,400-4,405 to strengthen the recovery structure.
KEY LEVELS
Resistance: 4,400-4,405 immediate breakout/acceptance zone; 4,430-4,450 next resistance area; 4,480 higher recovery objective if momentum expands.
Support: 4,350-4,370 first important support on a pullback; 4,300-4,320 key structural support; 4,260-4,280 major downside area if sellers regain control; 4,240 this week's post-Fed low region.
BULLISH SCENARIO
If Gold can establish acceptance above 4,400 rather than simply wick through it, the rebound can extend toward 4,430-4,450. A clean break and hold above that area would improve the structure further and expose the 4,480 region.
BEARISH SCENARIO
Failure to hold above 4,400 followed by a loss of 4,350-4,370 would suggest the current move is primarily a relief rally. In that case, 4,300-4,320 becomes the next important test. Losing 4,300 would put 4,260-4,280 back in focus, with the 4,240 post-Fed low becoming vulnerable again.
MACRO BACKDROP
The Federal Reserve raised rates by 25 basis points on September 16 to 3.75%-4.00% and signaled that additional tightening remains possible. Gold initially sold off sharply as the dollar and yields reacted to the hawkish message.
Since then, easing Treasury yields, a softer dollar and cooling oil prices have helped Gold recover strongly. Lower oil prices reduce some of the immediate inflation pressure that had been driving expectations for further tightening. At the same time, geopolitical risk in the Middle East remains an underlying source of safe-haven demand, although improving Saudi supply expectations have reduced some of the immediate energy-market stress.
CONCLUSION
The short-term picture has improved significantly after the recovery from 4,240, but 4,400 is the level that matters now. Holding above it would favor continuation of the rebound. Rejection from this area and a break back below 4,350 would shift attention toward 4,300 again.
For now, the bias is cautiously bullish above 4,350-4,370, with 4,400 acting as the key confirmation level.
Long 
Gold | Bearish Triangle Breakdown & Downside Potential Gold | Bearish Triangle Breakdown & Downside Potential
Fundamental View
Gold remains under pressure as markets prepare for the Federal Reserve’s policy decision. Expectations for a 25-basis-point rate hike remain elevated, while higher U.S. Treasury yields and a stronger U.S. dollar continue to increase the opportunity cost of holding non-yielding gold. Recent strength in oil prices has also contributed to inflation concerns, reinforcing expectations that rates could remain restrictive.
Technical View
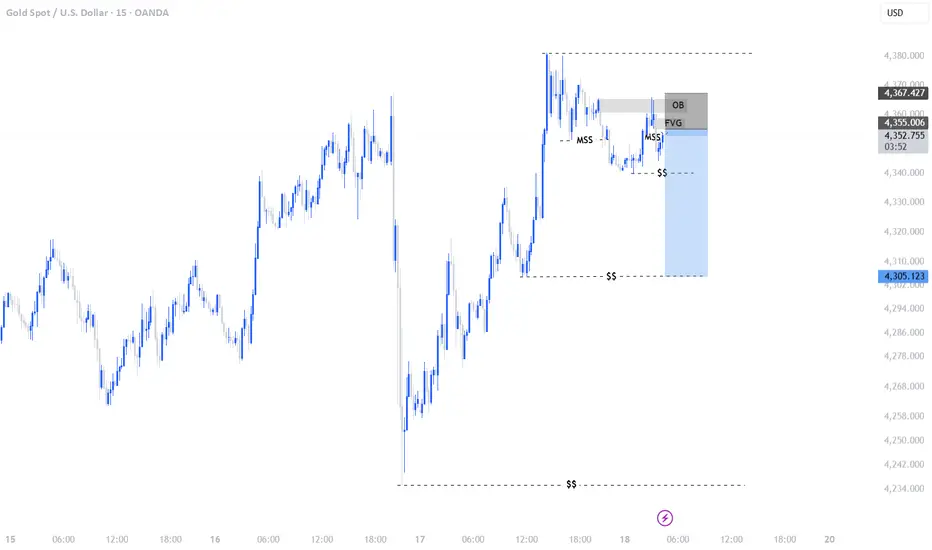
On the 1H chart, Gold is trading inside a contracting triangle after failing to regain the higher resistance area. Price remains below the descending trendline and is approaching the 4,355–4,376 resistance zone.
A clear rejection from this area, followed by a sustained break below 4,260 support, could strengthen the bearish structure and expose lower liquidity levels.
SMC View
From a Smart Money Concepts perspective, the 4,400 area represents a significant buy-side liquidity and resistance zone. The current structure suggests that a rejection below this area could lead to a move toward sell-side liquidity beneath the recent lows.
If 4,260 gives way with strong bearish displacement, attention may shift toward the lower demand and liquidity zones around 4,241 and eventually 4,155.
Trading Scenario
The bearish scenario remains in focus while Gold stays below the 4,355–4,376 resistance area.
If price rejects this zone and breaks below 4,260 with confirmation, the downside path could develop toward:
Target 1: 4,241
Target 2: 4,155
A sustained move above 4,400 would invalidate this bearish setup and could signal a shift back toward bullish momentum.
Professional Insights
The key factor for this setup is the reaction around 4,355–4,376. A rejection there would maintain the lower-high structure, while a decisive break above 4,400 would weaken the bearish thesis.
With the Fed decision approaching, volatility can increase significantly, so confirmation and risk management remain important. Reuters reported that markets were pricing roughly a 92.7% probability of at least a 25-basis-point hike, while analysts noted that hawkish guidance could keep pressure on gold.
Key Levels
Resistance: 4,355
Major Resistance: 4,376
Invalidation: 4,400
Support: 4,260
Target 1: 4,241
Bearish Target 2: 4,155
Risk Management
This is a conditional technical setup, not a guaranteed outcome. Consider waiting for confirmation around the resistance and support zones, maintaining controlled position sizing, and defining risk before entering any trade.
Disclaimer
This analysis is shared for educational purposes only and does not constitute financial advice. Market conditions can change quickly, particularly around major central-bank events. Always conduct your own research and manage risk accordingly. Short 
XAUUSD | GOLD — Friday Market Outlook## MARKET STRUCTURE
Gold is trading around **$4,386–$4,395**, extending a two-day rebound after the FOMC selloff. Price has reclaimed **$4,368** and is now testing the **$4,400** area. The structure is shifting toward neutral-to-repair, but gold remains below the major **$4,430–$4,443** supply zone.
## KEY LEVELS
**Support:** $4,334 / $4,266 / $4,235
**FVG:** $4,346–$4,368
**Resistance:** $4,400–$4,403 / $4,434
**Buy Zone:** $4,334–$4,350
**Sell Zone:** $4,400–$4,434
A sustained hold above **$4,368–$4,382** would strengthen the bullish CHOCH structure, while a break below **$4,334** would weaken the recovery.
## DXY & YIELDS
DXY remains firm around **100.24–100.31**, keeping a ceiling over gold. However, US 10Y yields have eased to around **4.93–4.94%** after briefly moving above 5%, providing the main fuel for the current gold rebound.
## FED & BOJ
The Fed delivered a **25bp hike to 3.75%–4.00%**, with the dot plot still pointing toward another 2026 hike. The BOJ also raised rates to **1.25%**, while Ueda indicated that further or larger hikes remain possible.
The combination keeps USDJPY, DXY and global yields important for gold in the near term.
## GEOPOLITICAL & OIL
Oil has eased toward **$99–$102**, reducing some inflation pressure while geopolitical risks remain present. The softer oil move has helped gold recover, but the broader geopolitical premium has not disappeared.
## MARKET SENTIMENT
Safe-haven demand is moderate rather than panic-driven. The dollar remains strong, while falling Treasury yields are currently supporting gold. Western ETF confirmation is still missing, with physical demand remaining an important medium-term support.
## TRADE BIAS
**Neutral-bullish while above $4,334.**
Above **$4,368**, buyers can continue targeting **$4,400–$4,403**, followed by **$4,434**. Failure to hold $4,334 would shift attention back toward **$4,266–$4,235**.
**Key Support:** $4,334–$4,350
**Key Resistance:** $4,400–$4,434
**Major Invalidation:** Daily close below $4,334 or above $4,434
## CONCLUSION
Gold has recovered strongly from the FOMC flush, with **$4,235 defended** and yields pulling back from their highs. Reclaiming **$4,368** has improved the short-term structure, but **$4,400–$4,434 remains the critical supply zone**.
A clean break and hold above **$4,434** would strengthen the recovery, while rejection from this zone could send gold back toward **$4,334** and potentially lower.
**KEY LEVEL TO WATCH: $4,400–$4,434**
*Not financial advice. Manage risk carefully.*
XAUUSD – Gold Attempts Recovery Below Downtrend Line XAUUSD – Gold Attempts Recovery Below Downtrend Line
Gold is trying to recover from the recent low area, but the market is still trading inside a broader bearish structure.
Price is now around 4,350 after reacting from the 4,279 support zone. This bounce shows that buyers are defending the lower range, but the recovery still needs confirmation because gold remains below the descending trendline and below the next resistance levels.
From the market side, gold is still facing pressure from stronger Fed rate-hike expectations, elevated U.S. yields, and a firmer USD. Geopolitical risks can create short-term safe-haven demand, but so far they have not been strong enough to fully shift the technical picture back to bullish.
Technical view:
Gold reacted from the 4,279 support area.
Price is now testing the 4,338 – 4,356 resistance region.
The short-term recovery is improving, but still not confirmed.
The downtrend line remains the main barrier above current price.
A clean break above 4,356 may open the way toward 4,378.
If 4,378 breaks, the next upside target is 4,416.
If gold fails around 4,338 – 4,356, sellers may try to push price back toward 4,315 and 4,279.
Key levels to watch:
Current price: 4,350
Main support: 4,279
Short-term support: 4,315
Current resistance: 4,338 – 4,356
Next resistance: 4,378
Upper target: 4,416
Bearish invalidation zone: above 4,416
Main scenario:
If gold holds above 4,315 and breaks cleanly above 4,356, buyers may continue the recovery toward 4,378.
A stronger bullish confirmation would come only if price breaks the downtrend line and holds above 4,378.
If that happens, gold may extend toward 4,416, where sellers may appear again.
Alternative scenario:
If gold rejects from 4,338 – 4,356 and fails to hold 4,315, the recovery structure becomes weaker.
In that case, price may move back toward 4,279. A clear break below 4,279 would return more pressure to sellers and may continue the bearish channel movement.
Hannah’s view:
Gold is showing a recovery attempt, but not a clean bullish reversal yet.
The chart is still controlled by the descending trendline, so I do not want to chase the move while price is sitting near resistance. Buyers need to prove strength above 4,356 first.
Main view: gold can recover toward 4,378 and 4,416 if 4,315 holds and 4,356 breaks. If price rejects from this resistance area, sellers may take control again toward 4,279. No confirmation means no trade.
Do you think gold can break the downtrend line this week, or will sellers defend 4,356 again?
Long 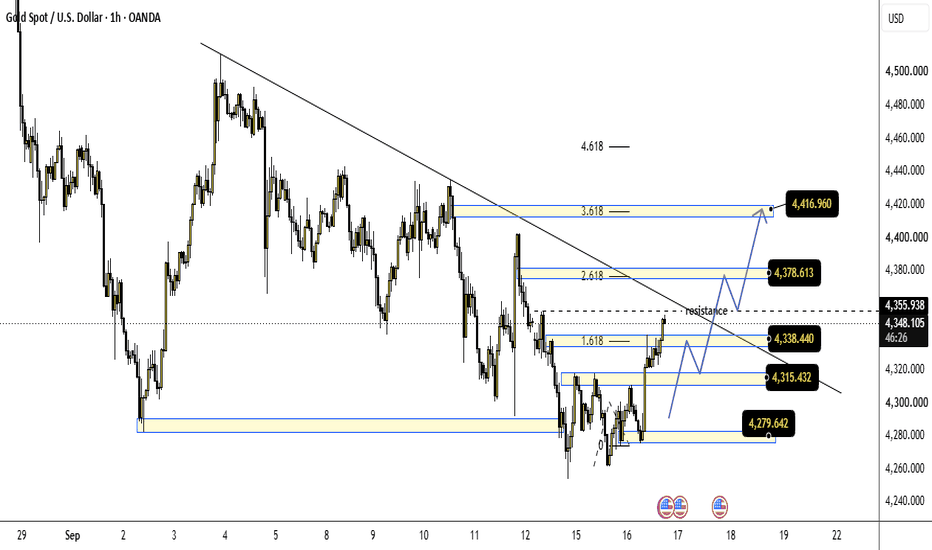
XAUUSD 4H | Liquidity Sweep + Market Structure Shift🧠 Technical Analysis:
Gold has shown a potential shift in short-term structure after sweeping liquidity around the 4,240–4,260 area. 💧
📌 Key Observations:
💧 Liquidity sweep near 4,240–4,260
🔄 Market Structure Shift (MSS) visible
📉 Descending trendline has been broken
🟢 Price is attempting to reclaim the 4,390–4,440 resistance area
🎯 If bullish structure remains intact, the next areas of interest are around 4,480–4,520, followed by 4,600–4,680
⚠️ A move back below the recent structure would invalidate or weaken the bullish scenario
🔎 Key Concepts:
💧 Liquidity Sweep | 🔄 MSS | 📈 Trendline Break | 🧱 Market Structure | 🎯 Resistance Zones
📚 Disclaimer:
This is a technical market analysis based on price structure and liquidity behavior. It is not financial advice or a guaranteed outcome. Always manage risk according to your own strategy. ⚠️
🏷️ Hashtags
#XAUUSD #Gold #TechnicalAnalysis #PriceAction #MarketStructure #LiquiditySweep #MSS #Forex Long 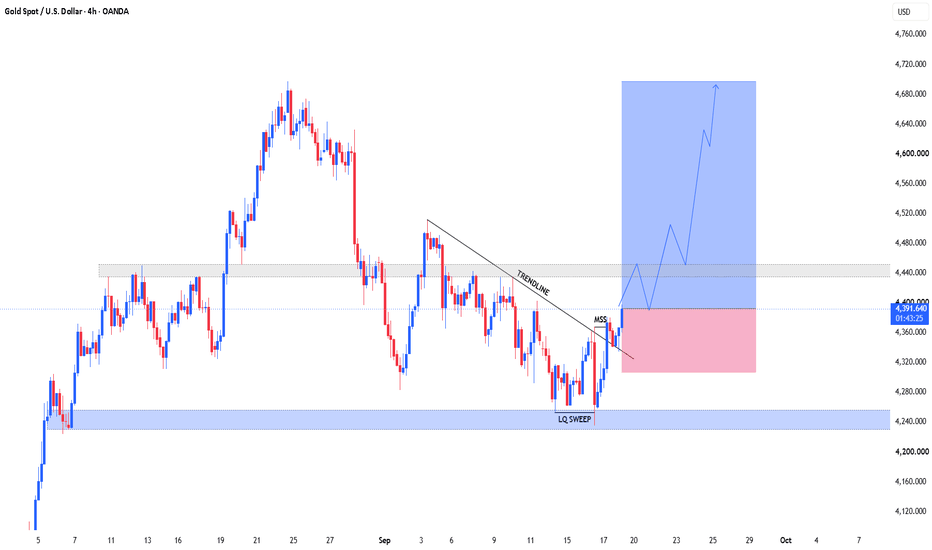
Short 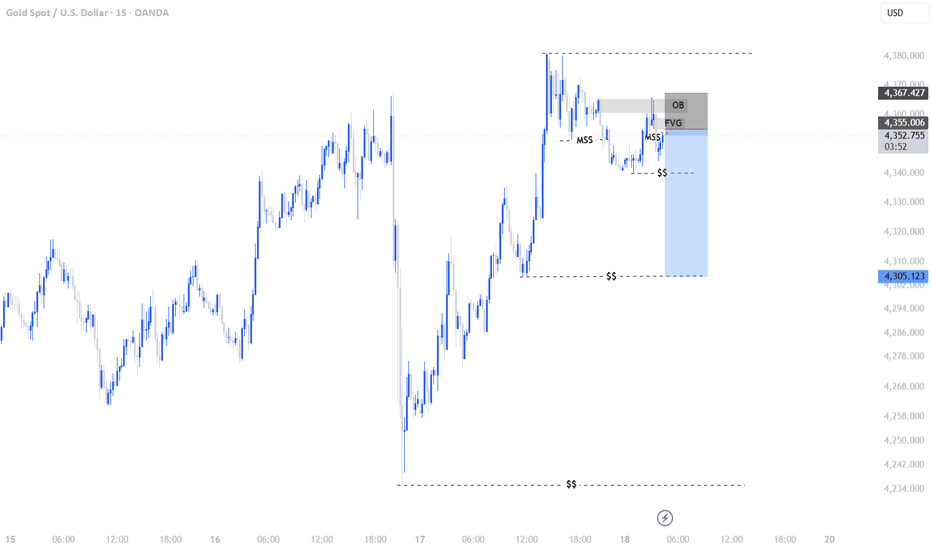
Long 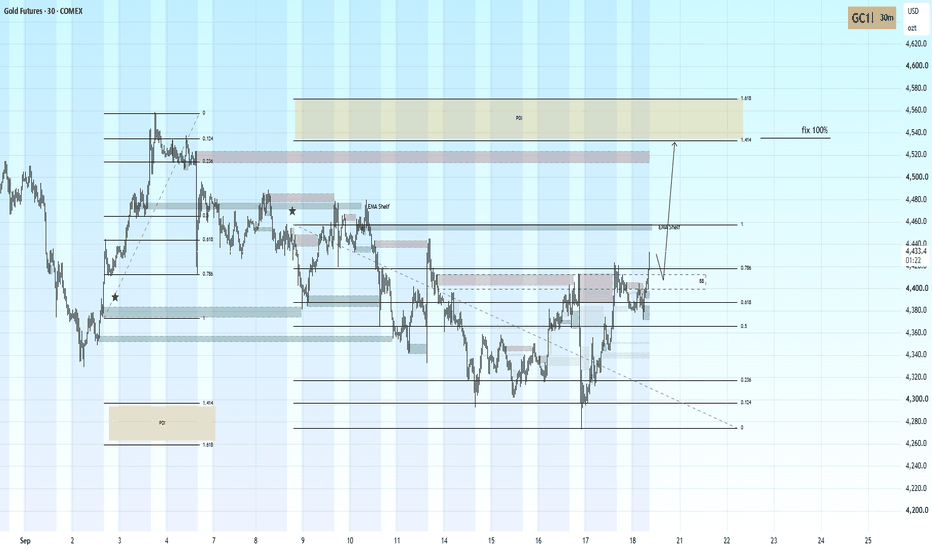
Crude Oil (CL) Analysis, Key-Zones, Setup for Fri (Sep 18)Bias: Crude settled Thursday at 97.23 on the November contract, down 52 cents or 0.53 percent, and that settlement conceals the entire session. November opened at 97.50, printed a session low of 94.42 and settled 83 percent of the way up a 3.37 dollar range. The decline that actually happened was 3.41 percent. The decline that survived to the settlement was half a percent. De-escalation authored the move: reports at 7:58 AM ET that China had privately asked Iran to help rein in Yemen's Houthis after a Saudi appeal to Beijing, confirmation that US officials met the Houthis in Oman over the weekend, and a Saudi signal that roughly half the damaged pipeline could restart within days. Escalation headlines arrived in the afternoon, a reported maritime security incident in the Strait of Hormuz 16 nautical miles northeast of Khasab at 3:30 PM ET and explicit government-change language from Israel's prime minister at 3:51 PM ET, and the settlement still finished 2.81 dollars above the low. The forward curve stayed backwardated at the settlement: the expiring October contract settled at 101.91 against November at 97.23, a 4.68 dollar premium for nearer delivery that says barrels are wanted now rather than later. Cross-asset, crude was the independent variable rather than the follower, with cheaper oil easing the inflation path and driving the equity and bond rally, the broad index closing 1.11 percent higher and the technology index 1.70 percent higher, while the dollar index sat near 100.238 in evening trade after the 04:00 PM ET equity close, having held most of its post-decision gains. Positioning inputs for this contract are curve shape and open interest rather than an options surface, and 295,173 contracts on November against 128,801 on the expiring October confirm the roll is complete. Mechanically the contract is extended, with the settlement 8.90 to 32.99 percent above its 20-day through 200-day averages and the multi-indicator composite at 100 percent buy with all thirteen components in agreement, while the 14-day directional index at 35.29 confirms an intact trend rather than a drift. The economic calendar captured for this run lists no energy-specific release for Friday, its one verified Friday item being industrial production at 9:15 AM ET, with Federal Reserve commentary from Bowman at 9:30 AM ET and Schmid at 11:45 AM ET carried on the news-feed calendar only and unconfirmed against a primary source, which places the first-order risk on unscheduled headlines. Bias is constructive higher while 94.42 holds, with mean reversion toward the 97.71 to 97.79 confluence the base case, and the 9:15 AM ET data window is the session's first identifiable catalyst.
Resistance:
- 101.69 to 101.91 the 52-week high converging with Pivot R3, the structural ceiling of the advance
- 99.85 Pivot R2 area, primary upside objective inside one average-range day
- 98.54 Pivot R1, first mechanical objective with no competing structure at the price
- 97.79 session high, upper edge of the immediate ceiling band
- 97.71 5-day moving average, now sitting above price, the earliest signal of momentum fatigue
Support:
- 96.48 Pivot Point, opened on it and traded through it in the reopened session
- 95.17 Pivot S1, lower edge of the primary entry zone
- 94.42 session low, set in Thursday's washout with the settlement 2.81 dollars above it, structural invalidation
- 93.11 Pivot S2, first mechanical objective beneath the session low
- 91.80 Pivot S3, roughly 1.5 average-range units from settlement
- 89.28 20-day moving average, first structural support base beneath the pivot mathematics
Primary Setup: LONG CL from the 95.17 to 96.48 zone on a pullback into the pivot shelf beneath Thursday's settlement, with the thesis resting on a settlement 83 percent up the session range and a forward curve still in 4.68 dollar backwardation. Stop 94.25, placed beneath the session low at 94.42, a level established in Thursday's washout, whose failure would mean the demand that defined Thursday has withdrawn. Targets at 97.79 first, the session high with the 5-day moving average immediately beneath it, 98.54 second at Pivot R1, and 99.85 third at Pivot R2 if momentum extends through the second target on expanding volume. The position carries one half to two thirds of equivalent equity index risk, because a 14-day average true range of 3.60 dollars means 3.70 percent of settlement moves in a routine session, and stops tighter than 75 to 100 cents are not defensible against that range. Pricing is likely to be disorderly around the 9:15 AM ET industrial production release and the Federal Reserve commentary the news-feed calendar places, unconfirmed, at 9:30 AM ET, and the 9:00 AM ET pit open sets the session's first directional test. A decisive close above 98.54 with backwardation intact unlocks 99.85 and then the 101.69 to 101.91 confluence, while a decisive close beneath 94.42 negates the long case entirely and opens 93.11 with little structure until the 20-day average at 89.28. Weekend headline exposure is material: trade closes Friday at 5:00 PM ET and does not reopen until Sunday at 6:00 PM ET, roughly 49 hours of unhedged time against an unresolved maritime incident, and crude gaps on geopolitical developments more readily than the equity index contracts.
Friday is a headline session rather than a scheduled one, since the calendar carries no energy-specific release. The 14-day average true range is 3.60 dollars, or 3.70 percent of the settlement, and a one average-true-range day from 97.23 spans 93.63 to 100.83. Thursday's 3.37 dollar range sat just beneath that average despite containing a 3.41 percent drawdown and a full recovery, which is the clearest measure of how much two-way business this contract absorbs in a routine session.
 Long
Long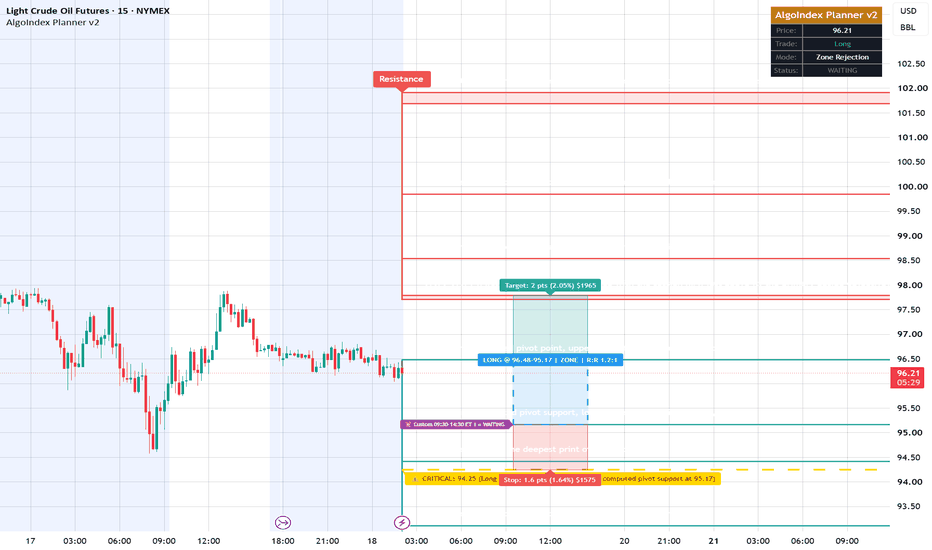
 Long
Long
Long 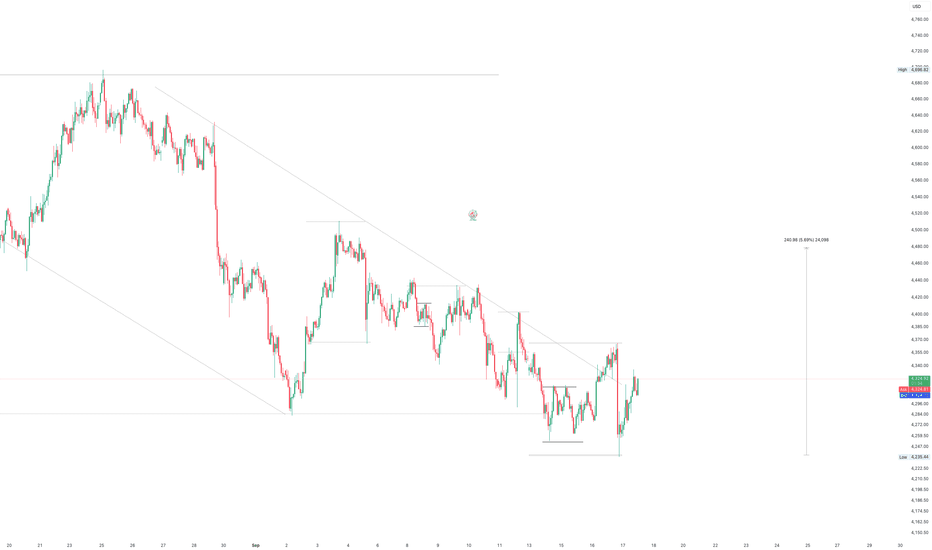
XAUUSD | 4H — Rejection Into the Range LowStructure
Since the 4,690 high on Aug 25, gold has printed a clean sequence of lower highs inside a descending channel. The impulsive break on Aug 28-29 damaged the structure and price has been distributing between 4,225 and 4,500 ever since. The Sep 16 low at 4,264 held, producing the current bounce into the POI.
Where we are
Price at 4,367, sitting exactly on the POI at 4,367.13, below the POC at 4,404.55, and pressing into the underside of the descending trendline. This is a decision point, not an entry.
The plan
Leg one: a push into the 4,404-4,450 supply where the POC, the order block and the channel all converge. That is where the short is looked for — not here.
Leg two: rejection from that pocket and rotation back toward the range low at 4,250-4,270. That is the only target this idea commits to, and it is the one that either confirms or kills the thesis within days rather than weeks.
Leg three is conditional. Below 4,225 the volume profile thins out considerably between 4,200 and 4,100, which is why the move toward 3,975 can travel fast once it starts. Worth noting that the first genuine shelf of resting demand sits at 4,040-4,080, not at 3,975 — expect the first reaction there.
Invalidation — 4,450
Marked on the chart for a reason. A 4H close above 4,450 breaks the channel and ends the bearish case outright. Above it, the path opens to 4,525 and then the 4,550-4,625 supply. No ambiguity, no moving the line afterwards.
Bias
Bearish while below 4,450 and inside the channel. Everything between 4,305 and 4,404 is range noise and not worth trading. The decisive move begins on a reclaim above 4,450 or a 4H close below 4,225.
Not financial advice. Technical read only. Short 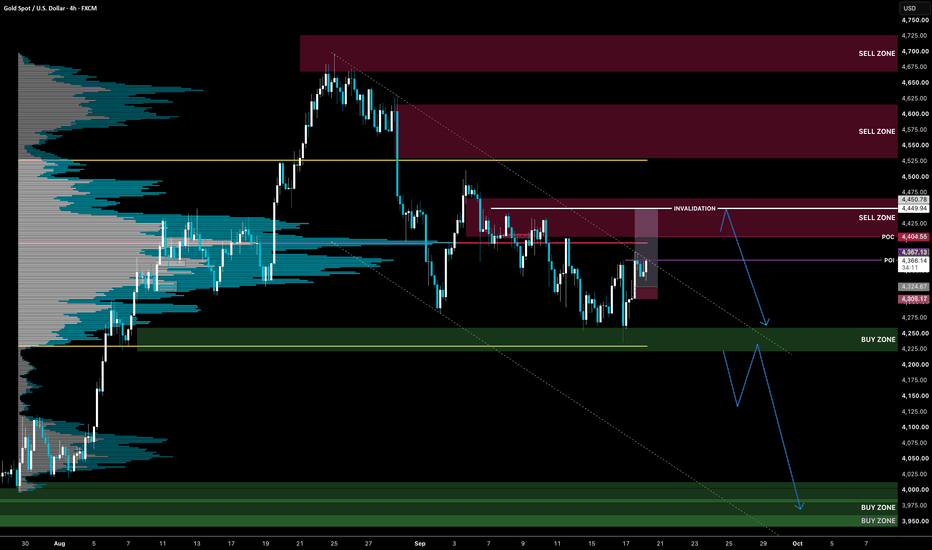
Short 
Short 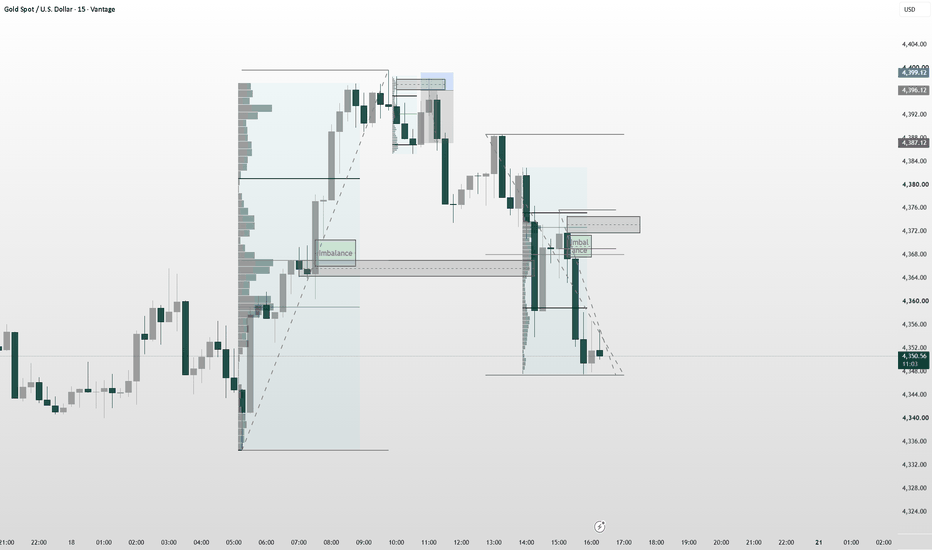
Gold prices rebounded to 4,400.1. Fed remains the key driver
The Federal Reserve raised interest rates by 25 bps to 3.75%–4.00% on September 16, its first hike since 2023. The Fed also left the door open to another increase, keeping monetary policy restrictive. This remains a structural headwind for gold because higher rates increase the opportunity cost of holding a non-yielding asset.
💵 2. USD and Treasury yields
Immediately after the Fed decision, the dollar and short-term Treasury yields strengthened, putting pressure on XAU/USD. However, on September 17 the dollar and yields retreated, helping gold rebound sharply.
The 10-year Treasury yield remains close to 5%, so yields are still an important downside risk for gold.
🛢️ 3. Oil prices are becoming important
Falling oil prices have recently reduced concerns about another inflationary shock. Lower energy prices can ease expectations for further Fed tightening, which is positive for gold.
Reuters reported that gold gained more than 2% on September 17, supported by lower oil prices, a weaker USD and falling Treasury yields.
📌 Fundamental conclusion
Bullish factors:
🟢 Weaker USD
🟢 Lower Treasury yields
🟢 Falling oil prices
🟢 Geopolitical/safe-haven demand
Bearish factors:
🔴 Fed remains hawkish
🔴 Interest rates are now 3.75%–4.00%
🔴 Yields remain elevated
🔴 Further Fed tightening remains possible
----------------
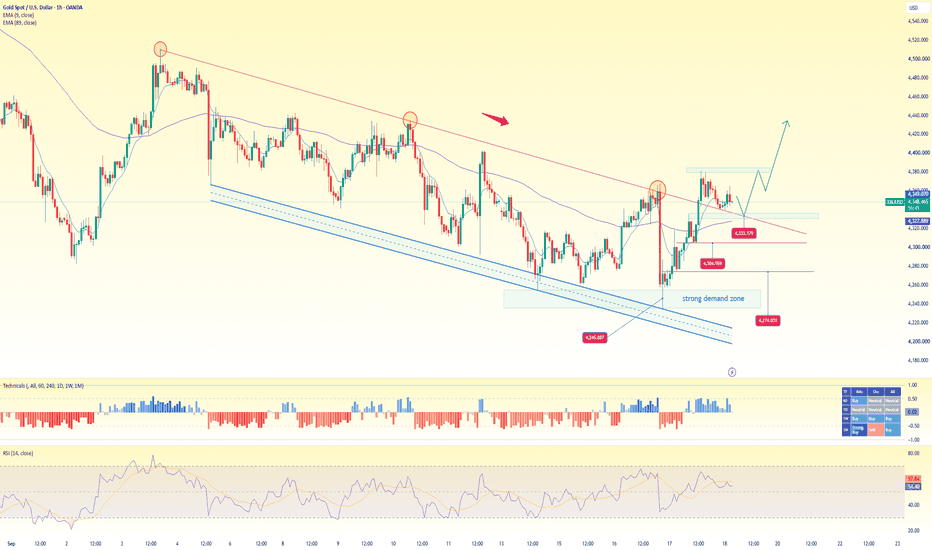
BUY GOLD zone : 4333 - 4328
SL : 4323
TP : 4345 - 4368 - 4400
Long