Short
Short
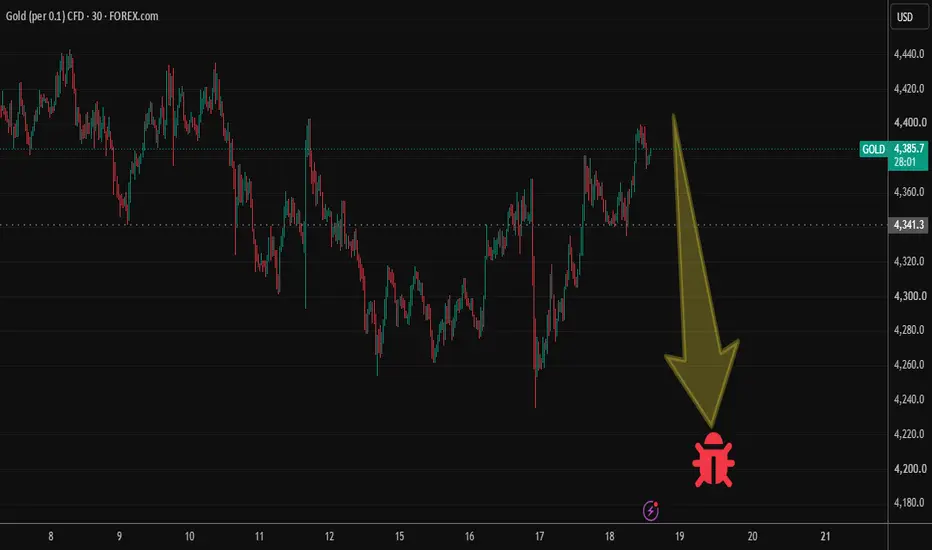
Gold Liquidity Sweep at Highs, Bearish Retracement Toward POIStructure: Price found strong support (~4,260-4,280) after a liquidity injection/sell-side sweep on Sep 16, then reversed sharply, breaking the market structure shift trendline. It rallied through a bullish channel, tagging an FVG (~4,340-4,355) and buy-side liquidity zone (~4,355-4,375) along the way — both marked as key reaction points on the way up.
Current phase: Price pushed above the buy-side liquidity zone and just completed a liquidity sweep at the recent highs (~4,400), then is now pulling back sharply. Current price is 4,381.6, sitting just above the marked POI zone.
Bearish targets: The chart lays out three stepped POIs below current price:
POI 1: ~4,360
POI 2: ~4,340 (aligns with the earlier FVG/buy-side liquidity zone — likely the first strong reaction area)
POI 3: ~4,300
This suggests a scenario where, after sweeping the highs, price retraces down through these POIs, with POI 2 being the more significant confluence zone since it overlaps the prior FVG and liquidity zone.
Key levels to watch:
Resistance: 4,400 (recent liquidity sweep high)
Support/Demand: 4,340 (FVG/POI 2 confluence) → 4,260-4,300 (strong support/sell-side liquidity)
Invalidation: A strong bullish continuation above 4,400 with no meaningful pullback would invalidate this bearish retracement view.
Same note as before — this is a technical read of your chart's own markup (liquidity sweep + POI stepping), not financial advice. Since this is the 15-min chart, these moves can play out fast, so tight risk management matters if you're trading this.
Short 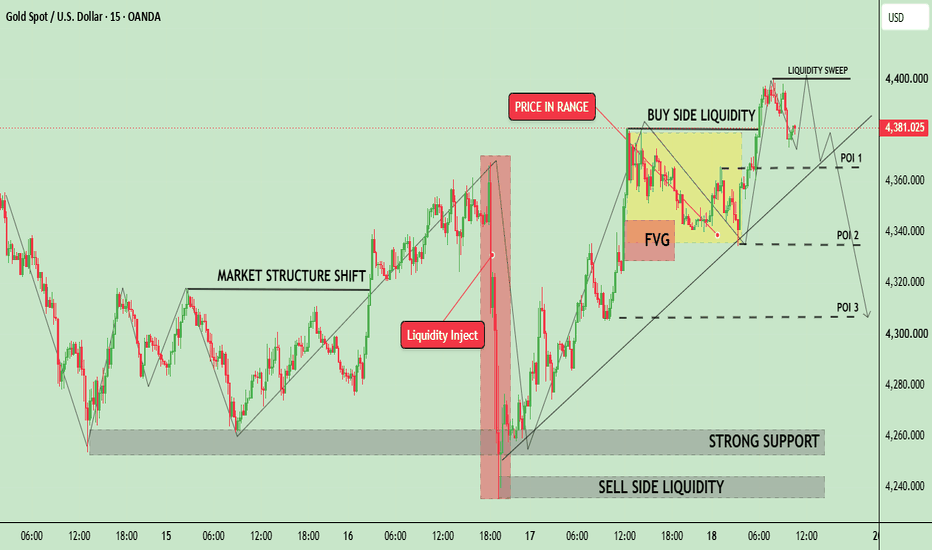
 Long
Long
XAUUSD – H2 Bullish Recovery Toward Supply
XAUUSD is trading around 4,354 after extending its recovery from the lower structural area. Price has broken above the recent descending trendline and printed an MSS, showing that short-term buyer momentum is improving. However, gold is now entering the first resistance / supply zone, so a controlled pullback may be needed before the next expansion.
Gold gained more than 2% on Thursday as the U.S. dollar weakened, oil prices eased and Treasury yields pulled back. Spot gold was still around 4,361 early Friday, while the U.S. 10-year yield moderated to roughly 4.94% and Brent slipped toward $103.77.
The broader macro backdrop remains restrictive. The Fed raised rates by 25 bp to 3.75%–4.00%, and 16 of 18 policymakers still expect at least one additional hike this year. That keeps higher real yields and a stronger-dollar risk in play even as gold attempts to recover.
Technical View
The H2 chart shows a meaningful recovery from the lower trendline structure around 4,260–4,280.
Price has now pushed back above the descending trendline and printed a bullish MSS, which weakens the immediate bearish momentum.
The first important obstacle is the 4,355–4,380 Resistance / Supply Zone. Because price is already testing this area, chasing the rebound offers weaker positioning.
The cleaner bullish location sits lower at the 4,300–4,320 Demand Zone. A controlled pullback into this area followed by bullish rejection, higher-low formation or another MSS would support continuation.
Above current resistance, the next major target is the 4,415–4,435 Major Supply Zone.
If buyers establish acceptance above that structure, the larger recovery objective sits around 4,495–4,510.
Key Zones
Current Price: 4,353.695
Resistance / Supply: 4,355–4,380
Buy Priority / Demand: 4,300–4,320
Major Supply: 4,415–4,435
Upper Supply: 4,495–4,510
Structural Support: 4,234.819
Trading Plan
Buy Priority: 4,300–4,320
Condition: wait for an H2 pullback into demand followed by bullish rejection, liquidity sweep + reclaim, higher-low formation or renewed MSS confirmation.
TP1: 4,355–4,380
TP2: 4,415–4,435
TP3: 4,495–4,510
Invalidation: sustained H2 acceptance below 4,300 would weaken the immediate recovery setup.
Buy/Sell View
The preferred idea is not to chase gold directly into resistance.
A retracement toward 4,300–4,320 would provide a cleaner location to evaluate buyer strength. If demand holds and structure confirms, the recovery can continue toward the higher supply zones.
If demand fails, the bullish recovery thesis should be reassessed rather than forcing another long.
Important Note
The Fed remains hawkish despite the current gold rebound. Lower oil and Treasury yields are helping buyers in the short term, but another rise in yields or renewed dollar strength could quickly cap the recovery.
Final View
Gold is showing an improving H2 recovery after breaking the descending trendline, but price is now testing its first important resistance.
The cleaner scenario is a pullback into 4,300–4,320 followed by confirmed bullish continuation, targeting 4,355–4,380, then 4,415–4,435, with 4,495–4,510 as the larger recovery objective.
Can buyers defend H2 demand before gold expands toward the major supply zone? Long 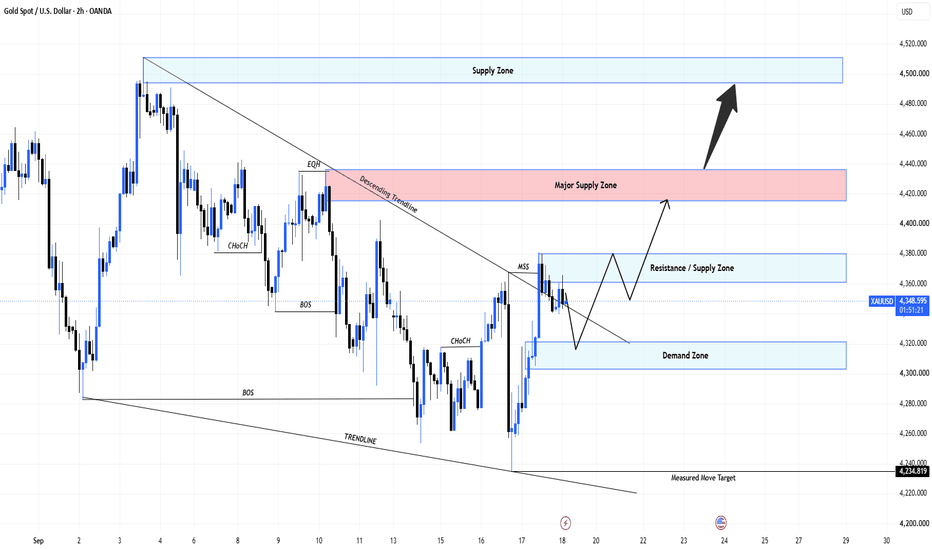
XAUUSD – Gold Recovery Meets Channel Resistance XAUUSD – Gold Recovery Meets Channel Resistance
Gold is trying to extend its recovery after holding above the lower liquidity zone, but the market is not in a clean bullish continuation yet.
Price is now trading around 4,386 after recovering from the previous sellside liquidity area near 4,250 – 4,300. This reaction shows that buyers are still active from the lower part of the structure. However, the bigger chart still shows gold moving inside a wide descending channel, so the next resistance area will be very important.
From the market side, gold is supported by softer USD conditions, lower oil prices, and weaker U.S. Treasury yields. The daily close above the SMA 100 near 4,320 also helps buyers defend the recovery structure. But RSI remains neutral, which means momentum is not aggressive yet. Buyers still need confirmation before the move can become stronger.
Technical view:
Gold reacted from the sellside liquidity zone and recovered toward 4,386.
Price is still trading inside a broader descending channel.
The nearest key level is 4,332, which now acts as short-term support.
As long as gold holds above 4,332, buyers still have room to push higher.
The first upside resistance is around 4,430 – 4,480.
A clean break above this zone may open the way toward 4,641.
The 4,641 area is the larger sell zone and major resistance to watch.
If gold fails below the channel resistance, sellers may try to push price back toward 4,332 again.
Key levels to watch:
Current price: 4,386
Short-term support: 4,332
Liquidity support: 4,250 – 4,300
Sell scalping area: 4,480
Major sell zone: 4,641
Bullish confirmation: above 4,480
Bearish pressure returns: below 4,332
Main scenario:
If gold holds above 4,332 and continues to build higher lows, buyers may attempt to push price toward 4,480.
A clean break above 4,480 would show stronger bullish momentum and may open the next upside path toward 4,641.
Alternative scenario:
If gold rejects from the channel resistance or fails to hold 4,332, the recovery may weaken.
In that case, sellers may try to pull price back toward the previous liquidity zone around 4,250 – 4,300 before buyers return again.
Hannah’s view:
Gold is recovering, but the chart is still asking for confirmation.
The close above the SMA 100 gives buyers a better position, but the descending channel resistance is still the main barrier. I do not want to chase price in the middle of the move. The cleaner plan is to watch whether gold can hold 4,332 and break 4,480.
Main view: gold can continue recovering while 4,332 holds. A break above 4,480 supports continuation toward 4,641. If 4,332 fails, price may return to the lower liquidity area. No confirmation means no trade.
Do you think gold can break the channel resistance, or will sellers defend the 4,480 area again?
Long 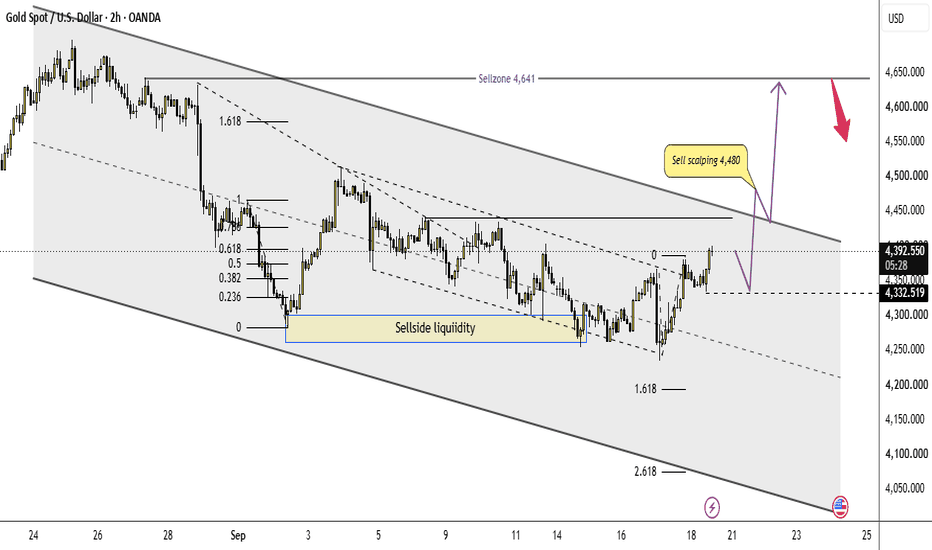
Short 
XAUUSD: Price Approaching Major Bearish Order Block – Decision ZDescription:
Gold is currently advancing toward a significant higher-timeframe Bearish Order Block after a series of structural developments.
Market Structure Overview Multiple Breaks of Structure (BOS) have confirmed strong directional shifts throughout the recent decline and subsequent recovery.
Price has respected several support zones on the way up, showing short-term bullish momentum.
The major unmitigated Bearish Order Block sits at 4,390 – 4,405. This is the last area of institutional selling before the previous impulsive drop.
Current Situation
Price is trading near 4,371 and is approaching this critical supply zone. A clean reaction or rejection from the Bearish Order Block would align with the broader bearish structure seen on higher timeframes.
Key Levels to Watch Bearish Order Block: 4,390 – 4,405
Intermediate resistance: 4,340 – 4,350
Major support: 4,260 – 4,235
Educational Trade Framework Bias: Bearish on rejection from the Order Block
Sell Zone: 4,390 – 4,405
Stop Loss: Above 4,420
Take Profit 1: 4,300
Take Profit 2: 4,235 – 4,240
Risk : Reward ≈ 1 : 2.5
This is a high-probability Smart Money setup: price is being delivered into an unmitigated Bearish Order Block after taking liquidity and completing corrective structure.
This analysis is strictly for educational purposes and does not constitute financial advice. Always apply proper risk management.
Short 
Long

Long 
Short 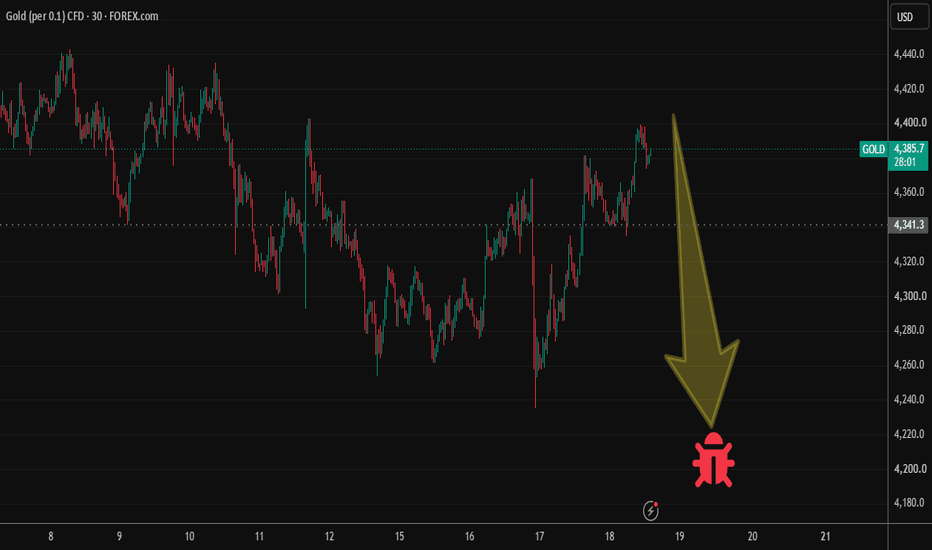
Gold 1H: Channel Rally Tests Major Sell ZoneRemember that liquidity sweep we flagged below the Zone Buy? It played out exactly as expected, and gold has been on an impressive run ever since — now testing one of its biggest resistance areas.
After the sweep confirmed with a CHoCH near 4,300, gold rallied hard, cleanly breaking through Target 1 near 4,400 — marked on the chart as "Done Target 1." That's a strong signal the reversal thesis was correct.
Since then, price has been climbing inside a clean ascending channel, a classic sign of controlled, structured buying rather than a chaotic spike. Along the way, gold formed a Small OB (Order Block) around 4,335–4,355 — a small pocket where buyers stepped back in during a pullback — and that level held nicely before price pushed higher again.
Now gold is pressing right into the Zone Sell Support near 4,420–4,460, sitting at the very top of the ascending channel. This is a big moment: it's the same major resistance area that's capped gold's rallies multiple times on higher timeframes. Trading around 4,367 currently, with the last visible bounce off the Small OB carrying price back toward this zone.
Here's the key question the market has to answer: does gold have enough momentum to break clean through this Zone Sell Support, or does it reject here like it has before? Given the strength of the impulsive move off the liquidity sweep and a validated OB along the way, the structure currently favors buyers — but resistance zones this significant deserve respect until they're actually broken.
If gold pushes through, that would be a strong bullish continuation signal. If it rejects, watch for a pullback back to the Small OB or the lower channel boundary as the next area of interest.
For beginners: an ascending channel with a holding order block inside it is one of SMC's cleanest visual cues that buyers are in control — but always let price prove it at the next resistance, don't assume it in advance.
💬 Do you think gold breaks through this Zone Sell Support for a fresh leg higher, or does it reject and pull back into the channel first? Long 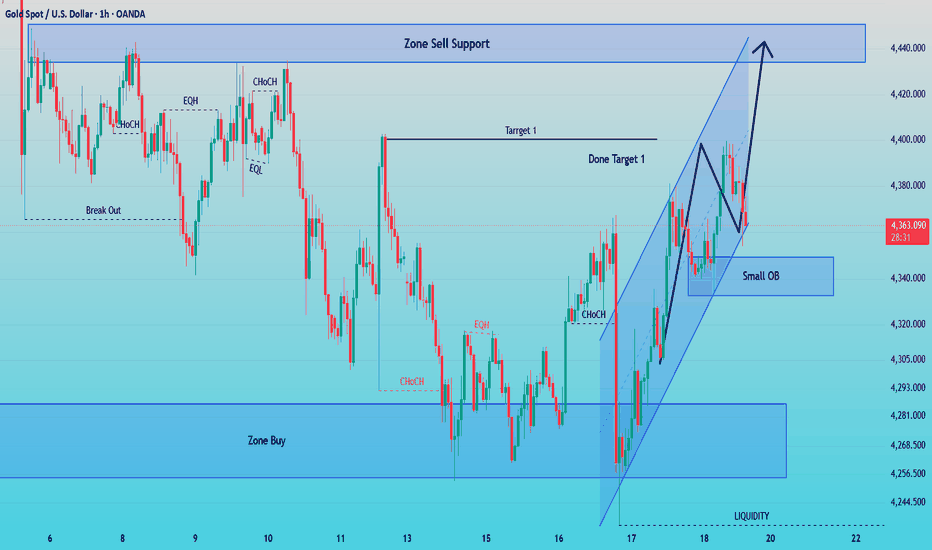
Short 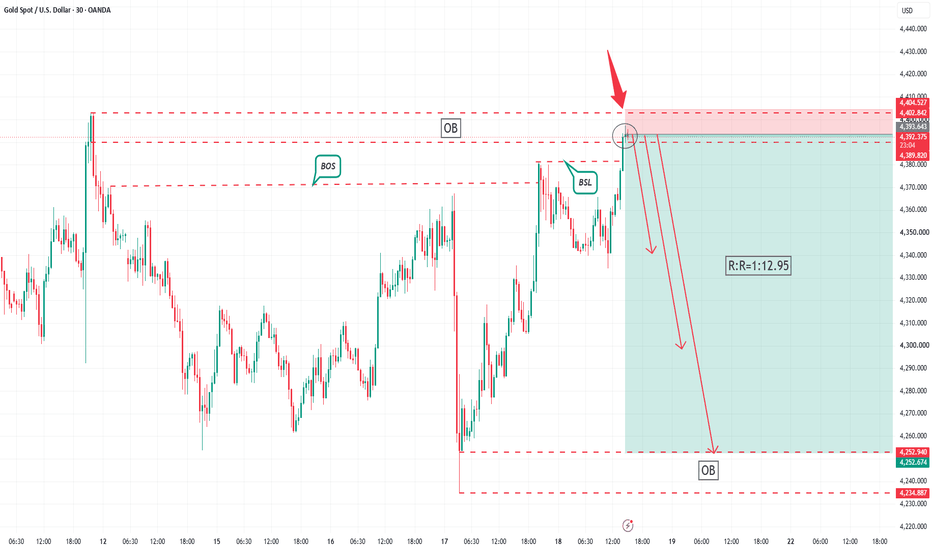
XAUUSD 15M | BOS + Demand Zone Retest🔎 Technical Analysis
Gold is showing a short-term bullish structure on the 15-minute chart after breaking above the previous structure around 4,380. 📈
💧 Key levels & structure:
🔄 MSS: Earlier shift in market structure supported the bullish move.
🚀 BOS: Price broke above the 4,380 structure level.
🟦 Demand Zone: 4,370–4,378 — important area to monitor for a potential retest.
🟦 15M OB: 4,335–4,345 — deeper structural support if price retraces further.
🎯 Upside area: If price holds above the demand zone and bullish structure continues, the next areas of interest are around 4,400–4,410+.
📌 Scenario
Bullish scenario:
If price retraces into the 4,370–4,378 demand zone and shows bullish confirmation, continuation toward the recent highs and higher resistance areas could be considered. 📈
Invalidation / Risk:
A decisive move below the demand zone would weaken this bullish structure and could bring the 4,335–4,345 OB into focus. ⚠️
🧠 Key Concepts:
MSS 🔄 | BOS 📈 | Demand Zone 🟦 | 15M Order Block 🟦 | Market Structure 📊
⚠️ Disclaimer: This is technical analysis based on the chart structure shown and is not a guaranteed outcome or financial advice. Always apply your own risk-management rules.
🏷️ Hashtags
#XAUUSD #Gold #PriceAction #MarketStructure #BOS #MSS #SupplyAndDemand #TechnicalAnalysis Long 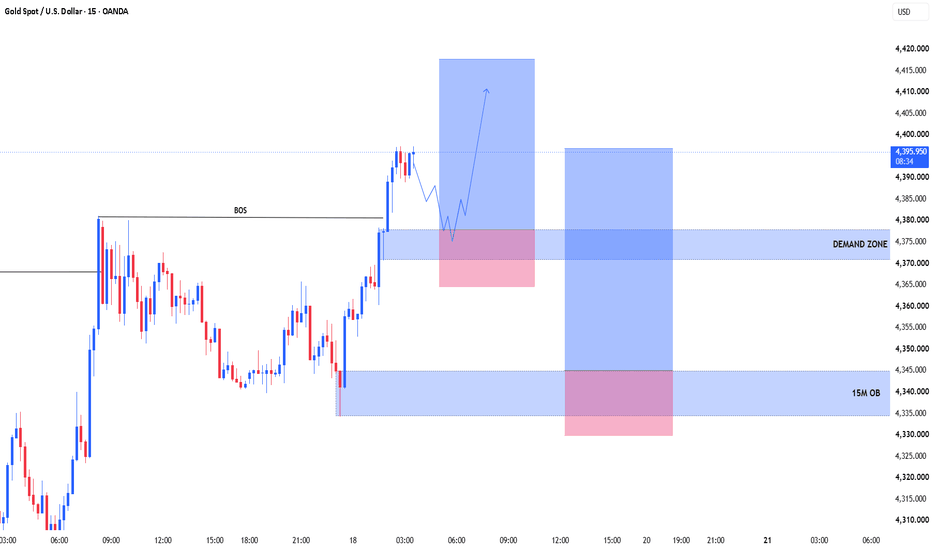
XAUUSD 15m - Long the retracement into 4350-4360 demandChart context Gold is trading around 4,385 after sweeping buy-side liquidity above the 4,395 swing high. The prevailing regime on this timeframe is impulsive bullish expansion: fast, wide displacement candles to the upside, shallow corrections, and multiple fair value gaps left unfilled on the way up. The leg now developing lower reads as a retracement within that regime rather than a reversal, so the plan is to wait for a discounted entry instead of buying at the highs.
Area of interest 4,350 - 4,360. This zone contains a clear fair value gap from the last impulsive leg and the upper boundary of the unmitigated order block that initiated it. A Fibonacci drawn across that impulse places the zone inside the 61.8 - 78.6 percent retracement band.
Levels Direction: Long Entry zone: 4,350 - 4,360 Stop loss: 4,330 Take profit 1: 4,395 Take profit 2: 4,410
From the middle of the zone this is approximately 25 points of risk for 40 points to the first target and 55 points to the second.
Confirmation required
Price pulls back into the 4,350 - 4,360 zone.
A 1-minute or 5-minute bullish change of character with strong bullish displacement.
An internal break of structure confirming the lower timeframe shift.
A reaction off the order block inside the zone.
A bullish engulfing candle or a strong close off the bottom of the zone as the entry trigger.
If no confirmation prints, there is no entry. A blind limit order into the zone is not part of this plan.
Invalidation A 15-minute candle close below the swing low at 4,330 invalidates the idea and suggests a deeper retracement or a trend reversal. Flat, no averaging down.
Event risk Gold remains sensitive to dollar strength, yield moves, and scheduled macroeconomic releases. Check the economic calendar before committing size.
Note This is my own technical analysis and trade journal, shared for educational purposes only. It is not financial advice. Always use your own risk management and never risk capital you cannot afford to lose. Long 
A good trading plan should stand the test of the market!Gold Price Trend Analysis:
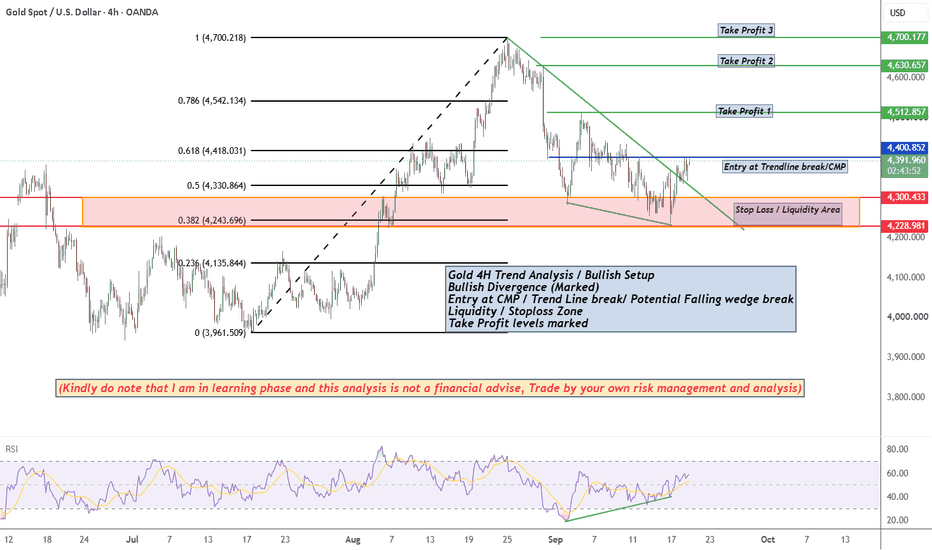
Gold Technical Analysis: Gold experienced a strong upward surge on Thursday. The Asian session saw upward fluctuations, the European session continued the upward momentum, and the US session saw consolidation. The daily chart closed with a large bullish candle, confirming the strength of the short-term bullish counterattack. The price has risen above the short-term moving averages, shifting the short-term trend from Wednesday's weakness to a slightly bullish bias. However, it's crucial to note that the recent surge to 4381 touched the descending trendline extending from the 4697 high, representing a significant confluence of resistance. Significant selling pressure emerged here, leaving an upper shadow signal. The current reasons driving the gold price surge are: first, the Fed's interest rate hike has been implemented; second, there are signs of de-escalation in the Middle East, and crude oil prices have fallen. Given this, the medium-term outlook for gold and silver remains bullish, but short-term consolidation is needed.
On the 4-hour timeframe, the short-term trend is bullish, marked by four consecutive bullish candles and a standard upward structure characterized by rising lows and highs; the overall upward channel remains intact, and the candlestick formation favors the bulls. Consequently, even if a brief pullback occurs, the price is likely to recover quickly; strong buying pressure currently exists, with capital stepping in to support the price during dips, allowing the bulls to gradually gain the upper hand. However, despite this bullish momentum, significant resistance lies ahead, meaning the upward path will not be smooth sailing. Attention remains focused on the 4381–4400 resistance zone; upon the initial approach to this level, the price will likely face heavy selling pressure, creating a possibility of a pullback or consolidation after the rally stalls. Thus, this resistance zone serves as a critical threshold for determining whether the current rebound can extend further. On the 1-hour chart, the price broke above the previous consolidation high of 4367, opening up room for further short-term gains, with moving averages turning upward to signal bullish dominance. However, the price retraced quickly after hitting resistance at the 4381 trend line, and the MACD shows signs of turning downward from a high level, indicating the release of selling pressure and a shift into a phase of high-level consolidation; structurally, short-term support lies in the 4320–4300 range, representing a "flip" level where previous resistance has turned into support. Long 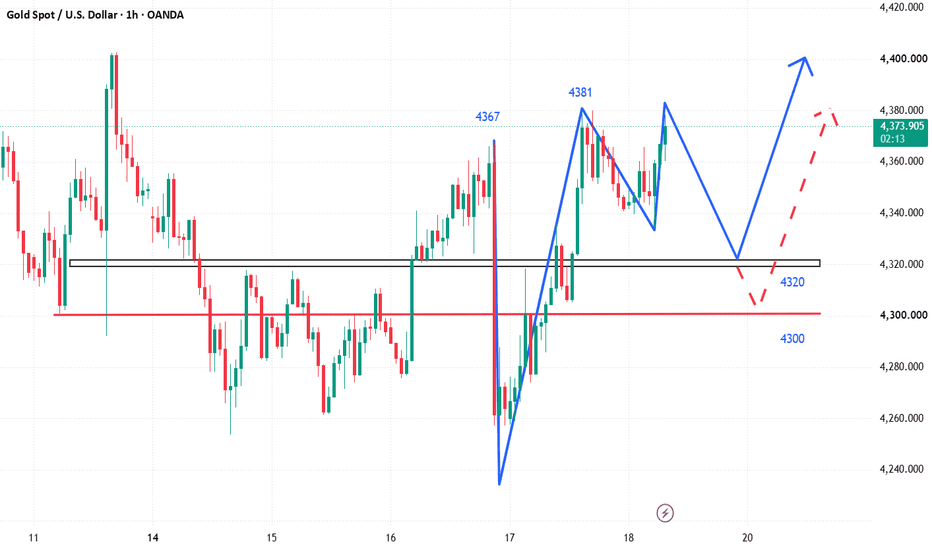
XAU/USD Bullish Reversal | Buy Zone Holds, 4,390 Target in FocusU/USD 15M Analysis — Bullish Setup 🟢
Bias: Bullish — price is trading inside a descending channel and approaching the marked buy zone.
Buy Zone: 4,335.803 – 4,336.072
Entry: 4,335.803
Stop Loss: 4,316.206
Target: 4,389.763
Resistance / Sell Zone: 4,375 – 4,380
Trade Idea
A bullish move from the 4,335 area could lead to a channel breakout and continuation toward 4,389.763. The setup becomes invalid if price breaks and holds below 4,316.206.
Risk/Reward: approximately 1 : 2.75 from the marked entry to target.
Key confirmation: Look for bullish rejection/candle confirmation around the buy zone before entering. Long 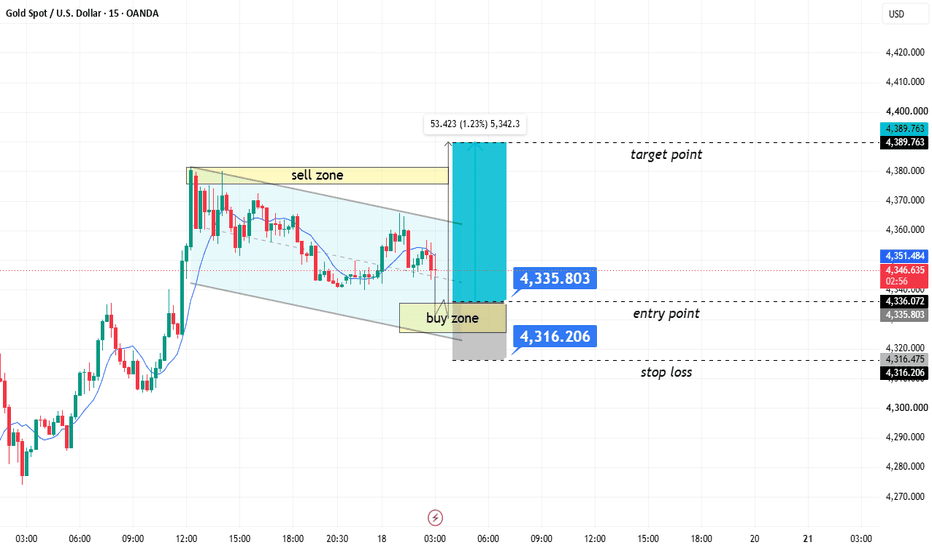
Gold Sweeps the Lows, Breaks Structure — Now the FVG DecidesXAUUSD · Sep 19, 2026 · Price: 4,389.58
Gold spent most of the month bleeding lower from the 4,500 high on the 4th, printing a textbook sequence of bearish BOS levels along the way. The descending trendline held cleanly for two weeks. Nothing controversial about that leg — sellers were in control and every rally got sold into the trendline.
The shift happened on the 17th. That deep wick down to 4,240 wasn't real selling, it was a liquidity raid. It took out the SSL resting under the 15th–16th consolidation and ran the external liquidity pool around 4,285 in the same move. Price immediately reversed and closed back inside the range — classic stop hunt behavior. What followed was the important part: a sharp impulsive rally that sliced through the descending trendline and printed a bullish BOS on the 18th. That's the market structure shift.
Now the setup. That impulse left an unfilled FVG around 4,368, and price is currently hovering just above it. The bullish thesis is straightforward: price retraces into the imbalance, finds demand, and continues toward the unmitigated bearish OB sitting at 4,463–4,480 — the origin of the whole down move and the only real supply left overhead.
The numbers:
Entry zone: 4,368 (FVG fill)
Invalidation: below 4,341
Target: 4,463, with the OB extending to 4,480
That's roughly 27 points of risk against 95 to target. Call it 3.5R. The math is what makes this setup worth taking, not the bias.
What would kill this idea: a clean close below 4,341. If price loses the FVG and the demand block beneath it, the bullish BOS becomes a failed break and we're right back to the sellers' game — 4,285 comes into play fast. Also worth watching: a rally that skips the retrace entirely and goes straight to the OB. Chasing that would mean taking a far worse entry with the same invalidation, which turns a 3.5R idea into something closer to 1R. Not worth it.
Patience is the trade here. The structure has shifted, but the entry hasn't come to you yet. Let the FVG do its job.
This is technical analysis shared for educational purposes only — not financial advice. Trade your own plan and manage your own risk. Long 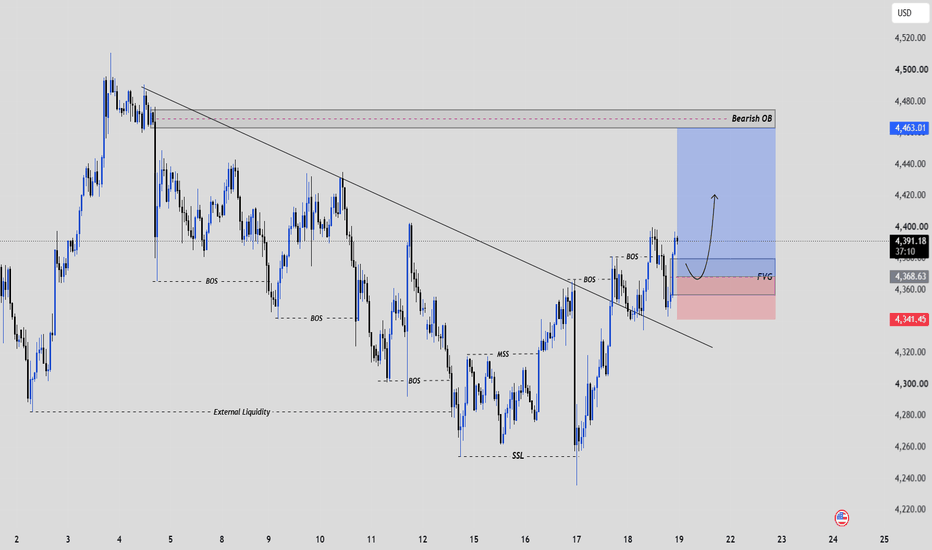
Long