Gold Reclaims Structure — Is Liquidity Next?Timeframe: 2H XAUUSD
Price recently swept sell-side liquidity around the 4,250–4,270 area and reacted strongly.
Strong bullish displacement followed, showing a shift in short-term momentum.
Price has now reclaimed the 4,360–4,380 structure area, giving a bullish BOS/reclaim signal.
The broader structure is still mixed, but the short-term order flow has turned bullish with the latest higher low and impulsive move.
🔑 KEY LEVELS:
🟢 Bullish Demand / Order Block: 4,270–4,315
🔵 Reclaim / Confirmation: 4,360–4,380
🔴 Buy-Side Liquidity / Resistance: 4,470–4,500
⚠️ Major invalidation area: Below 4,250
Previous local highs around 4,400–4,430 may act as intermediate resistance.
🎯 TRADE SETUP — Bullish Scenario:
Entry: 4,340–4,365 on a confirmed pullback/retest
Stop Loss: 4,265
TP1: 4,400
TP2: 4,430
TP3: 4,480–4,500
Risk/Reward: Approximately 1:1 to TP1, 1:1.5 to TP2, and 1:2.5+ to TP3, depending on entry.
🚀 POSSIBLE NEXT MOVE:
Bullish: If price holds above the reclaimed 4,360–4,380 zone and prints bullish confirmation on a retest, continuation toward 4,400 → 4,430 → 4,480+ liquidity becomes the scenario to watch.
Bearish: If price fails to hold the reclaim and breaks back below the recent displacement base, a deeper retracement toward the 4,270–4,315 demand/order block becomes possible.
⚠️ INVALIDATION:
A decisive 2H close below the 4,250–4,270 liquidity-sweep low would invalidate the bullish structure and suggest the sell-side liquidity sweep failed.  Long
Long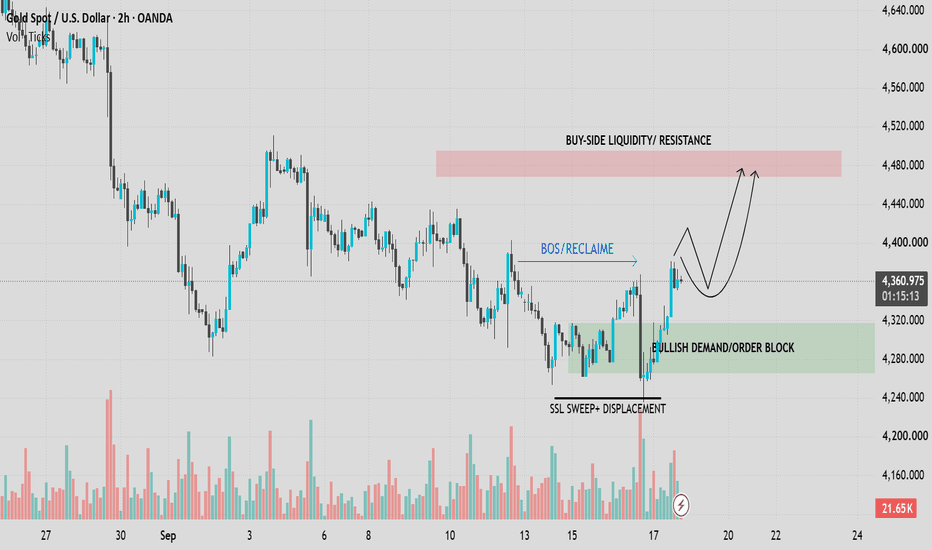
Gold (XAUUSD) 1H: Demand Zone Hold & Resistance Target ($4,400)Gold is showing a potential bullish continuation setup on the 1H chart.
After the previous bearish structure, price formed a liquidity sweep near the 4,260 area followed by a bullish CHOCH and a strong recovery. Price then moved within an ascending channel and is now consolidating around a key demand zone near 4,340–4,355.
As long as this demand zone holds, the setup points toward a potential move higher, with 4,400 resistance marked as the primary target area.
Key Levels:
- 🟦 Demand Zone: 4,340–4,355
- 🔴 Resistance: 4,400
- 🎯 Target: 4,400
- 📈 Structure: Bullish after CHOCH + liquidity sweep
A decisive break below the demand zone would weaken this bullish scenario. Long 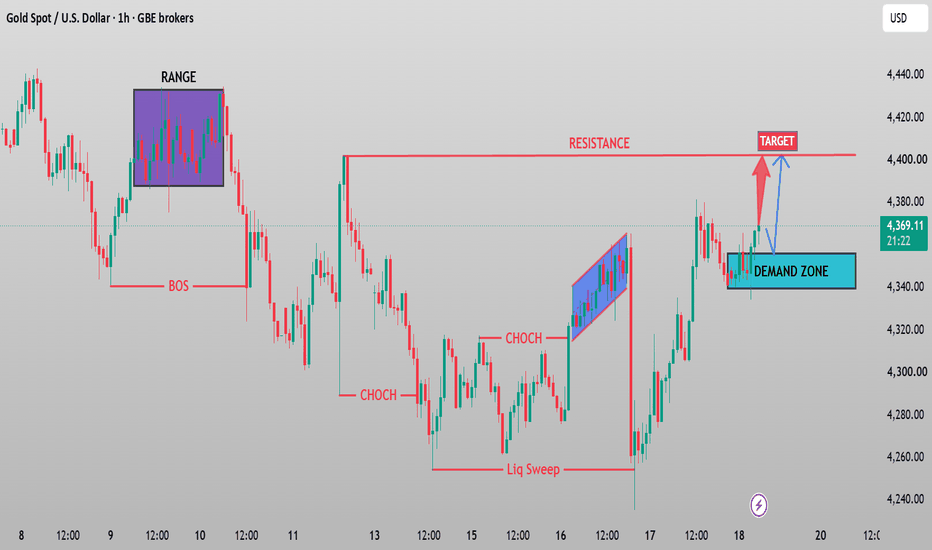
Long 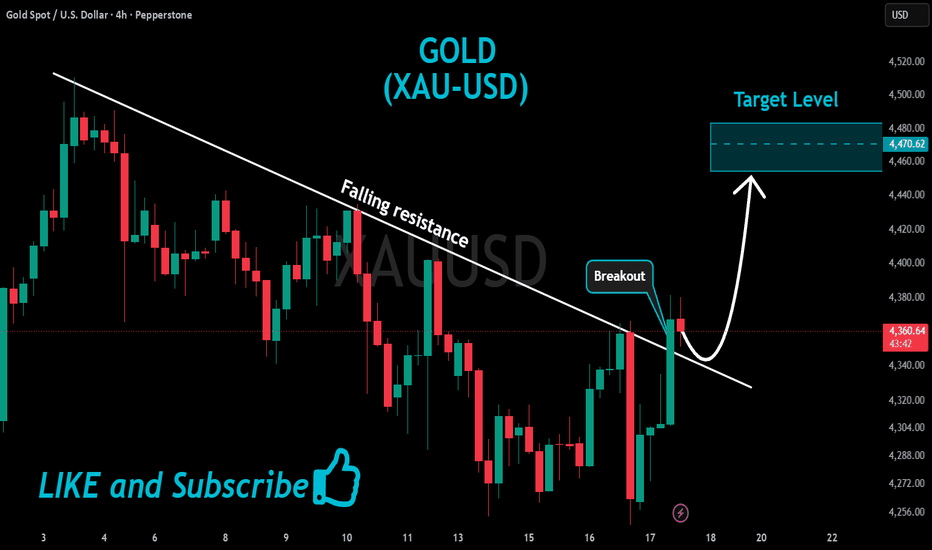
Long 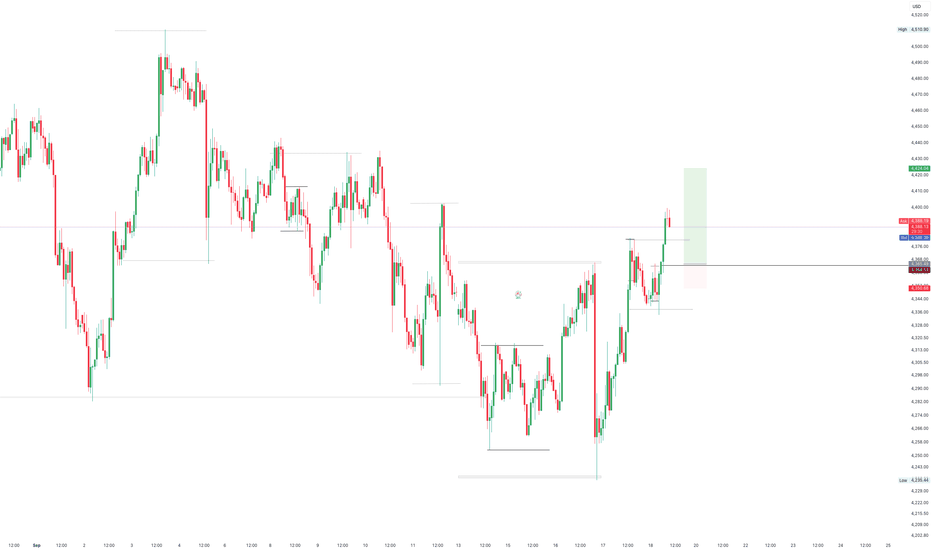
XAU/USD — 45-Minute ChartGold is currently trading near the 4,390–4,395 area, where the chart shows a previously marked supply/resistance zone.
Price has recently pushed upward into this area after recovering from the lower demand zones. The reaction around the current zone is important because it could determine whether the recent upward move continues or begins to retrace.
Key levels marked on the chart:
🔴 Resistance / Supply: 4,425–4,440
🟣 Current reaction zone: around 4,380–4,395
🟣 Intermediate demand: 4,305–4,320
🟣 Major demand: 4,250–4,265
🎯 Chart target area: around 4,252
⚠️ Invalidation area: above approximately 4,427
🔎 Scenario
The chart is outlining a bearish retracement scenario from the current resistance area. If price fails to maintain the current zone and develops clear rejection, attention could shift toward the lower marked areas. Long 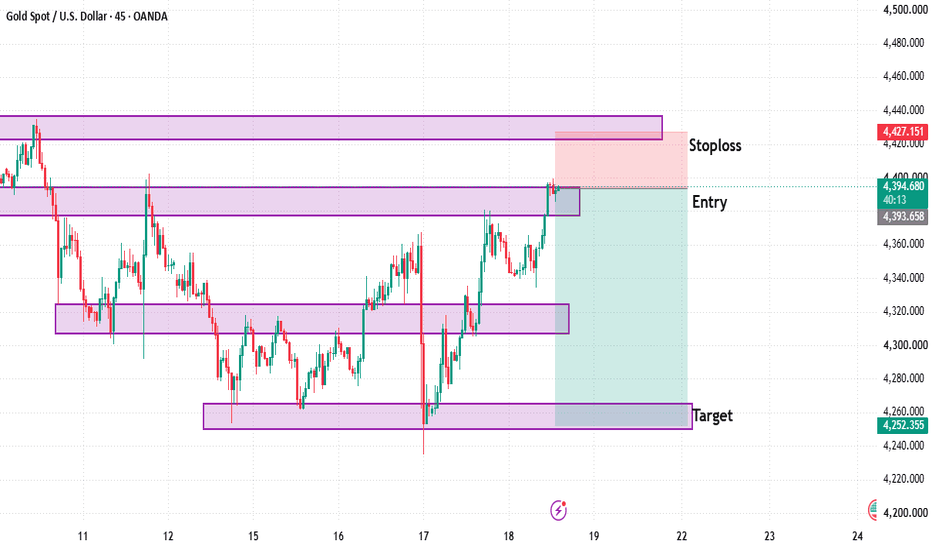
Long 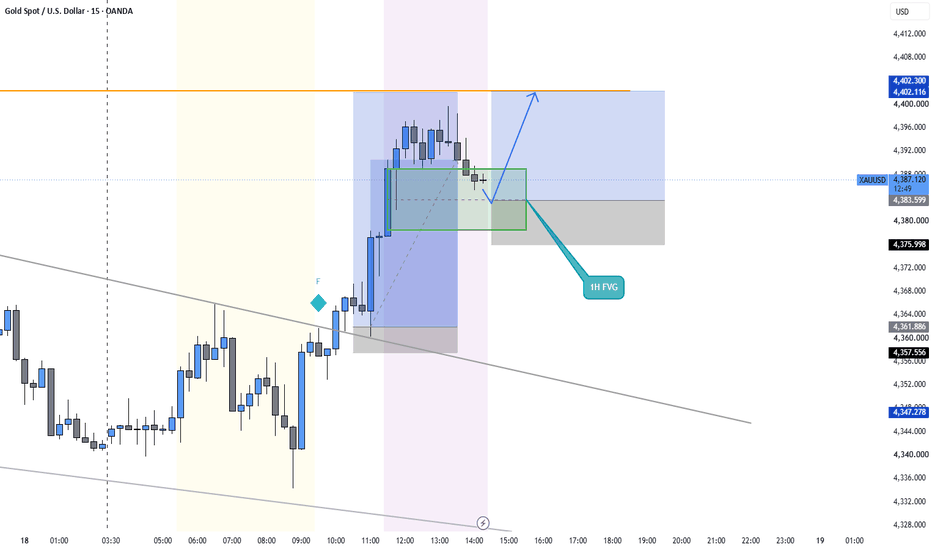
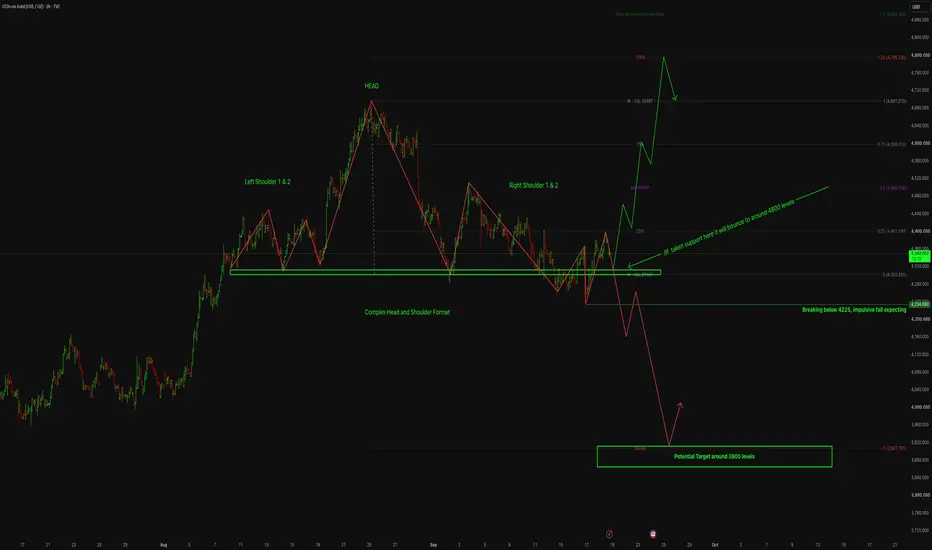
Gold – Complex Head & Shoulders Setup - 2 hoursThe chart shows a potential complex Head & Shoulders formation, with the neckline/support zone around 4,300–4,320 acting as the key decision area.
Gold is currently trading above this support, and if the zone continues to hold, the chart suggests a possible bounce toward 4,480, followed by higher levels around 4,600–4,700.
The bullish scenario strengthens if price sustains above the neckline and develops higher highs.
On the other hand, a decisive break below 4,225 could invalidate the bullish recovery scenario and potentially trigger an impulsive decline toward the marked 3,900 zone.
Therefore, 4,300–4,320 is the critical support area to watch for confirmation.
Idea Rating: 8.5/10
Disclaimer: This is a technical-analysis idea for educational purposes only and is not financial or investment advice. The projected direction and targets are possible scenarios, not guaranteed outcomes. Please do your own analysis and use appropriate risk management before making any trading decision. Short 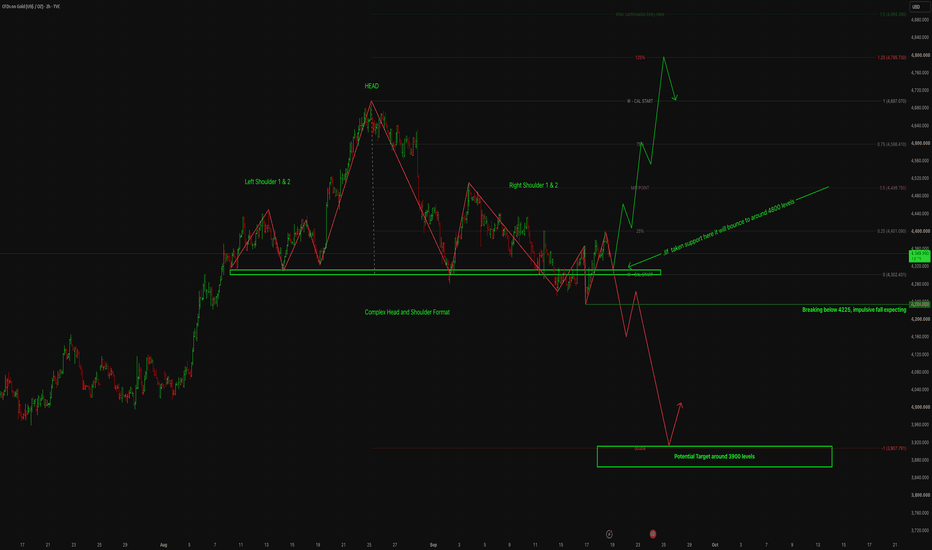
XAUUSD Key Level & Detailed Analysis## MARKET STRUCTURE
Gold is trading around **$4,317–$4,328**, rebounding from the **$4,235–$4,266** demand zone after the FOMC selloff. The recovery remains corrective, with price still below the **$4,368** CHOCH level and last week’s **$4,430** high. The broader structure remains neutral-to-bearish.
## KEY LEVELS
**Support:** $4,235 / $4,266
**FVG:** $4,271–$4,310
**Resistance:** $4,335 / $4,368 / $4,400
**Buy Zone:** $4,235–$4,266
**Sell Zone:** $4,335–$4,368
A daily close above **$4,368** would signal a meaningful structure shift, while a break below **$4,235** would reopen downside risk.
## DXY & YIELDS
DXY is holding around **100.15–100.32**, with resistance near **100.34–101.00**. US 10Y yields remain close to **5%**, keeping pressure on gold. A stronger dollar and elevated yields can continue to limit upside unless yields begin to ease.
## FED & MACRO
The Fed delivered a **25bp hike to 3.75%–4.00%**. The dot plot remains hawkish, with **16 of 18 officials seeing another hike in 2026**. Markets are now focused on whether another hike, potentially in October, becomes further priced in.
Today’s key catalysts are **US Jobless Claims, Philly Fed, and housing data**, followed by the **BOJ decision later this week**.
## GEOPOLITICAL & GOLD DEMAND
Geopolitical uncertainty and elevated oil prices continue to provide some safe-haven support, but the inflation impact of higher oil prices can also reinforce the Fed’s hawkish stance. Meanwhile, reported Chinese gold demand provides a medium-term physical-demand tailwind.
## TRADE BIAS
**Neutral-to-bearish below $4,368.**
Below **$4,335–$4,368**, rallies remain vulnerable to selling. A sustained reclaim of **$4,368** would weaken the bearish structure and open the path toward **$4,400+**.
**Key Support:** $4,235–$4,266
**Key Resistance:** $4,335–$4,368
**Major Invalidation:** Daily close below $4,235 or above $4,368
## CONCLUSION
Gold is attempting to recover after the FOMC selloff, but the broader structure remains **neutral-to-bearish below $4,368**. Strong DXY and elevated US yields continue to limit upside, while geopolitical risk and physical demand provide some support.
A sustained break above **$4,368** could shift momentum toward **$4,400**, while failure below **$4,335** keeps the downside structure active toward **$4,266–$4,235**.
**KEY LEVEL TO WATCH: $4,368 — STRUCTURE SHIFT**
*Not financial advice. Manage risk carefully.*
Gold 6H Flips BUY After Previous SELL Hits T2 — $4,513 Next?Gold has given me a fresh 6H BUY signal after the previous SELL completed its downside targets.
What I like about this setup is the sequence. Gold sold off into the recent lows, swept that area, recovered strongly, and the indicator has now reversed to a FAST · EARLY BUY at $4,369.90 .
Entry: $4,369.90
Invalidation: $4,226.95
T1: $4,513.14
T2: $4,656.09
Price is currently around $4,397, so the trade has started moving in the right direction, but I still consider it early.
The area I’m watching most closely now is $4,430–$4,450. There is clear resistance there, and I’d like to see Gold break and hold above it before becoming more confident about a move toward $4,513.
If that resistance breaks, $4,513 is my first target, followed by $4,656.
On the other hand, if Gold gets rejected again and falls back below the $4,350–$4,370 area, I’ll become more cautious. The main structural invalidation remains at $4,226.95.
What makes this particularly interesting for me is that the previous SELL reached its target before the indicator eventually reversed BUY. So this isn’t simply a permanent bullish bias — the market structure has actually changed.
For now I’m bullish, but I want to see how Gold behaves around $4,430–$4,450 .
What do you think? Do you see Gold breaking through this resistance and heading toward $4,513, or do you think another rejection is coming?
Always interested to hear different views.
Not financial advice. Long 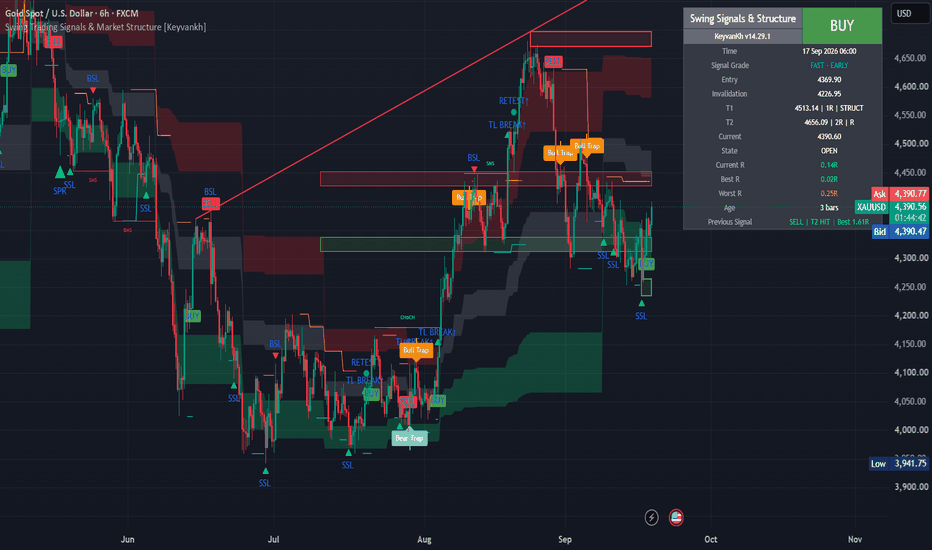
XAUUSD 30M | Bullish Channel Retest & Continuation ScenarioGold continues to respect the ascending channel structure after a strong impulsive move from the major demand zone near 4,235.
Price is currently retesting a key support area around 4,370, which aligns with previous resistance turned support inside the bullish channel. As long as buyers continue defending this zone, the structure favors a potential continuation toward higher resistance levels.
The current idea focuses on trend continuation, channel support, and a possible rotation into overhead supply zones.
🎯 Targets
✅ Target 1: 4,395
✅ Target 2: 4,425
✅ Target 3: 4,440
📌 Confluences:
Bullish ascending channel
Support retest holding
Higher highs and higher lows intact
Resistance turning into support
Note: This is a personal market outlook for educational purposes only, not financial advice. Long 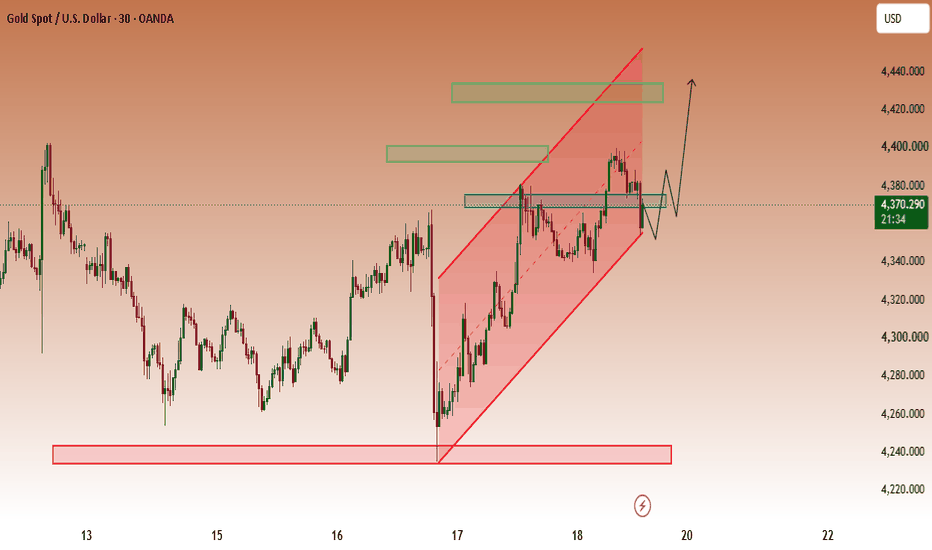
Short 
XAUUSD BUY Setup — Support Bounce Toward 4,440Based only on the chart you uploaded, the structure is bullish after the sharp rejection from the 4,350–4,360 support zone, but price is currently in a pullback/retest phase.
Key levels
🟢 Support: 4,350–4,360
🟡 Current area: ~4,372.69
🔴 Resistance: 4,390–4,400
🎯 Major target shown: ~4,438–4,442
Price structure
Price broke upward from the earlier 4,340–4,360 consolidation.
It rallied strongly toward 4,395–4,400.
A correction followed, creating lower highs.
Price then dropped sharply into 4,350–4,360, where buyers reacted strongly.
The rebound back above 4,370 suggests the support zone is being defended.
BUY setup
A more conservative bullish confirmation would be:
4,350–4,360 holds → price breaks 4,380 → then 4,390–4,400.
If momentum continues above 4,400, the chart's projected 4,438–4,442 zone becomes relevant.
Risk / invalidation
If price breaks and sustains below 4,350, the bullish setup shown on the chart becomes significantly weaker. I would not treat the blue projected arrow as a guarantee; it's simply the chart's proposed path.
Important: the screenshot itself is timestamped March 18, 2026, so this is analysis of that historical chart—not a claim about XAUUSD's price today. Long 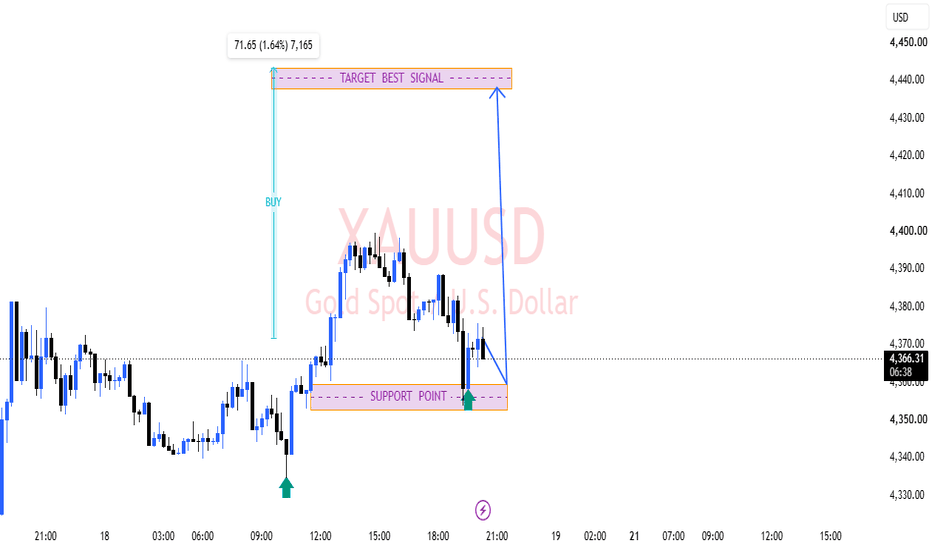
Long 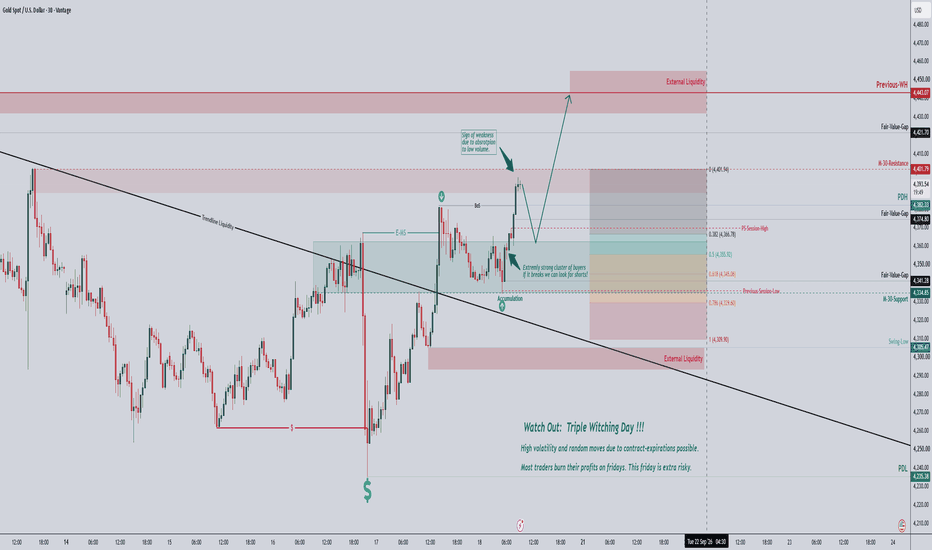
Short 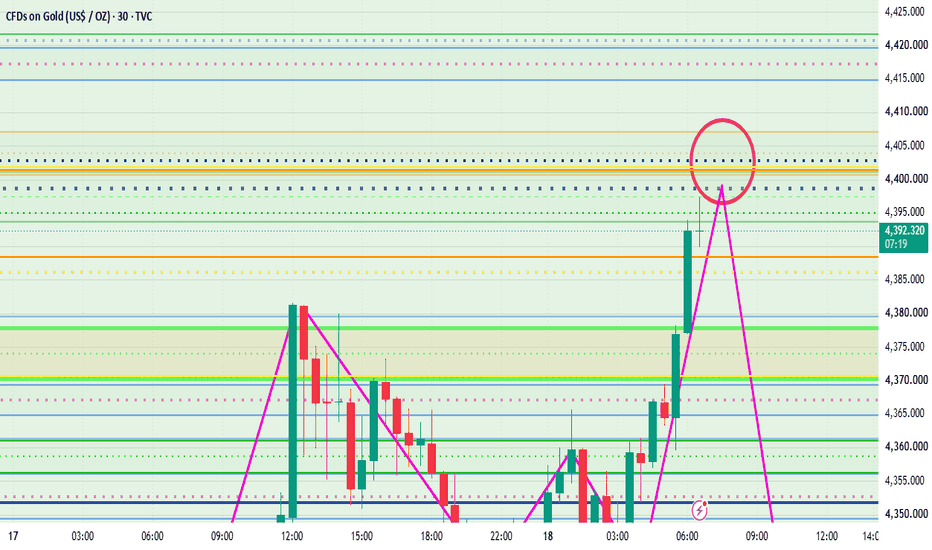
Gold M30: 4,380 Breakout or Liquidity Trap?
Gold has recovered sharply after the post-FOMC volatility, but the next move may be decided around 4,370–4,380.
M30 structure has shifted higher, with buyers recovering from the 4,245–4,260 area and building a sequence of higher highs.
But price is now approaching the 0.5–0.618 Fibonacci zone.
That creates an important decision point.
The bullish case
If M30 closes above 4,380 and successfully retests the zone:
4,380 → 4,400 → 4,410–4,420
A sustained breakout could then expose the 4,445–4,460 Fibonacci extension.
The trap scenario
A sweep above 4,370–4,380 without a clean M30 close could become a liquidity grab.
If price loses 4,350, attention shifts back toward:
4,335 → 4,320 → 4,300
The key is not simply whether Gold reaches 4,380.
It is how price reacts after reaching it.
Break and hold — or sweep and reject? Long 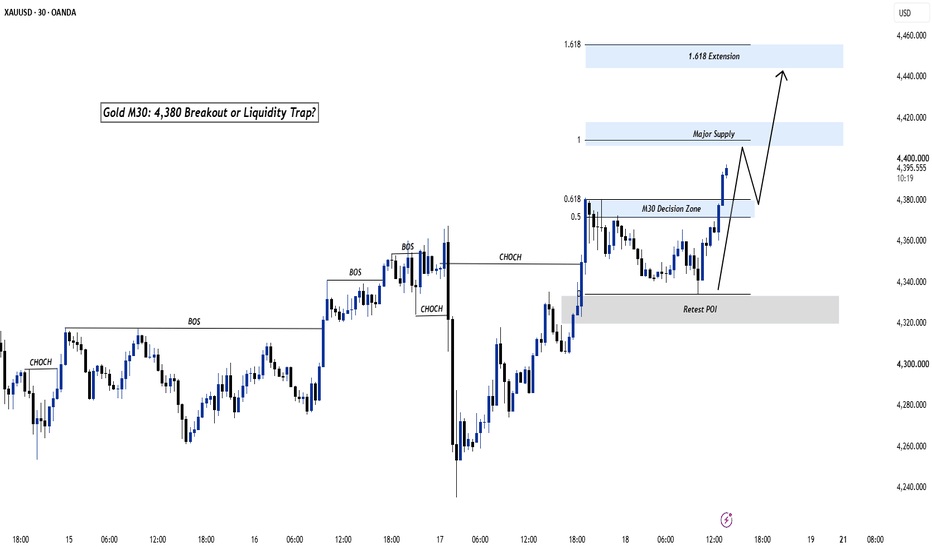
MESZ Sep 18: Can 7680 Hold for a Bounce Toward 7738?MESZ is trading around 7,700 after a sharp short-term sell-off.
The first downside liquidity and reaction level I’m watching is around 7,680. Price could test that area before deciding on the next directional move.
If buyers defend 7,680, the first upside liquidity target sits around 7,738.
The more important downside level is 7,656. A confirmed 1-hour or 4-hour close below that area would invalidate my short-term bullish setup and shift the structure bearish.
Key levels
7,680 — first pullback / reaction level
7,738 — upside liquidity target
7,656 — bullish invalidation
Bullish scenario: Hold 7,680–7,656 → watch for continuation toward 7,738.
Bearish scenario: Lose 7,656 with confirmation → stop looking for the bullish bounce and respect further downside.
Not financial advice. No confirmation, no trade. CME_MINI:MESZ2026  Long
Long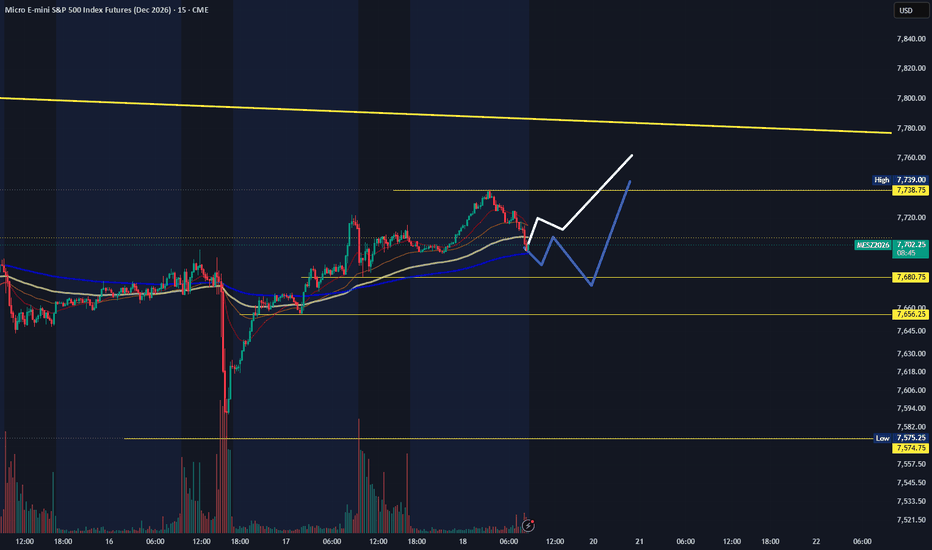
NQ Futures — Channel Zone, Breakout Needed | September 2026Update on NQ 👇
NQ is locked inside a Channel Zone between 29,850 and 28,956 on the Daily. Price attempted a breakout above 29,850 — it failed and got rejected back into the channel.
The channel has been respected multiple times — both sides tested and rejected. Until a confirmed breakout happens, this is a no-trade zone in the middle.
Two scenarios:
🟢 Bullish — clean break and daily close above 29,850 with volume → confirmed breakout → continuation toward 30,500+
🔴 Bearish — break below 28,956 support → channel collapses → next meaningful support significantly lower
Key levels:
Channel top: 29,850 (breakout failed once already)
Channel bottom: 28,956
Volume profile heavy in the middle — no edge trading inside the range
Wait for the breakout confirmation. Don't trade the middle of a channel. XAUUSD 4384 recovery — 4475 is the trap XAUUSD 4384 recovery — 4475 is the trap
Gold is trying to breathe again.
After the heavy selloff into the 4,235 area, price finally found a reaction base and started pushing back above the old sellside liquidity zone. That recovery matters. Sellers did not get a clean continuation lower, and buyers are now trying to rebuild structure around 4,350 - 4,385.
But I still don’t see a clean bullish market yet.
Price is sitting under the next liquidity pocket, and the chart is showing a possible recovery into resistance first, not a free breakout. The first key level is 4,422. If gold can reclaim that area, the next draw is 4,475 — and that is where I would start paying close attention.
Why?
Because 4,475 is not just a target. It is also a trap zone.
That area sits above recent buy-side liquidity, and if price runs into it while traders chase late buys, sellers may use that move as a better short entry. With market caution still strong after the Fed decision, plus oil and geopolitical headlines creating unstable flows, gold can spike first and reverse fast.
Main bias: short-term recovery while gold holds above 4,300 - 4,330.
But the bigger structure still needs confirmation. A push into 4,422 - 4,475 can happen, but I don’t want to chase the move after it is already extended.
Trading scenario:
Buy idea only if gold holds above 4,330 and breaks 4,422 with clean candles.
Entry zone: 4,350 - 4,422 after confirmation
Deeper buy zone: 4,300 - 4,330 if price sweeps and reclaims
Stop loss: below 4,280
TP1: 4,422
TP2: 4,475
Sell reaction only if gold reaches 4,475 and rejects hard.
Sell zone: 4,422 - 4,475 after rejection
Stop loss: above 4,500
TP1: 4,350
TP2: 4,300
TP3: 4,260 if bearish momentum returns
No reclaim, no chase.
No rejection, no sell.
If gold breaks below 4,280 with pressure, the recovery idea is cooked. Then sellers can target the lower liquidity again.
For now, I’m reading this as a recovery from the 4,235 low, but 4,475 is where the real test begins.
You think gold grabs 4,475 first, or rejects before touching the trap?
Long 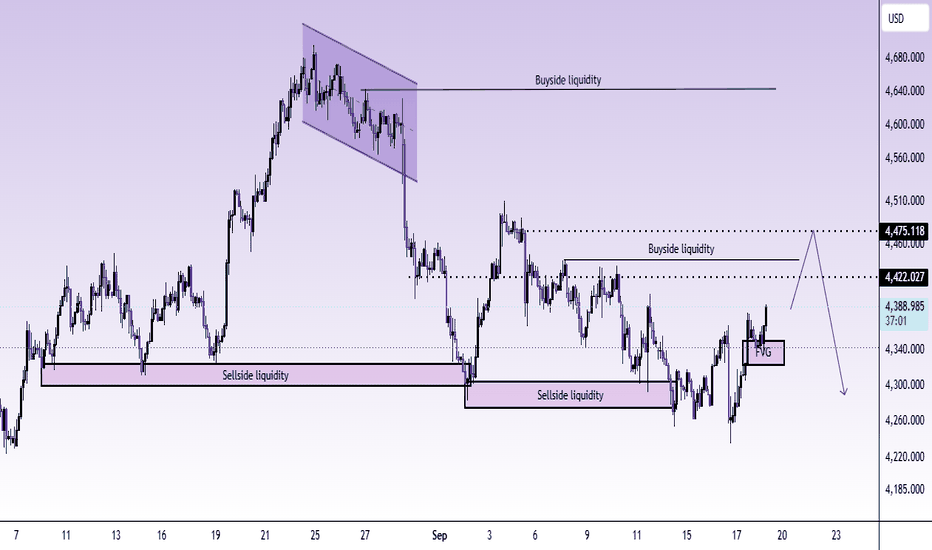
Short 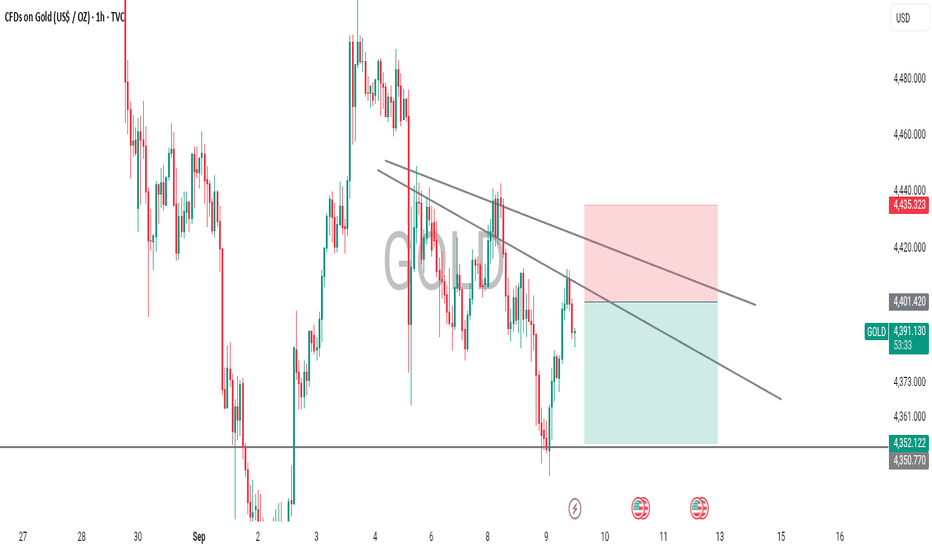
Top 20 Chart Patterns | Professional Educational AnalysisChart patterns are an important part of technical analysis because they help traders study price behavior around support, resistance, trendlines, and changing market momentum
This guide highlights 20 widely observed chart formations, including Ascending Triangle, Descending Triangle, Symmetrical Triangle, Rising Wedge, Falling Wedge, Bull Flag, Bear Flag, Cup and Handle, Inverse Cup and Handle, Double Top, Double Bottom, Head and Shoulders, Inverse Head and Shoulders, Triple Top, Triple Bottom, Rectangle, Channel Up, Channel Down, Diamond Top, and Diamond Bottom
Each formation can provide a different perspective on market structure and potential continuation or reversal behavior
Continuation patterns generally develop when price pauses or consolidates within an existing trend before potentially continuing in the same direction
Reversal formations can appear when the existing trend begins to lose momentum and price starts showing signs of a possible structural change
Neutral formations such as symmetrical triangles and rectangles can develop while the market remains undecided, with price waiting for a clearer breakout or breakdown
A professional approach is to avoid treating any individual pattern as an automatic entry signal
Instead, traders can observe how price reacts around important levels and wait for clear confirmation before considering the next market direction
Breakouts should be monitored carefully because not every breakout results in sustained momentum
A price move beyond resistance can fail and return inside the formation, while a breakdown below support can also become a false move
For this reason, confirmation through price action, market structure, momentum, and higher timeframe context can provide additional information when evaluating a pattern
Risk management is also an essential part of technical analysis
Position size should always be considered according to individual risk tolerance, and invalidation levels should be identified before making any trading decision
The main purpose of studying chart patterns is not to predict the market with certainty, but to understand possible price structures and prepare for different scenarios
Educational Analysis only
This content is provided for educational and informational purposes and should not be considered financial or investment advice
Markets can move unpredictably, and technical patterns do not guarantee a particular outcome
Always conduct your own research and apply appropriate risk management before making any trading decision Education 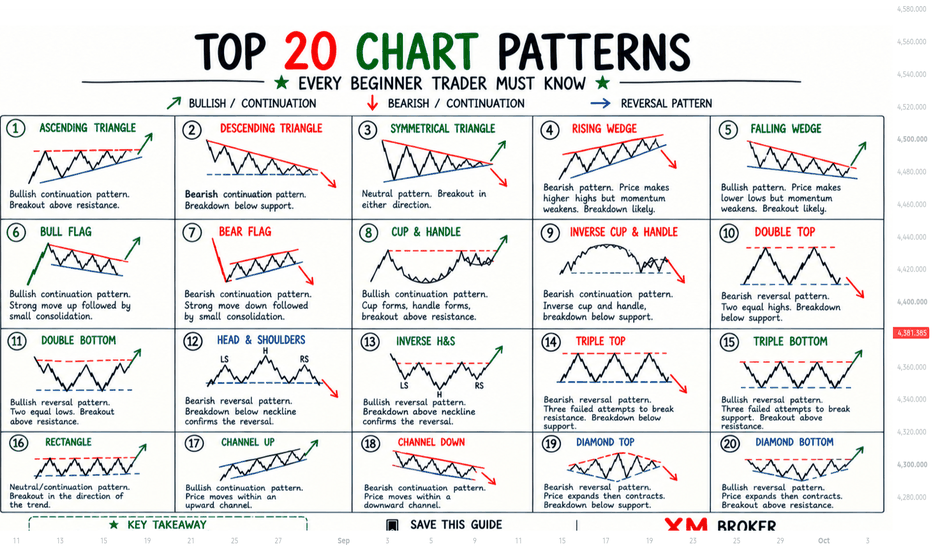
XAUUSD UPDATEGold (XAU/USD) on the 4H chart rallied strongly from around 4,300 in mid-August to a high near 4,650 by late August, before pulling back sharply and consolidating through most of September in a broad range roughly between 4,250 and 4,450. Fibonacci retracement levels drawn from the swing low to high show price currently trading right around the 0.5 level (4,378.25) at 4,376.695, after recently bouncing off support near the 0.236 level (4,308.86) and the swing low around 4,246. Price has pushed back up into a supply/resistance zone (the upper blue box, roughly 4,395–4,410) that capped rallies earlier in September, with the arrow pointing down toward a smaller marked zone near 4,315–4,335, suggesting the chart anticipates a pullback from current resistance toward that lower box. Overall, gold looks to be consolidating in the middle of its recent range, with the 0.5 Fib and the 4,395–4,410 supply zone acting as the key level to watch for a rejection versus a breakout toward the 0.786 level (4,455.50). Short 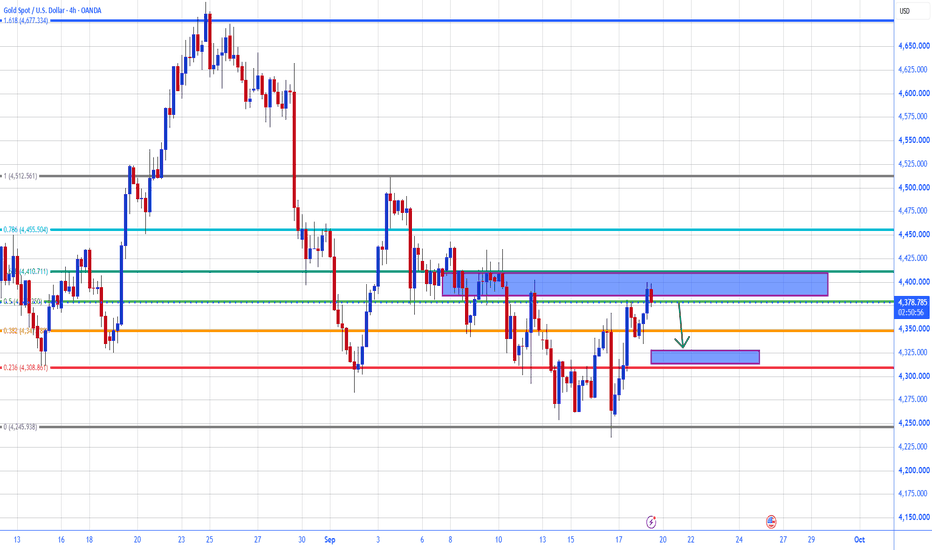
XAUUSD Short: Supply Zone Rejection Targets 4,200 DemandHello traders! Here’s my technical outlook based on the current XAUUSD (1H) chart structure. XAUUSD previously traded inside a range before breaking higher and later forming descending channels with multiple breakouts. Price then tested the Supply Zone near 4,320, where sellers rejected the upside.
Currently, XAUUSD is trading below the 4,320 Supply Zone while holding above the 4,200 Demand Zone. The recent rejection and descending channel structure suggest a possible continuation lower toward demand.
As long as XAUUSD remains below 4,320 and respects the descending channel, the bearish scenario remains valid. A continuation lower could push price toward 4,200 (TP1). However, a breakout above 4,320 would weaken the bearish outlook. Manage your risk! Short