Gold bulls defend 4,290 — the road to 4,520 Begins!Current Price: ~4,332
Timeframe: 1H
Bias: 🟢 Potentially Bullish Above 4,290–4,315
🟢 Market Structure
XAUUSD remains in a broader corrective structure, but price is currently reacting from the 4,290 demand zone. This area has previously attracted strong buying pressure and is the key zone for the bullish scenario.
The chart shows multiple BOS (Break of Structure) points and several FVGs, indicating areas where price may react during future retracements.
🔥 Key Demand Zone — 4,290
4,290 is the major demand zone.
As long as price continues to defend this area, buyers have an opportunity to regain control. A strong bullish reaction from the current support region could initiate another upward leg.
🟢 Immediate Support — 4,315–4,330
The current price is sitting close to the 4,315–4,330 support area.
Holding this zone would provide the first indication that buyers are defending the recent lows.
🎯 Upside Levels
If buyers regain momentum, the important upside levels are:
TP1: 4,400
TP2: 4,450
TP3: 4,520
Major resistance: 4,650–4,680
A sustained move above 4,400 would improve the short-term bullish structure. A breakout and successful retest of 4,450 could provide stronger confirmation toward 4,520.
🧠 SMC Analysis
The overall sequence can be viewed as:
Bearish Expansion → Demand Zone → Liquidity Reaction → Bullish Attempt → FVG Retests → Potential Continuation
The marked FVGs around the previous bullish displacement areas can potentially act as retracement/reaction zones.
The bearish order block around 4,560–4,590 remains an important resistance area if price moves significantly higher.
🔴 Important Resistance / Supply
4,450: Immediate major resistance.
4,500–4,520: Supply/reaction area and projected target region.
4,650–4,680: Major resistance zone and potentially strong selling area.
🚨 Bearish Invalidation
The bullish scenario becomes weak if price decisively breaks below 4,290 and holds beneath the demand zone.
A sustained break below 4,290 would suggest that the demand zone has failed and could lead to another bearish expansion.
📌 Final Outlook
XAUUSD is at a critical decision zone. The 4,290 demand area is the key level for buyers. If 4,315–4,330 continues to hold and price reclaims 4,400, the next potential targets are 4,450 → 4,520, with 4,650–4,680 representing the major resistance zone.
🟢 Key Demand: 4,290
🟢 Immediate Support: 4,315–4,330
🎯 Target 1: 4,400
🎯 Target 2: 4,450
🎯 Target 3: 4,520
🔴 Major Resistance: 4,650–4,680  Long
Long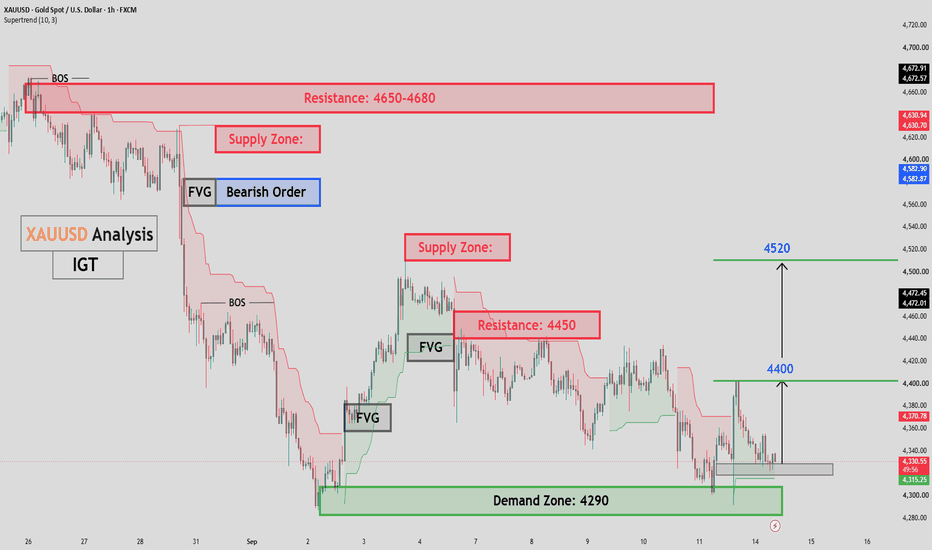
Best Free Volatility Indicator on TradingView
This free technical indicator will help you easily measure the market volatility on Forex, Gold or any other market.
It will show you when the market is quiet, when it's active and when it's dangerous .
We will go through the settings of this indicator, and you will learn how to set it up on TradingView.
Historical Volatility Indicator
This technical indicator is called H istorical Volatility.
It is absolutely free and available on TradingView, MetaTrader 4/5 and other popular trading terminals.
TradingView Setup
Let me show you how to find it on TradingView and add it to your price chart.
Open a technical price chart on TradingView and open the "Indicators" menu (you will find it at the top of the screen).
Search " Historical Volatility " and click on it.
It will automatically appear on your chart.
Double-click on the indicator and a settings menu will appear.
"Length" parameter will define how many candles the indicator will take for measuring the average volatility. (I recommend keeping the default number, but if you need longer/shorter-term volatility, you can play with that)
Timeframe drop-down list defines what time frame the indicator takes for measuring the volatility. (I recommend choosing a daily timeframe)
And keep the checkboxes unchanged .
How to Use the Indicator
Now, let me show you how to use it properly.
Widen the indicator and analyse its movement at least for the last 4 months.
Find the volatility range - its low levels will be based on the lower boundary of the range, high levels will be based on its upper boundary.
This is an example of such a range on USDCAD pair.
When the volatility stays within the range, it is your safe time to trade.
When volatility approaches its lows , it may indicate that the market might be slow .
Highs of the range imply that the market is very active .
In-between will mean a healthy market.
The Extremes
The violation of a volatility range to the downside is the signal that the market is very slow. This would be the recommended period to not trade because of high chance of occurrence of fakeouts .
An upward breakout of a voliatlity range is the signal of the extreme volatility . It will signify that the market is unstable, and it will be better to let it calm down before placing any trade.
Volatility Analysis
That is how a complete volatility analysis should look.
At the moment, volatility reached extreme levels on CADJPY pair.
The best strategy will be to wait till it returns within the range.
Remember This
With the current geopolitical uncertainty and trade wars, market volatility reaches the extreme levels.
Such a volatility is very dangerous, especially for newbie traders.
Historical volatility technical indicator will help you to easily spot the best period for trading and the moment when it is better to stay away.
❤️Please, support my work with like, thank you!❤️
I am part of Trade Nation's Influencer program and receive a monthly fee for using their TradingView charts in my analysis.
Education 
XAUUSD — Bullish Fibonacci Retest After Post-Fed RecoveryFundamental Analysis
Gold is holding its post-Fed recovery as oil prices and U.S. Treasury yields cool from recent highs, reducing some of the immediate pressure on non-yielding assets. The U.S. 10-year yield has retreated toward 4.93% after briefly trading above 5%, while softer oil prices have eased part of the inflation concern that dominated markets earlier this week.
However, the broader macro backdrop remains restrictive. The Fed raised rates 25 bp to 3.75%–4.00% and signaled that additional tightening remains possible, while global central banks continue to lean hawkish as inflation risks persist. This should keep XAUUSD sensitive to changes in the dollar, yields and energy prices.
Technical Analysis
On H1, XAUUSD is trading near 4,380 after extending the bullish recovery and producing a BOS above the 4,377 structure level.
Price pushed toward 4,390–4,400 before beginning a controlled pullback. The cleaner continuation area now sits around 4,355–4,367, where the Fibonacci 0.618 level near 4,356 overlaps the marked buy zone and rising support structure.
If buyers defend this zone, price may rotate back toward 4,390, followed by the major 4,410 liquidity/high.
A deeper correction could reach the 4,323–4,342 H1 FVG, but this remains secondary support rather than the primary setup.
Important Key Levels
4,410 — Main bullish target / liquidity
4,389–4,400 — Immediate resistance
4,377 — Short-term pivot
4,355–4,367 — Main buy zone
4,342 — Fib 0.786 / support
4,323–4,342 — H1 FVG
Below 4,338 — Immediate bullish invalidation
Trading Scenario
Main Buy Setup
Entry: 4,355–4,367
Stop Loss: 4,338
Take Profit 1: 4,389
Take Profit 2: 4,400
Take Profit 3: 4,410
Buy Condition
Wait for a controlled retracement into 4,355–4,367 and clear bullish confirmation.
A liquidity sweep, long lower wick, bullish engulfing candle, or H1 reclaim above 4,367 may confirm renewed buyer pressure.
If price breaks and holds below 4,338–4,342, the immediate bullish continuation setup should be reassessed.
Overall View
The H1 structure has shifted toward bullish continuation after the post-Fed recovery and break above 4,377.
The preferred plan is not to chase price around current resistance. A pullback into 4,355–4,367 offers a cleaner location to look for continuation toward 4,389–4,400, with 4,410 as the main liquidity objective.
Lower oil and yields currently support the recovery, but the Fed’s hawkish policy stance still limits confidence in a one-way bullish move.
Do you expect 4,355–4,367 to hold before Gold attacks 4,410? Long 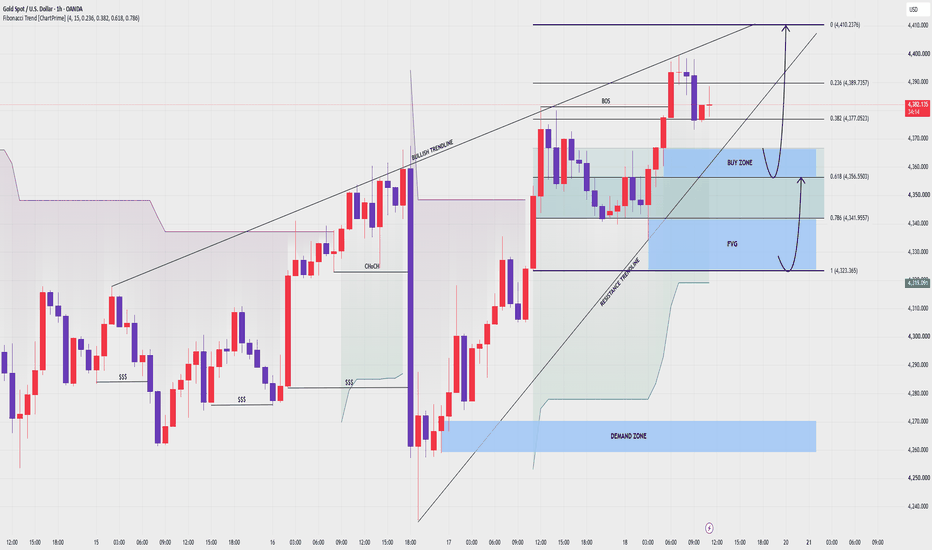
Silver XAGUSD | 21–25 Sep 2026Last Week Recap | 14–18 Sep 2026
Silver traded with high volatility and came under pressure early in the week as the US Dollar and Treasury Yields moved higher, while expectations of a Fed rate hike weighed on precious metals. Silver declined toward the $63–64/oz area before the Fed raised interest rates by 25 bps to 3.75–4.00% as expected.
Toward the end of the week, Silver recovered alongside Gold as the US Dollar and Treasury Yields began to ease, while lower oil prices helped reduce inflationary pressures. Spot Silver rebounded toward $66.70/oz and closed the week higher at $66.22/oz.
Fundamental Analysis | 21–25 Sep 2026
Bias: Sideway to Bullish
This week, Silver will continue to be influenced by the direction of the US Dollar and Treasury Yields following the Fed's rate hike. Markets are still pricing in the possibility of additional rate hikes, which could limit Silver's upside in the short term. However, a slowdown in the Dollar and Treasury Yields would provide support for precious metals.
On the US economic data front, markets will focus on Flash Manufacturing/Services PMI, Initial Jobless Claims, and Durable Goods Orders, along with comments from several Fed officials, which could influence interest-rate expectations and the US Dollar.
Silver could also receive support from industrial demand if the manufacturing sector continues to expand. Meanwhile, safe-haven demand and lower oil prices could help ease inflationary pressures. However, stronger-than-expected US economic data and increasingly hawkish signals from the Fed could push Treasury Yields and the US Dollar higher, putting renewed pressure on Silver.
Overall: Silver could remain Sideway to Bullish if the US Dollar and Treasury Yields continue to weaken. The $66–67/oz area remains an important resistance zone to watch. On the other hand, a renewed strengthening of the Dollar and Treasury Yields could trigger another round of selling pressure in Silver.
Technical Analysis — XAGUSD 4H
XAGUSD maintains a Sideway to Bullish outlook, with price continuing to trade above the EMA200 and the uptrend line, indicating that the medium-term bullish structure remains intact. In the short term, Silver is recovering from the support zone.
If price holds above $65.73, Silver could move higher to test resistance at $67.32 and $68.32. A breakout above $68.32 could open the way for further upside.
Conversely, if price breaks below $65.16, Silver could decline toward the uptrend line and the next support level.
Bias: Sideway to Bullish
Resistance: 67.32 / 68.32
Support: 65.73 / 65.16
Target: 68.32
Cut Loss: Below 65.16  Long
Long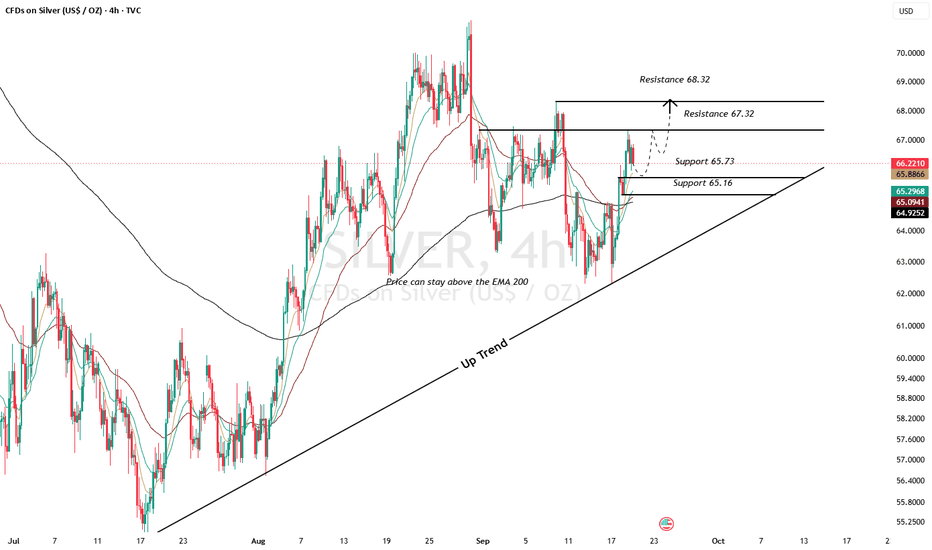
Short 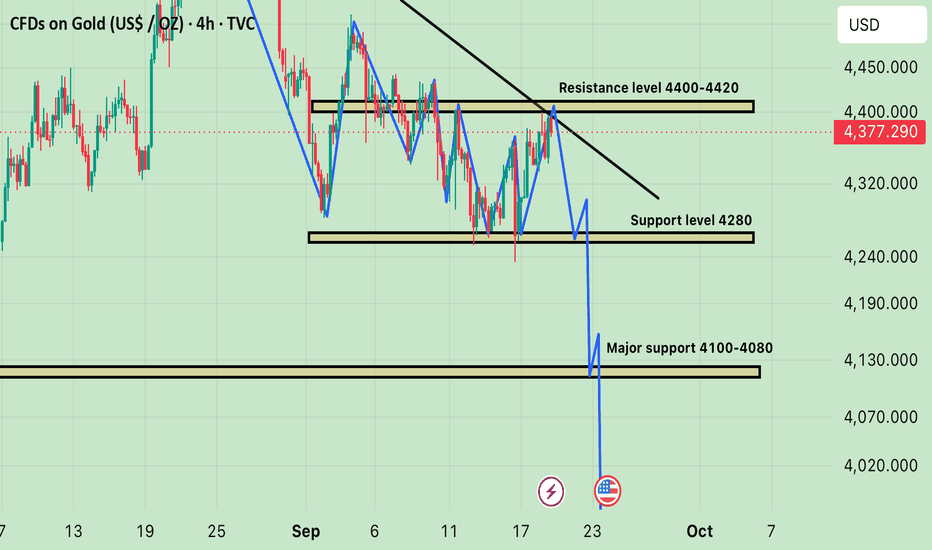
XAUUSD — Sell Pressure Below 4,300
Gold is still trading with a bearish intraday structure after failing to reclaim the upper liquidity zone. From Kelly’s view, the chart suggests that XAUUSD remains under selling pressure, and the current rebound is likely just a temporary pause before price continues lower.
The key idea is simple: as long as gold stays capped below the 4,290–4,300 sell zone, the market may continue rotating down toward the 4,254 support, then extend lower into the 4,235 area and possibly the final wave target near 4,160–4,170.
⟡ Market structure
Gold is currently trading around 4,290, right below the short-term liquidity sell zone. The recent price action keeps printing lower highs, which tells us that sellers still control the structure.
The area around 4,290–4,300 is important because it acts as immediate resistance. If price continues rejecting from this zone, the market may retest 4,254 first. A break below that support would likely expose the next reaction zone around 4,235–4,245.
From the Elliott Wave view, the chart still supports a bearish continuation. The current movement looks like a corrective wave before another downside leg develops. If sellers stay in control, the market may complete the next push lower toward the 4,160–4,170 target zone.
➤ Key levels
◌ Current price area: 4,290
◌ Sell zone liquidity: 4,288–4,300
◌ Intraday resistance: 4,300–4,310
◌ Strong support: 4,254
◌ Buy scalping wave 4 zone: 4,235–4,245
◌ Main bearish target: 4,160–4,170
◌ Bearish invalidation: above 4,310
⌁ Elliott Wave view
The chart shows a bearish Elliott Wave continuation structure.
Price is struggling below the sell liquidity zone, which may be the ceiling for the current recovery attempt.
If gold cannot break above 4,300, the next move may be a decline toward 4,254.
After that, a short rebound from the 4,235–4,245 wave 4 support zone may appear.
But if the broader bearish structure stays intact, the next selling leg could extend toward 4,160–4,170 to complete the downside wave sequence.
This is why Kelly is still prioritizing the bearish scenario while price remains below resistance.
▸ Trading scenario
Preferred bearish scenario
Entry: Sell around 4,288–4,300 if price shows bearish rejection
Stop Loss: Above 4,310
Take Profit 1: 4,254
Take Profit 2: 4,235–4,245
Take Profit 3: 4,160–4,170
Alternative scenario
If gold breaks above 4,300 and holds above that zone, short-term downside pressure may weaken. In that case, price could recover higher first before sellers return.
◌ Confirmation
Bearish confirmation comes if price continues rejecting below 4,300 and breaks down through 4,254.
◌ Invalidation
The bearish view becomes weaker if gold closes above 4,310 with strong momentum. That would suggest the market is no longer respecting the current sell zone.
⌁ Kelly’s view
Kelly’s main view remains bearish while gold stays below the 4,288–4,300 liquidity zone. The chart still favors selling rallies rather than chasing buys at the current level.
If sellers defend resistance, gold may continue lower toward 4,254, then 4,235–4,245. A deeper extension could later complete near 4,160–4,170.
Do you think gold will reject directly from this sell zone, or make one more small bounce before the next leg down? Short 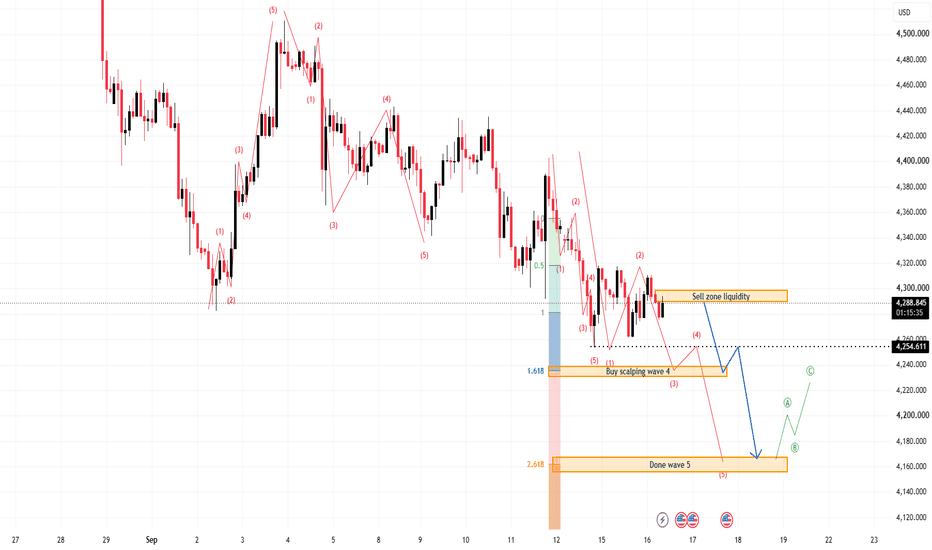
XAUUSD: Why the First Move After the Fed Can Be a TrapGold’s reaction around this week’s Federal Reserve decision is a useful example of why traders should separate volatility from confirmation.
Immediately after a major economic release, price can move aggressively as algorithms, stops and previously positioned traders react at the same time. That first move may look decisive, but it does not always establish the direction that survives once the market has fully processed the information.
This week, XAUUSD initially dropped sharply after the Fed raised rates, reaching roughly 4,235-4,240. Instead of extending lower, price recovered 4,300 and 4,350 and later returned toward the 4,400 area.
That sequence offers an important lesson: a strong candle is not automatically confirmation.
WHAT TO WATCH AFTER HIGH-IMPACT NEWS
1. Initial displacement
Let the first move happen. Avoid assuming that speed alone means continuation.
2. Reclaim or acceptance
If price breaks an important level and then quickly reclaims it, the original breakout may be failing. If price remains beyond the level and builds structure there, continuation becomes more credible.
3. Retest
A retest can reveal whether former support/resistance has genuinely changed role. The reaction is often more informative than the original breakout candle.
4. Market structure
After volatility settles, look for higher lows and reclaimed resistance for bullish confirmation, or lower highs and lost support for bearish confirmation.
APPLYING IT TO GOLD
The 4,300-4,350 region became important after Gold recovered from the post-Fed selloff. Holding above that area showed that sellers had failed to maintain control of the initial breakdown.
The 4,400-4,440 region is now an example of the opposite question: can buyers establish acceptance above resistance, or will price reject the area and rotate back into the range?
The lesson is not to predict which side must win.
It is to wait for the market to show whether a breakout is being accepted or rejected.
KEY TAKEAWAY
During major economic releases, the first move provides information, but the reaction that follows often provides better confirmation.
Displacement shows urgency.
Acceptance shows control.
Structure shows whether that control is lasting. Education 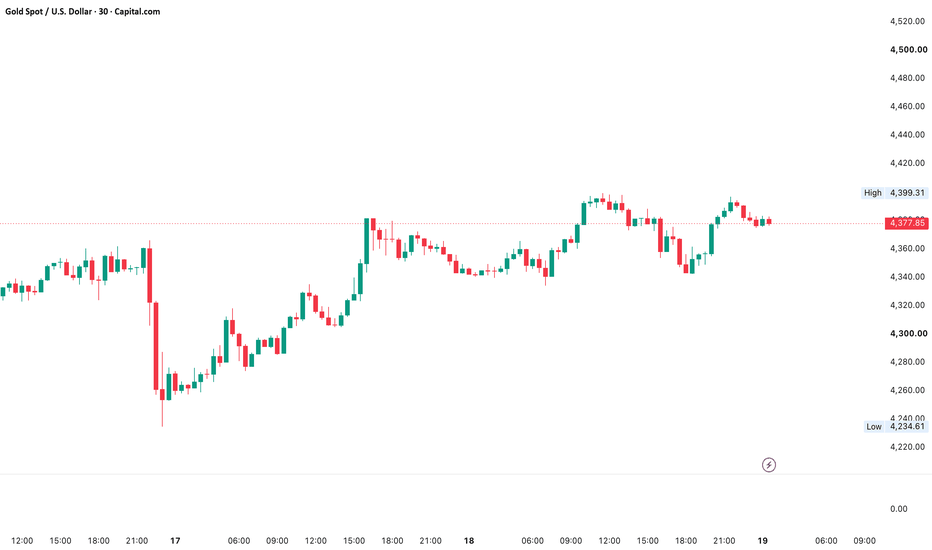
XAUUSD 19/09 H4 | Recovery Into H4 OBGold has recovered strongly from the 4,240–4,270 Demand Zone, reclaiming the 4,300 area and pushing back toward the 4,390–4,410 POC.
However, the H4 structure has not fully reversed. Price is still trading below the descending structure, while the 4,475–4,505 H4 OB remains the main resistance area.
My expectation for the next active session is a bullish retracement first, followed by a potential bearish reaction from the H4 OB.
🔍 Market Structure
H4 remains corrective after the previous bearish displacement.
The latest recovery started from the 4,240–4,270 Demand Zone.
Price is now approaching the 4,390–4,410 POC.
Above the POC, the next major reaction area is the 4,475–4,505 H4 OB.
The bearish structure remains valid while price stays below 4,505.
📍 Main POI
H4 OB: 4,475–4,505
This is the main area I want to observe for a potential reversal.
I am not interested in chasing the current recovery around 4,378. The better risk location is higher, inside the H4 OB.
🎯 Execution Plan
Entry: 4,475–4,495
SL: 4,520
TP1: 4,340
TP2: 4,260–4,270
The setup requires price to reach the H4 OB and show a clear bearish reaction before execution.
At an average entry around 4,485, the approximate risk is 35 points.
TP1 around 4,340 → ~145 points
TP2 around 4,265 → ~220 points
This gives approximately 1:4.1 to TP1 and 1:6.3 to TP2.
🧭 Directional Plan
The expected path is:
4,378 → 4,400 POC → 4,475–4,505 H4 OB → rejection → 4,340 → 4,260–4,270
So the main idea is not to fade the current recovery immediately.
I expect the recovery to potentially extend higher first. The important reaction should come from the 4,475–4,505 H4 OB.
If price reaches this zone and confirms bearish displacement, the first objective is 4,340. A clean break through 4,340 would expose the 4,260–4,270 Demand Zone.
❌ Invalidation
H4 acceptance above 4,505–4,520 invalidates this setup.
If price breaks through the H4 OB and establishes sustained H4 acceptance above the zone, I would no longer look for the projected downside path from this setup.
🔄 Alternative Scenario
If price fails to reach the H4 OB and instead breaks above 4,410 POC with strong displacement, I will wait rather than force an entry.
The structure would then need to be reassessed around 4,475–4,505.
🧠 Bias
Bearish after a potential H4 OB reaction.
The key point for this setup is simple:
I am expecting a recovery into 4,475–4,505 first. The reaction from that zone determines whether the next major move can develop toward 4,340 and 4,260–4,270. Short 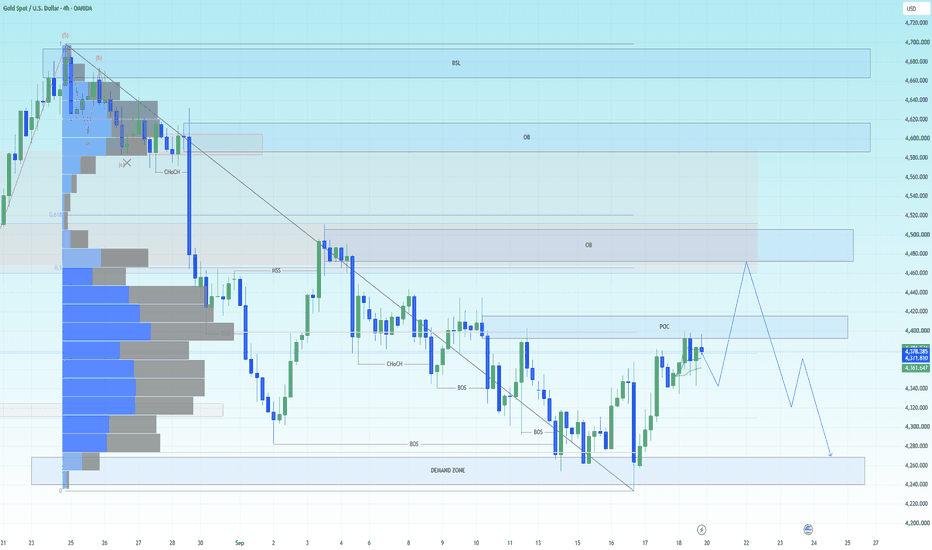
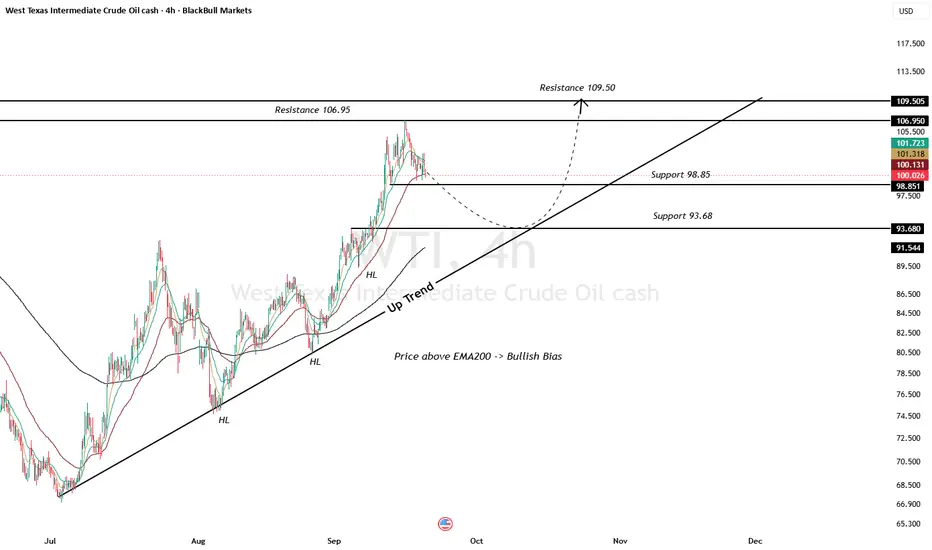
WTI 4H | 21–25 Sep 2026Last Week Recap | 14–18 Sep 2026
WTI crude prices were highly volatile throughout the week. Early in the week, WTI climbed above $105/bbl amid concerns over supply disruptions in the Middle East, particularly damage to Saudi Arabia's oil infrastructure and developments around the Strait of Hormuz.
Prices subsequently declined toward the end of the week after Saudi Arabia increased exports through Oman, while concerns over supply disruptions began to ease to some extent.
By the end of the week, WTI closed at approximately $100.02/bbl. Oil prices continued to receive support from ongoing tensions in the Middle East but faced pressure from expectations that supply would gradually recover, as well as US crude inventory data showing a smaller-than-expected decline. Elevated oil prices also increased concerns over potential demand weakness.
Fundamental Analysis | 21–25 Sep 2026
Bias: Sideway to Bullish
This week, the market will continue to focus primarily on Geopolitical Risk and Supply Disruptions, particularly developments between the US and Iran, attacks on Saudi Arabia's energy infrastructure, and shipping activity through the Strait of Hormuz. If oil transportation does not return to normal, a Geopolitical Premium is likely to remain embedded in oil prices.
However, the upside could remain limited by Saudi Arabia's efforts to restore supply and its plans to offer additional oil exports through Oman. If tensions in the Middle East begin to ease, profit-taking could emerge and the Geopolitical Premium could gradually decline.
Another key factor to monitor is US Crude Inventories and the Demand Outlook. Recent data showed that US crude inventories declined by only around 640,000 barrels, less than the market expected. Meanwhile, oil prices above $100/bbl could begin to weigh on demand in the coming period.
Overall: WTI could remain Sideway to Bullish, with supply risks remaining the main supporting factor. However, after the strong rally and WTI moving above $100/bbl, investors should watch for profit-taking and a potential decline in the Geopolitical Premium if the Middle East situation improves.
Technical Analysis — WTI 4H
WTI maintains a Sideway to Bullish outlook, with price continuing to trade above the EMA200 and the uptrend line, while the Higher Low structure remains intact. In the short term, the market is consolidating after approaching the resistance zone.
If price holds above the $98.85 support, WTI could recover and retest $106.95. A breakout above this level could open the way for further upside toward the $109.50 target.
Conversely, if price breaks below $98.85, WTI could decline toward the next support at $93.68.
Bias: Sideway to Bullish
Resistance: 106.95 / 109.50
Support: 98.85 / 93.68
Target: 109.50
Cut Loss: Below 93.68  Long
Long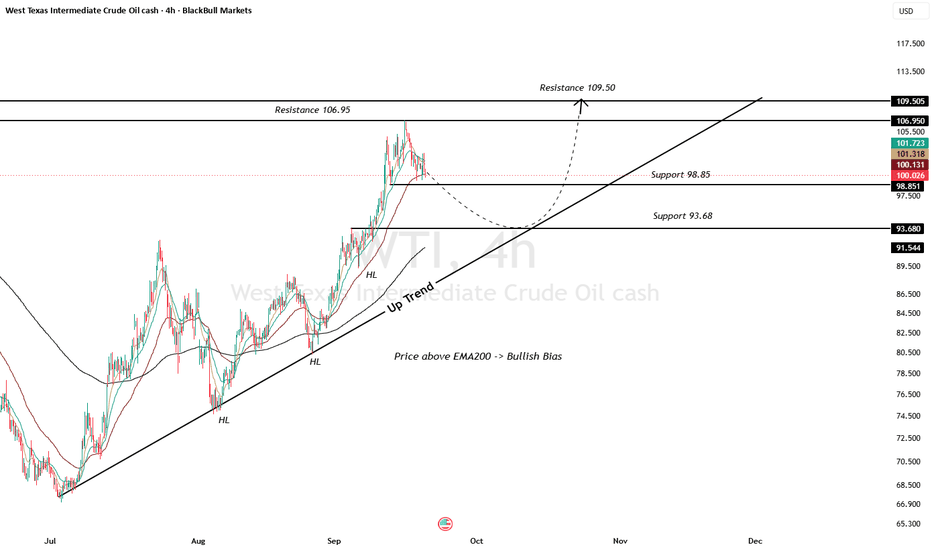
Gold (XAUUSD): Same Resistance Shelf Across Three Timeframes◆ Read: XAUUSD is testing a resistance shelf in the 4385–4400 zone that shows up independently across the 1H, 4H, and 15m charts, not one signal repeating, three separate structural reads converging on the same price. The 4H version of this shelf has recorded 55 total touches; the 15m shows a nearby level at 52.
◈ What's building underneath: raw volume regime reads QUIET on both the 1H and 15m right now, but the cumulative volume delta trend is Accumulating on every timeframe shown. Net buying pressure has been building steadily without a dramatic spike, a grind rather than an explosion.
⚠ If this shelf holds and price rejects: there's a well-tested support stack beneath, a zone with 23 touches near 4325 on the 1H, and a cluster with 28-45 touches in the 4315–4370 range on the 15m.
🔒 No signals, no promises, a structural read across timeframes, not a trade recommendation. Always manage risk and do your own analysis.
XAUUSD — Bullish Pullback Toward H1 SupportMarket Pulse
Gold ended the week on firmer footing, helped by easing oil prices that reduced some inflation pressure. The metal posted its first weekly gain in four weeks. However, the U.S. dollar remains firm and markets still see roughly a 55% chance of another Fed hike in October, so the macro picture is supportive but not fully bullish.
What the Chart Says
XAUUSD still shows a constructive H1 recovery after the strong rebound from the lower demand area.
Price reached the 4,390–4,400 region, then started to pull back. This is normal after the recent bullish expansion.
The main area I am watching is 4,325–4,345. This zone combines previous structure, Fibonacci support and the rising trend area.
If buyers defend this zone, Gold could build another higher low and recover toward the recent highs.
The first upside test remains around 4,390–4,400. A clean breakout above this resistance could open the way for a stronger continuation.
Levels That Matter
4,398–4,410 — Main resistance
4,370–4,380 — Current structure
4,325–4,345 — Main pullback / support zone
4,235–4,245 — Major demand zone
My Main Plan
The main plan remains bullish.
I prefer waiting for a controlled pullback toward 4,325–4,345 instead of chasing price near the highs.
If buyers return with clear confirmation, Gold could recover toward 4,390–4,400 again.
What I Need to See
I want the pullback to hold above the main support zone and form another higher low.
A sustained H1 break below 4,325 would weaken the immediate bullish continuation setup.
Final Read
The H1 recovery remains constructive, but Gold is still trading below an important resistance area.
For now, I prefer waiting for the pullback and bullish confirmation before following the next move higher. Long 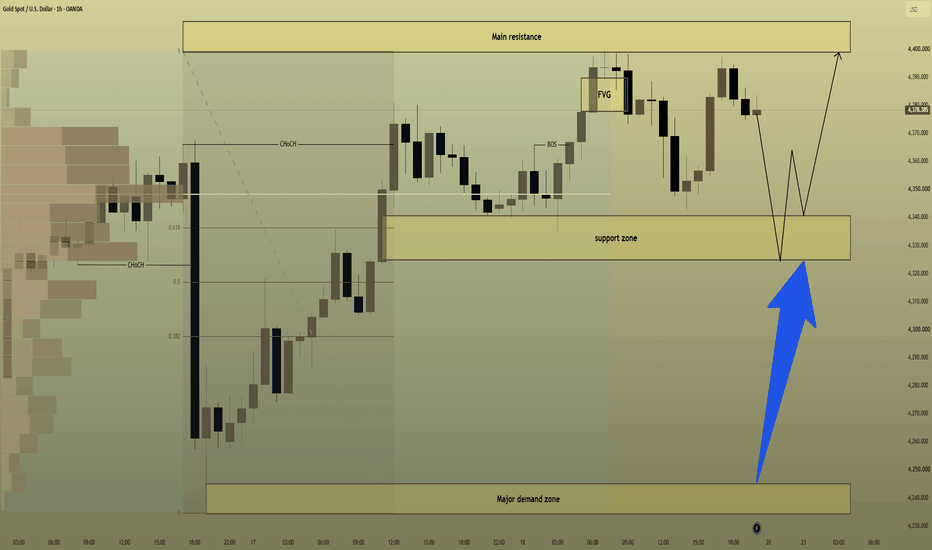
XAUUSD: Huge Inverse Head-Shoulder-Formation, Levels to Watch!Hello Community,
welcome to my new analysis of XAUUSD on the daily timeframe perspective. In the recent times, I have detected interesting signs that could lead XAUUSD to become a substantial trading opportunity in the upcoming times. Therefore, I have spotted all the major factors to consider with XAUUSD now.
When looking at my chart, we can see how XAUUSD has several times bounced within this ascending trend, forming several upthrust movements to the upside. Now, the most important part of this whole structure is this gigantic inverse head-and-shoulders formation. XAUUSD has already completed the left shoulder and the head.
Now, XAUUSD is bouncing within the EMA structure, which is also building substantial support in combination with the ascending trendline. From here, XAUUSD has a very high potential to bounce to the upside and continue in the bullish direction from there on. A final breakout above the neckline will activate the bullish target zones.
In this manner, thank you a lot for watching!
The support is highly appreciated.
VP Gold’s road back to $5,589 runs through 5 macro forcesOANDA:XAUUSD has already demonstrated that it can trade above $5,000.
The harder question is what would need to change for it to reclaim the January 2026 record near $5,595.
Gold reached an intraday record of approximately $5,594.82 on January 28 , before undergoing a sharp correction. By September 18, spot gold was around $4,390, leaving a substantial distance between current prices and the January high.
A move of that magnitude is unlikely to be explained by a chart pattern alone.
Five macro forces deserve particular attention.
1. Real Yields: Gold’s Opportunity Cost
Gold does not pay interest.
That makes real yields an important part of its opportunity-cost equation.
On September 18, the U.S. 10-year Treasury yield ( TVC:US10Y ) was around 5.0% , while the 10-year breakeven inflation rate was 2.33% . The 10-year TIPS real yield was approximately 2.68%.
The important variable is not simply whether real yields are "high."
It is their direction and persistence.
A sustained decline in real yields would reduce the relative return available from inflation-protected government bonds and could remove an important headwind for gold.
2. The U.S. Dollar: Gold’s Currency Channel
Gold is internationally priced in U.S. dollars, so changes in the dollar can affect its dollar-denominated price.
A weaker dollar can make gold less expensive in local-currency terms for non-U.S. buyers, while a stronger dollar can create the opposite effect.
But the relationship is not mechanical.
Gold can rise while the dollar strengthens when other forces such as geopolitical risk, investment demand or changes in interest-rate expectations—are strong enough.
The dollar should therefore be treated as a transmission channel, not a standalone signal.
For gold to make another major advance, sustained dollar weakness would remove one potential headwind.
3. The Fed Path: Watch the 2-Year Treasury
The Federal Reserve does not directly set the 2-year Treasury yield ( TVC:US02Y )
But the 2-year yield is highly sensitive to market expectations for future short-term interest rates, making it a useful market-based indicator of the expected monetary-policy path.
On September 18, the 2-year Treasury yield reached approximately 4.74% , its highest intraday level since July 2024. The move reflected expectations that U.S. monetary policy could remain restrictive amid persistent inflation.
The transmission mechanism matters:
2-year yield → rate expectations → Treasury yields → real yields → gold's opportunity cost.
If the 2-year begins establishing lower highs and falling persistently, the monetary backdrop for gold would become different from an environment in which short-term yields continue rising.
4. Central Banks: The Structural Demand Component
Central-bank buying provides a different source of demand from short-term trading flows.
The World Gold Council reported 289 tonnes of central-bank net purchases in Q2 2026 , up from a revised 57 tonnes in Q1. However, first-half demand remained the lowest first-half total since 2022 because of the weak Q1 figure.
In July, reported central-bank purchases totalled 23 tonnes . China added 20 tonnes and Poland 8 tonnes, while reported year-to-date purchases reached approximately 130 tonnes through July.
This does not mean central-bank buying guarantees higher prices.
It means gold has a source of official-sector demand linked partly to reserve diversification , operating on a different time horizon from speculative positioning.
For that reason, central-bank demand is better viewed as a structural demand factor than a short-term timing signal.
5. Oil: The Inflation-to-Rates Channel
Oil does not have a simple one-directional relationship with gold.
A sustained oil-price shock can increase inflation expectations. If markets respond by pricing tighter monetary policy, Treasury yields and real yields can rise, potentially creating a headwind for gold.
The transmission chain is:
Oil → inflation expectations → monetary-policy expectations → yields → real yields → gold.
That distinction is important.
Higher inflation does not automatically mean higher gold.
What matters is also how financial markets and policymakers respond to that inflation.
Recent price action illustrates the mechanism. On September 18, gold rose as oil prices eased, reducing some inflation concerns, while the dollar remained relatively strong.
The Sixth Variable: Confidence
There is another force that does not fit neatly into the five-factor framework:
confidence in the monetary and financial system.
Reserve diversification, geopolitical risk, fiscal concerns and demand for assets without a corporate issuer can all influence gold demand.
But this should not be reduced to:
"War = gold higher."
Markets can price geopolitical risks before they occur, and gold can respond differently depending on the effect on the dollar, yields, liquidity and investor positioning.
The more useful question is whether an event creates a persistent change in demand or risk perception.
What Would a More Supportive Gold Environment Look Like?
Rather than predicting whether gold will reclaim its January record, traders can monitor whether several transmission channels begin moving in the same direction.
A more supportive configuration could involve:
Real yields : sustained decline
2-year Treasury : lower highs and falling rate expectations
U.S. dollar : sustained weakness
Central banks : continued accumulation
Oil : easing inflation pressure, or rising without triggering a major repricing toward tighter policy
Financial/geopolitical risk : stronger demand for reserve assets
None of these is a guaranteed trigger.
They are transmission channels.
@currencynerd lessons for @TradingView community :
The chart tells you where price is.
Macro helps explain what forces may be acting behind it.
A gold breakout occurring while real yields, the dollar and the 2-year Treasury are falling would represent a different macro environment from a breakout occurring while all three are rising.
Likewise, a selloff into a major technical demand zone deserves a different interpretation if real yields are beginning to decline and official-sector demand remains firm.
This is why macro analysis works best alongside not instead of technical analysis.
thank your for your attention on the matter....
put together by : Pako Phutietsile as @currencynerd Education 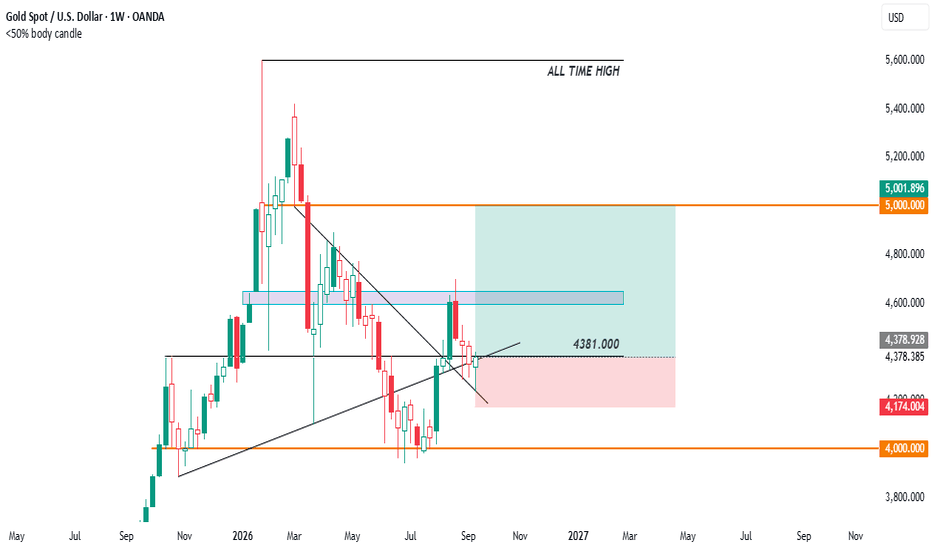
Short 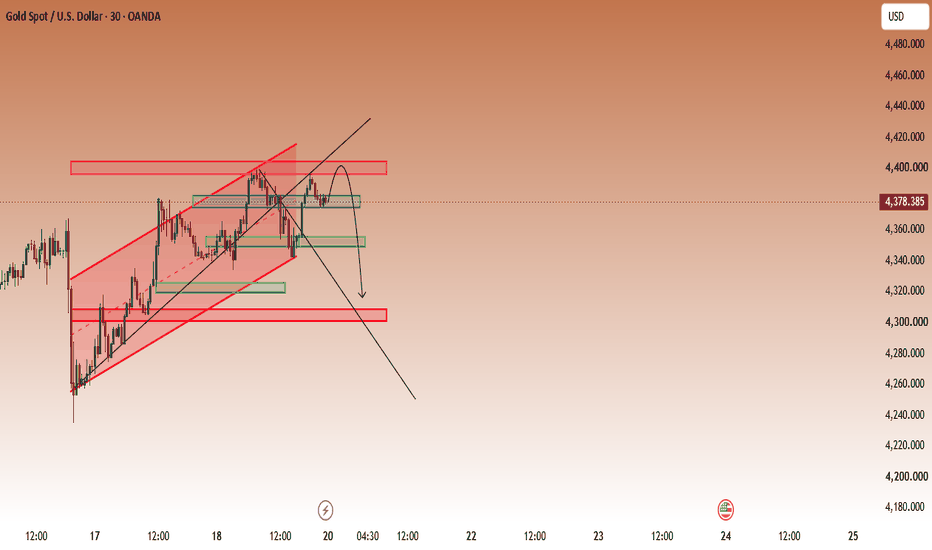
Long 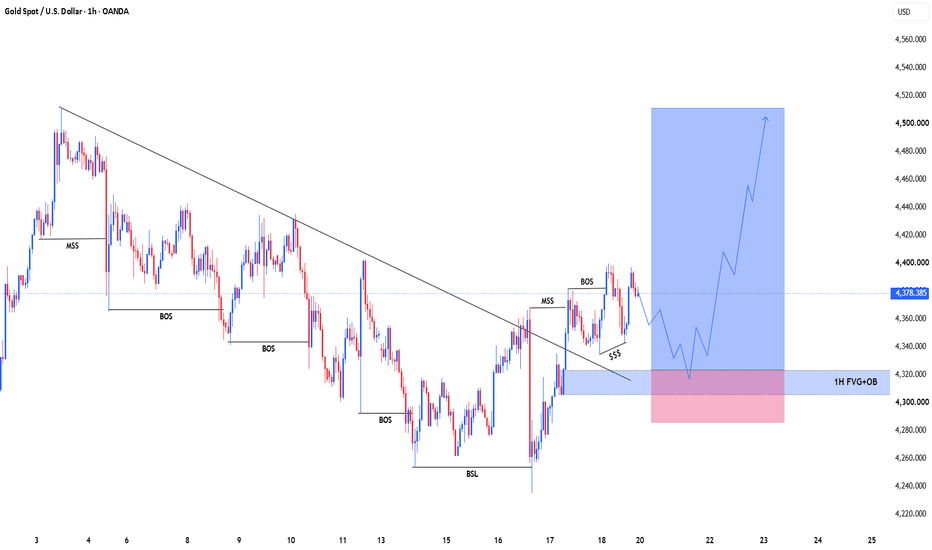
XAU/USD - Bulls Target Higher, Next Upward WaveOANDA:XAUUSD is showing its first meaningful change in structure after pushing above the long descending trendline. Price is still holding inside the 4,290–4,360 buy zone, so the next confirmation is simple: buyers need to keep this area from turning back into resistance.
If the breakout holds and Gold builds above 4,360, I’m watching:
🎯 Target: 4,530
Macro Market: The backdrop has improved for Gold. Oil prices are easing and the US 10-year Treasury yield has pulled back to around 4.94%, reducing some of the pressure on non-yielding assets. Gold has already benefited from lower yields and a softer Dollar, although the Fed’s recent rate hike and hawkish guidance remain the main risk to the bullish scenario.
A sustained H2 move back below 4,290 would weaken the breakout setup.
AURICVERSE View: this is more interesting than another simple bounce from support. The trendline is finally being challenged from above. If buyers can turn 4,290–4,360 into a base, 4,530 becomes the next level in focus. Long 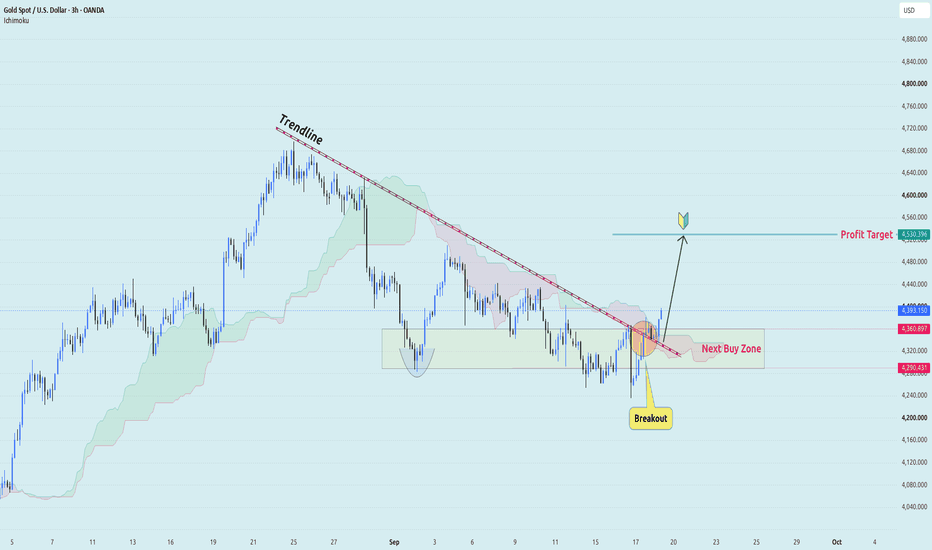
Short