Long
Long
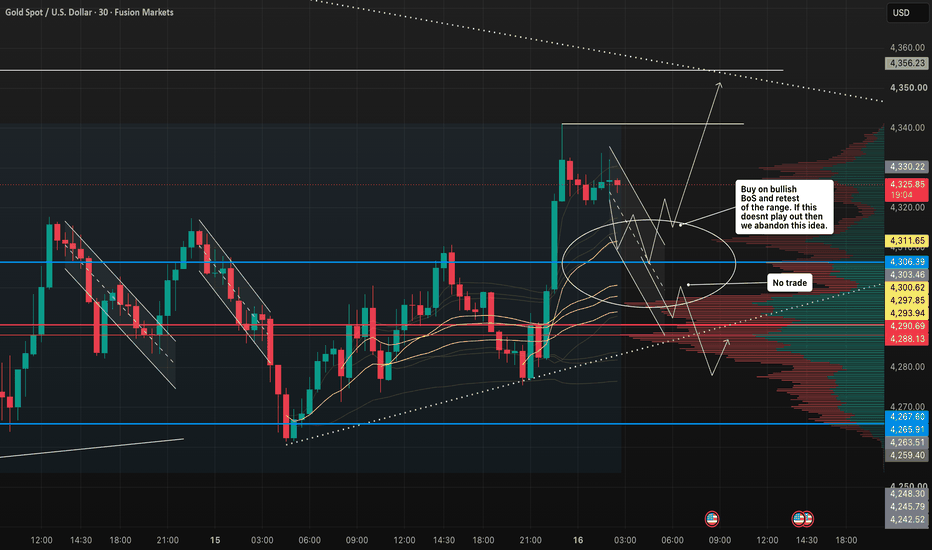
GOLD XAUUSD: Don't Buy Until THIS Level Holds!GOLD (XAU/USD) 🌍
The macro narrative heading into this week is heavily anchored to central bank policy expectations and fluctuating Treasury yields 🏦. Interestingly, general online sentiment is leaning heavily bullish, with retail consensus eagerly chasing every upward tick. This extreme crowding suggests a classic setup where late retail buyers risk getting trapped before institutional money triggers a proper liquidity hunt to clean up the board.
From a structural perspective, we are observing a potential Bullish Market Structure on the M30/H4 timeframe 📈. However, retail community chatter is calling for an immediate breakout to new highs, which signals to me that the market is prime for a classic Wyckoffian shakeout. AMT logic confirms price is attempting to build value above the recent consolidation node. If we see a failure to hold value outside the composite profile, the stage is set for a sharp mean reversion back into the balance area.
Key Zone: Price is hovering near the upper edge of the Volume Profile Value Area around $4,305–$4,311 📉. A sustained holding pattern above the Value Area High (VAH) signals volume acceptance in a discovery phase, whereas a drop back inside confirms a return to internal auction balance.
We are currently positioning at the top of the short-term trading range. I am patiently watching for a run on liquidity to sweep the late buyers sitting right above the immediate local highs around $4,340 🧹, before determining if true institutional demand takes over.
My Trade Plan 🎯
Bias: Neutral / Patience for Long Setup. I am waiting for confirmation rather than chasing impulse moves.
Entry Protocol: I will enter long only upon a clean bullish Break of Structure (BoS) and a successful retest of the Volume Profile Value Area boundary (holding above $4,305 - $4,311). If price falls back and closes inside the Value Area range, the long setup is invalidated and I will abandon the idea entirely.  Long
Long
Long 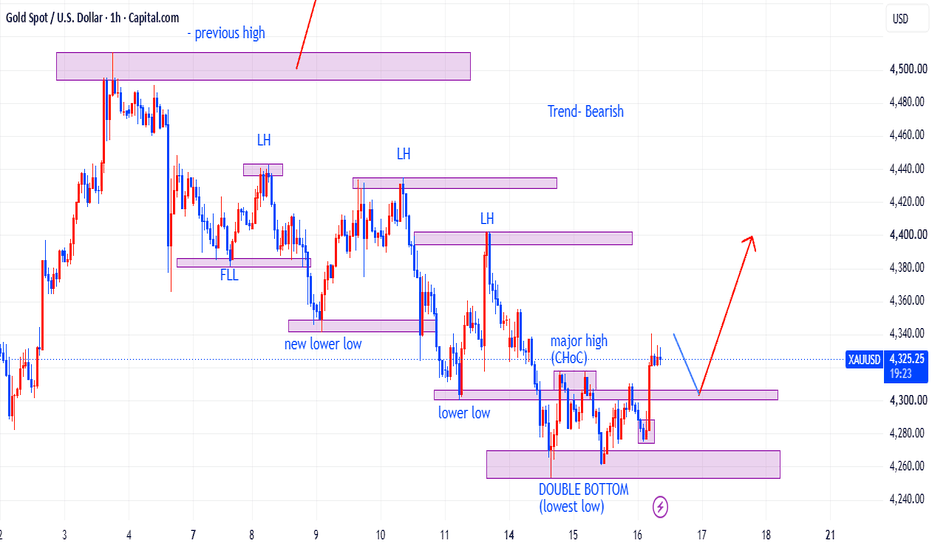
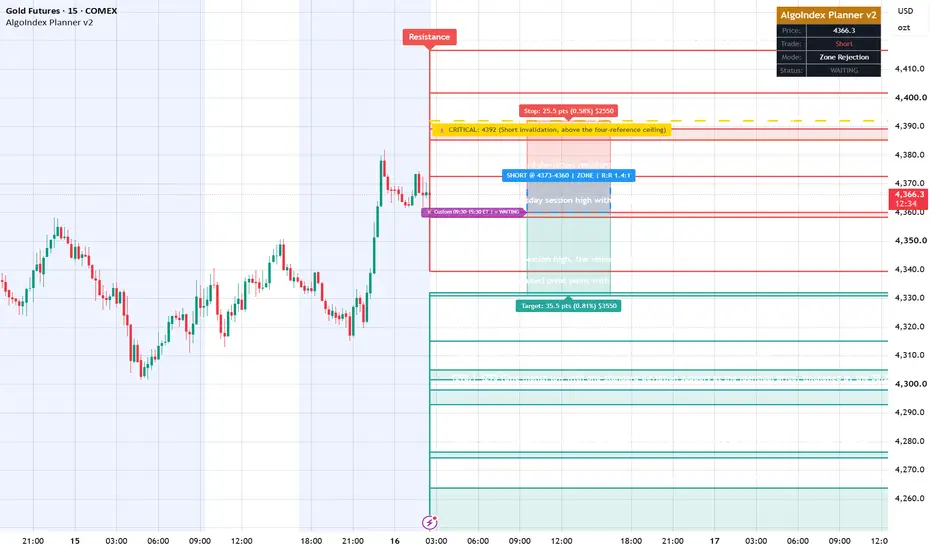
Gold (GC) Analysis, Key-Zones, Setup for Wed (Sep 16)Bias: December gold settled Tuesday at 4,332.8 after a compressed 56.6 point session between 4,358.3 and 4,301.7, finishing near the middle of that range, and the exchange-traded proxy closed up 0.24 percent on the day. Holding ground is itself the notable outcome, because it follows a five-day decline of 133.5 points or 2.99 percent and it happened while the dollar firmed and long-end yields pushed to multi-year highs. The metal is caught between two forces pulling hard in opposite directions. Against it sits the real-rate channel: benchmark 10-year Treasury yields topped 5 percent for the first time since 2007 and the dollar index rose 0.14 percent to sit just beneath Monday's one-and-a-half-week high. Gold pays no coupon, so a rising real yield raises the cost of holding it, and that is the mechanism behind a 100-day decline of 501.1 points or 10.38 percent. For it sits an unusually loaded backdrop: an active conflict involving Iran described in trade commentary as now in its seventh month, a crucial Saudi pipeline out of service for three to five weeks, Brent settling at 108.75 dollars after a 2.9 percent advance, and diesel settling at a record 5.2620 dollars a gallon. That the haven bid is not winning against those headlines is the most informative signal this market is giving. When gold cannot rally on a supply shock, a shooting conflict and record distillate prices, the marginal buyer is being priced out by the discount rate rather than drawn in by the risk. The structure sharpens the decision to a knife edge. The settle sits 0.8 points above the 50-day average at 4,332.0 and 1.9 points above the computed pivot at 4,330.9, so the contract enters Wednesday balanced on the only intermediate average it still holds, beneath every other one. The oscillator set is deeply extended, with the 14-day stochastic percent K at 10.10, but the 9-day directional index at 26.48 with the negative directional indicator dominant marks an established decline rather than a drift, and oversold readings in trending markets tend to become more oversold. Bias is lower while beneath 4,392, with rallies into 4,360 to 4,373 the preferred area to sell, though a 25 basis point increase is already roughly 92 percent priced and the 02:00 PM ET projections will set the real yield gold must compete against.
Resistance:
- 4,416.7 Pivot R3, the outer boundary of the computed ladder and the practical ceiling for any session that does not reverse the prevailing decline
- 4,401.8 3 Standard Deviation Resistance, a statistical extension boundary rather than a structural level
- 4,389.2 2 Standard Deviation Resistance, the top of a four-reference ceiling that also holds the 40-day average crossing at 4,387.8, Pivot R2 at 4,387.5 and the 50 percent retracement of the 13-week span at 4,385.3, four levels inside four points
- 4,372.6 1 Standard Deviation Resistance, the upper edge of the preferred entry band for the primary setup
- 4,360.1 Pivot R1, sitting 1.8 points above Tuesday's session high so the pair forms one decision band
- 4,358.3 Tuesday's session high, the level a recovery must clear to change the short-term sequence
- 4,339.5 the overnight session high, the immediate ceiling and first test of any early strength
Support:
- 4,332.0 the 50-day average, the last intermediate average gold still holds and only 0.8 points beneath the settle, whose loss on a closing basis leaves the contract under every average on the board
- 4,330.9 the computed Pivot Point, effectively coincident with that average, concentrating Wednesday's opening decision into a band barely two points wide
- 4,315.2 the overnight session low, the first marker beneath the pivot band
- 4,305.1 the computed downside objective from the same level set that produces the pivot ladder
- 4,303.5 Pivot S1, sitting inside a tight three-way shelf with the computed objective above it and Tuesday's low below it
- 4,301.7 Tuesday's session low, the line whose loss confirms continuation rather than consolidation
- 4,293.0 the one-month low with 1 Standard Deviation Support at the identical price, the most important support on the board because two independent methods land on the same number, thickened by the 38.2 percent retracement from the 13-week low at 4,298.1
- 4,274.3 Pivot S2, with 2 Standard Deviation Support at 4,276.4 immediately above it
- 4,246.9 Pivot S3, the outer boundary of the ladder, bracketed by 3 Standard Deviation Support at 4,263.8 and the 3-10 day average crossover reference at 4,244.0
Primary Setup: SHORT GC from the 4,360 to 4,373 zone on a rally into the band running from Pivot R1 at 4,360.1, just above Tuesday's session high, up to the 1 Standard Deviation Resistance at 4,372.6. Stop 4,392, above the four-reference ceiling at 4,385.3, 4,387.5, 4,387.8 and 4,389.2, so that a stop-out requires clearing the 50 percent retracement of the 13-week span, the second pivot, the 40-day average crossing and the two standard deviation band together rather than tagging any one of them. Targets at 4,331 first, taken inside the pivot band where the computed Pivot Point at 4,330.9 and the 50-day average at 4,332.0 sit barely two points apart, 4,304 second at the tight shelf holding the computed objective at 4,305.1, Pivot S1 at 4,303.5 and Tuesday's low at 4,301.7, and 4,293 third where the one-month low and 1 Standard Deviation Support fall on the identical price, taken only if momentum extends through the second target on expanding volume. From a 4,366.5 entry midpoint that is 25.50 points of risk against 35.50, 62.50 and 73.50 points of reward, roughly 1.4 to 1, 2.5 to 1 and 2.9 to 1. Half size is appropriate given that the interest rate decision, the rate statement and the Summary of Economic Projections all land at 02:00 PM ET with the press conference at 02:30 PM ET, and retail sales at 08:30 AM ET is forecast at 0.8 percent against a negative 0.6 percent prior. Pricing is likely to be disorderly between 02:00 PM and 02:45 PM ET, and government crude inventories at 10:30 AM ET feed the inflation-expectations channel earlier in the day. A sustained move above 4,392, and in particular an hourly close above 4,416.7, negates the thesis. The standing counter-argument is that a 14-day stochastic percent K of 10.10 is deeply extended and that this backdrop needs only one escalation to force a violent repricing from a market positioned for further weakness.
Wednesday is a decision session rather than a trend session for gold, and its sensitivity is second-order but sharp, because the metal trades the projected path of real rates rather than the rate decision itself. A 56.6 point Tuesday against a 14-day average daily range of 106.3 points leaves roughly half the normal daily distance unspent, and the release scheduled for 02:00 PM ET is what it will be spent on.
Short 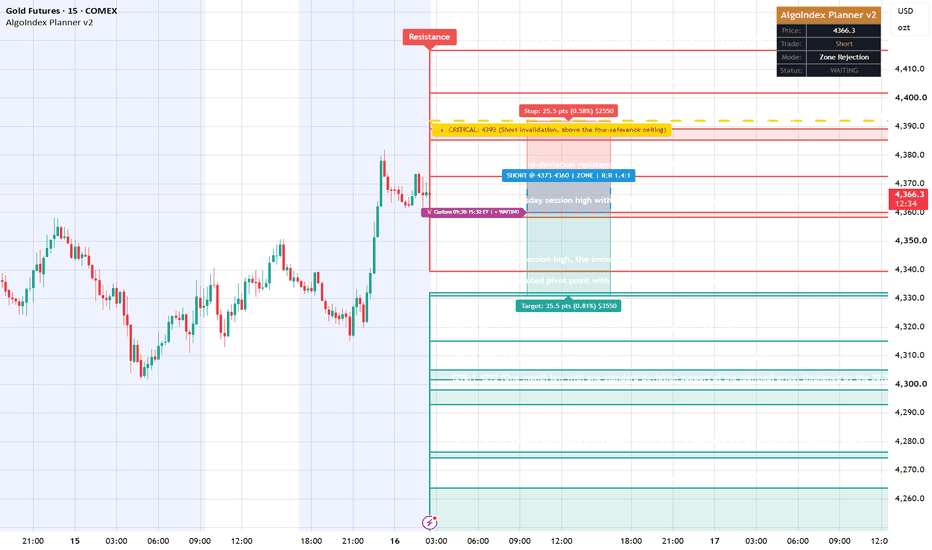
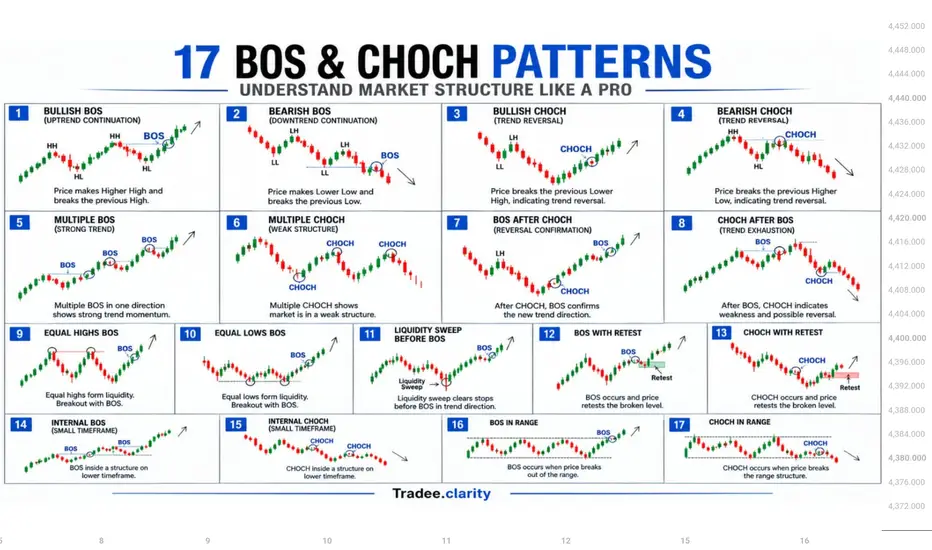
Market Structure Masterclass: 17 BOS & CHOCH PatternsMarket Structure Analysis — BOS & CHOCH
This educational chart illustrates 17 commonly observed market-structure patterns based on Break of Structure (BOS) and Change of Character (CHOCH). These concepts are widely used by technical analysts to study price action, identify structural shifts, and understand how price behaves around previous highs, lows, liquidity areas, and key levels.
1. Bullish BOS
A bullish Break of Structure occurs when price moves above a previously established swing high. This can be interpreted as evidence that bullish structure is continuing.
2. Bearish BOS
A bearish BOS occurs when price breaks below a previous swing low, indicating that bearish structure may be continuing.
3. Bullish CHOCH
A bullish Change of Character occurs when price breaks a relevant previous lower high. This can indicate a potential transition from bearish structure toward bullish structure.
4. Bearish CHOCH
A bearish CHOCH occurs when price breaks a relevant previous higher low, potentially indicating a transition toward bearish structure.
5. Multiple BOS
Repeated structural breaks in the same direction can demonstrate sustained directional price movement and developing market momentum.
6. Multiple CHOCH
Multiple changes of character can occur during uncertain or consolidating conditions. These situations may require additional confirmation before interpreting a larger structural shift.
7. BOS After CHOCH
When a CHOCH is followed by a BOS in the same new direction, the sequence can provide additional structural confirmation.
8. CHOCH After BOS
A CHOCH following an established BOS can indicate that the existing directional structure is weakening or potentially transitioning.
9–10. Equal Highs / Equal Lows
Equal highs and equal lows can represent areas where liquidity may be concentrated. A subsequent structural break can provide useful information about how price is interacting with those levels.
11. Liquidity Sweep Before BOS
Price may temporarily move beyond a previous high or low before reversing and breaking structure. This is commonly referred to as a liquidity sweep.
12–13. BOS / CHOCH With Retest
After a structural break, price may return to the previously broken area. A retest can help analysts evaluate whether the broken level is being respected as potential support or resistance.
14–15. Internal Structure
Internal BOS and CHOCH refer to smaller structural movements, often observed on lower timeframes. These movements should be considered within the context of the broader market structure.
16–17. Structure Within a Range
Markets can remain inside defined ranges for extended periods. A BOS may occur when price breaks beyond the range, while a CHOCH can represent a structural shift occurring within or around the range.
Professional takeaway
BOS and CHOCH should not be treated as standalone buy or sell signals. Their significance depends on the broader context, including:
Higher-timeframe structure
Swing highs and swing lows
Support and resistance
Liquidity areas
Market volatility
Trading session and market conditions
Confirmation from subsequent price action
Appropriate risk management
Educational Note: This chart is intended solely for technical-analysis education. It does not constitute financial, investment, or trading advice, and no specific trade outcome is implied or guaranteed. Past price behavior does not guarantee future results. Always perform your own analysis and consider your individual risk tolerance before making any trading decision. Education 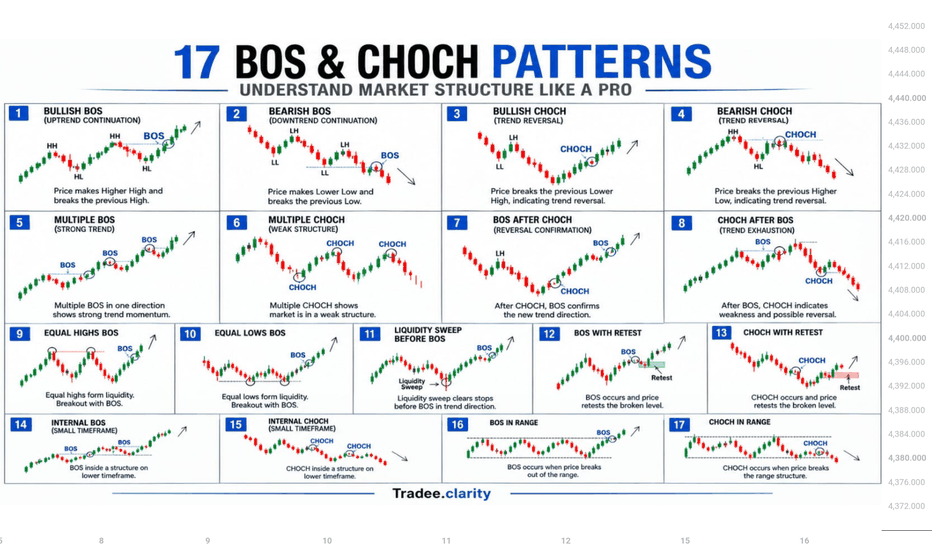
XAUUSD 1H — EQL Sweep & Potential Bearish Reversal
Gold is currently testing the 4,333–4,340 liquidity zone, where equal highs have formed.
From a Smart Money Concepts (SMC) perspective, price may be targeting buy-side liquidity (BSL) above the equal highs before delivering bearish displacement.
🔍 Key Levels
4,333–4,340 → EQL / Buy-Side Liquidity
4,315.7 → 0.618 Fibonacci
4,303.45 → 0.5 Fibonacci
4,250–4,255 → Sell-Side Liquidity (SSL)
4,350–4,360 → Major Supply Zone
📉 Bearish Scenario
If price sweeps the EQL/BSL and rejects the 4,333–4,340 area, I’ll be watching for bearish displacement and a move toward 4,315 → 4,303 → 4,250–4,255 SSL.
📈 Invalidation
A strong breakout and acceptance above 4,350–4,360 would invalidate this bearish setup and shift attention toward higher liquidity.
SMC Sequence:
BSL Sweep → Rejection → Bearish Displacement → SSL Target 🎯
#XAUUSD #Gold #GoldTrading #Forex #SMC #SmartMoneyConcepts #Liquidity #PriceAction #ICT #TradingView Short 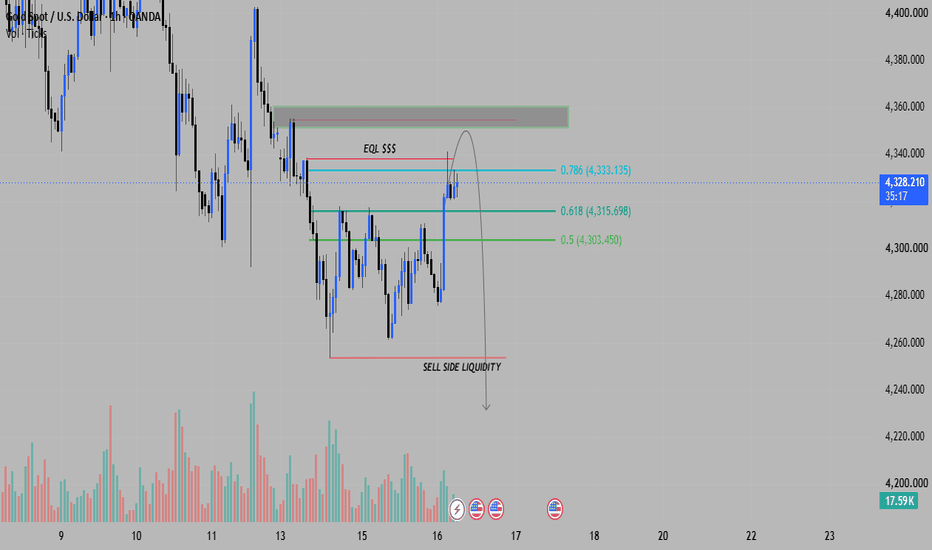
Gold breakout risk builds into FedDecision day may have arrived for gold, heading into what’s likely to be the first Fed interest rate increase in three years.
The falling wedge structure we highlighted yesterday remains intact, with the price pressing back towards the upper boundary after a third consecutive failure to move convincingly beneath the 50-day moving average earlier today. That keeps the lower end of the structure in play and suggests bids are still lurking around that area.
While the structure is technical in nature, macro may deliver the trigger. Markets are already pricing a pretty hawkish Fed path, with around four hikes favoured by the middle of next year. My inkling is that the Fed may struggle to out-hawk that.
One obvious route would be an updated dot plot that shows fewer hikes this year and next than markets currently have priced. If the decision and guidance amount to a dovish hike relative to current pricing, we could see some relief in Treasury yields and renewed pressure on the US dollar, giving gold a decent crack at breaking higher from the wedge.
There are also more aggressive bullish scenarios. A shock decision to leave rates unchanged may deliver a sharpe twist steepening of the curve, while several influential FOMC members dissenting in favour of holding could have a similar effect. Either outcome could provide a meaningful release valve for bullion.
While the trigger for a breakout is obvious, confirmation is still required. The key area to watch is the confluence of the 23.6% Fib retracement of the Jan-June bear move around $4,333 with the upper boundary of the falling wedge drawn from the late-August high.
A sustained break above that zone would confirm the bullish breakout and bring $4,400 into focus initially, followed by $4,510.80. Beyond that, the 200-day moving average and 38.2% Fib around $4,575 remain the next major hurdles, before the August high at $4,696.80.
On the downside, the 50-day moving average is now found just above the lower boundary of the wedge structure. A successful break beneath the latter would question the merits of the bullish setup and arguably flip directional risks lower, putting $4,200 back in play.
Good luck!
DS Long 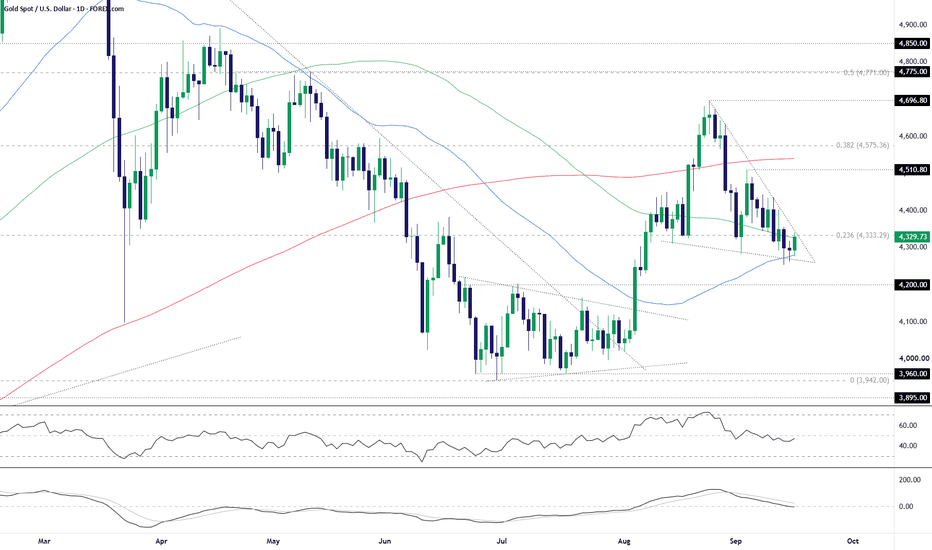
Short 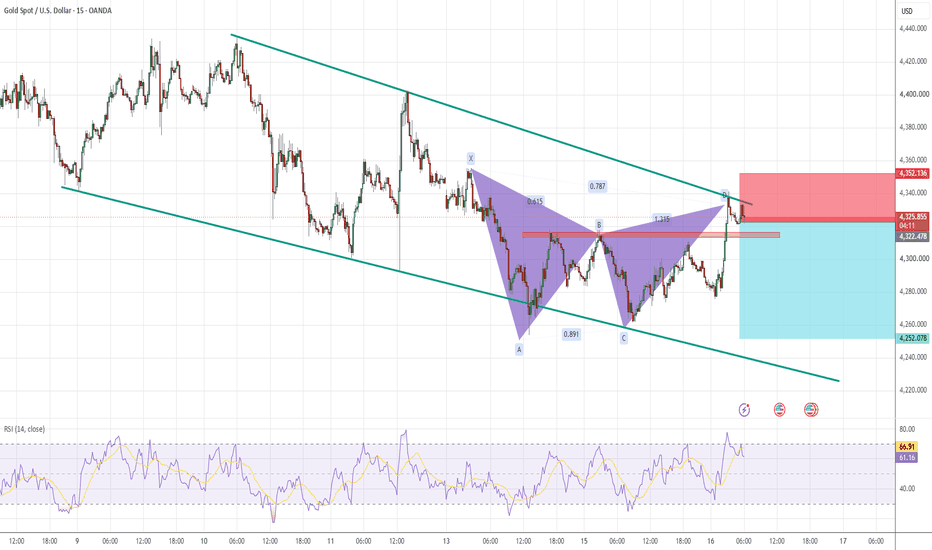
Nasdaq 100 (NQ) Analysis, Key-Zones, Setup for Wed (Sep 16)Bias: December Nasdaq-100 futures settled Tuesday at 29,246.75 after a 287.75 point session between 29,495.25 and 29,207.50, closing just 39.25 points off the low and inside the lower 14 percent of the day's range. The cash index fell about 0.65 percent against about 0.45 percent for the broad market, and that gap is the entire story. Benchmark 10-year Treasury yields topped 5 percent for the first time since 2007 while crude rose about 4 percent to trade above 105 dollars, and an index whose earnings sit far out on the duration curve is the most exposed asset available to a rising long-end discount rate. Supporting stress was visible across assets, with crude volatility up about 4 percent and bitcoin rejecting 82,000 to fall about 3 percent. The structural picture is heavy but not yet broken. Price sits below the 5-day average at 29,416.75, the 20-day at 29,621.54, the 50-day at 29,577.59 and the 100-day at 29,721.96, while holding far above the 200-day at 27,824.07, so this reads as a correction inside a longer advance rather than a completed trend change. The 14-day directional index at 14.17 with the negative directional indicator at 23.15 above the positive at 15.07 describes downward pressure without trend conviction, which is the environment where computed pivots and dealer-positioning levels govern price. The multi-indicator composite reads 64 percent sell. Dealer positioning in the exchange-traded proxy is the sharpest input: the fund closed at 705.38, beneath both its modeled gamma-flip level of 718 and its modeled volatility threshold of 712, with estimated gamma notional at negative 927 million dollars and put volume running near 1.56 times call volume. Below a modeled flip level, hedging flows tend to extend moves rather than contain them. Positioning data through September 8 showed elevated non-dealer length in Nasdaq futures with about 7.1 billion dollars net sold between September 1 and September 8, so a crowded long is being reduced into the event rather than after it. Bias is lower while beneath 29,545, with rallies into the 29,421 to 29,473 confluence the preferred area to sell, though a 25 basis point increase is already roughly 92 percent priced and the 02:00 PM ET projections, not the rate number, will write Wednesday's reaction.
Resistance:
- 29,713 Pivot R3, the outer boundary of the computed ladder and the practical ceiling for any advance that does not involve a policy surprise
- 29,604 Pivot R2, reinforced by the 20-day average at 29,621.54 and the 9-day and 18-day average crossings near 29,632, so a close above this band is the first real evidence the corrective sequence has ended
- 29,588 primary call side ceiling equivalent, translating the cash-index call-side concentration at 29,275 into futures terms at this session's measured 312.75 point basis, where dealer hedging of that concentration tends to supply into strength
- 29,541 the 40-day average crossing, the structural reference that must be reclaimed before the average stack can be read constructively again
- 29,493 2 Standard Deviation Resistance, a statistical extension boundary rather than a structural level, so a tag without a close above is a fade candidate
- 29,473 modeled volatility threshold equivalent, a modeled underlying-price level published against the cash index at 29,160 rather than an option strike, and one the cash index closed beneath
- 29,421 the primary confluence, where Pivot R1 at 29,425.50, 1 Standard Deviation Resistance at 29,420.68 and the 5-day average at 29,416.75 stack inside 9 points, the tightest overhead grouping on the board
- 29,316 Pivot Point, sitting essentially on the primary put side support base equivalent at 29,313 and forming the first meaningful shelf directly above the settle
Support:
- 29,207 Tuesday's session low, the confirmation line for continuation and only 39.25 points beneath the settle, which is what makes the weak close actionable
- 29,179 computed downside objective from the same level set that produces the pivot ladder, the first measured stop on any break
- 29,148 modeled gamma-flip equivalent, translating the cash-index modeled flip at 28,835, the threshold beneath which proxy hedging turns most destabilizing
- 29,138 Pivot S1, sitting within 11 points of the modeled flip equivalent above it, which makes 29,138 to 29,148 the single most important support decision band on the chart
- 29,107 the one-month low and the structural base of the recent monthly distribution, whose loss opens the deeper standard deviation supports at 29,072.82 and 29,000.78
- 29,029 Pivot S2, reinforced immediately below by 2 Standard Deviation Support at 29,000.78 and the 3-10 day average crossover reference at 29,001.61, making the 29,000 area a dense shelf
- 28,850 Pivot S3, the outer boundary of the computed ladder, with 3 Standard Deviation Support at 28,945.50 and the 38.2 percent retracement from the 13-week low at 28,937.99 as intermediate stops
Primary Setup: SHORT NQ from the 29,421 to 29,473 zone on a rally into the Pivot R1, one standard deviation and 5-day average confluence, with the modeled volatility threshold equivalent capping the upper edge. Stop 29,545, placed above the 40-day average crossing at 29,541.14 and the two standard deviation band at 29,492.72 so that a stop-out requires reclaiming structure rather than merely tagging an extension. Targets at 29,316 first, where the Pivot Point and the primary put side support base equivalent overlap, 29,207 second at Tuesday's session low, and 29,138 third at Pivot S1 where the modeled gamma-flip equivalent sits 10 points higher, taken only if momentum extends through the second target on expanding volume. From a 29,447 entry midpoint that is 98 points of risk against 131, 240 and 309 points of reward, roughly 1.3 to 1, 2.4 to 1 and 3.2 to 1. Half size is appropriate given the interest rate decision, the rate statement and the Summary of Economic Projections all land at 02:00 PM ET with the press conference at 02:30 PM ET, and retail sales at 08:30 AM ET is forecast at 0.8 percent against a negative 0.6 percent prior. Pricing is likely to be disorderly between 02:00 PM and 02:45 PM ET, a volatility-index expiration at 09:30 AM ET can distort early pricing, and the cash open at 09:30 AM ET sets the session's first directional test. A sustained move above 29,545, and in particular an hourly close above 29,604, negates the short thesis and opens 29,713. The mirror risk is a projection set implying a pause after this increase, which is the condition for a relief advance back through 29,473 toward 29,588.
Wednesday is a decision session rather than a trend session, and the distinction matters for how it should be traded. A market carrying compressed realized volatility at 12.40 percent on the 14-day, unspent range after a 287.75 point Tuesday against a 14-day average daily range of 351.59, and dealer positioning beneath its modeled flip level is a market configured to expand rather than to drift, and the expansion is scheduled for 02:00 PM ET.
 Short
Short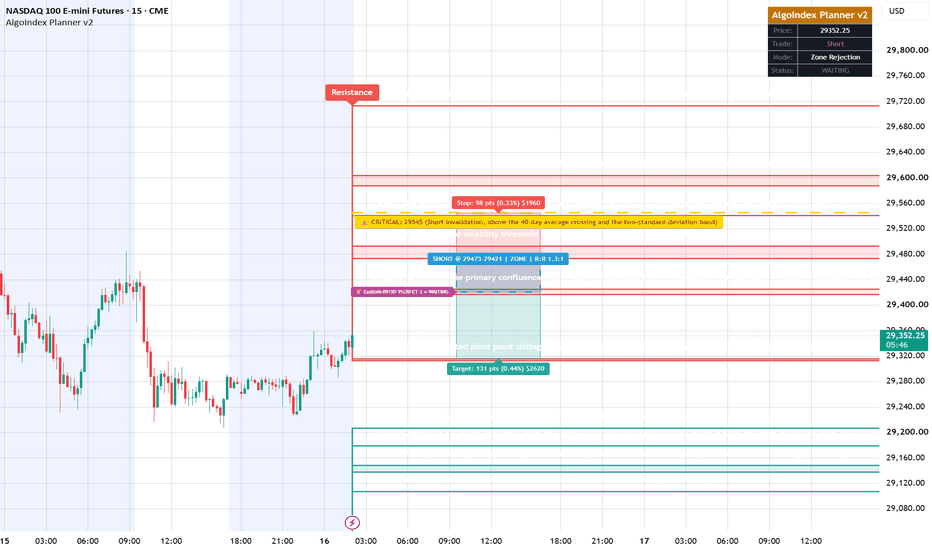
Long 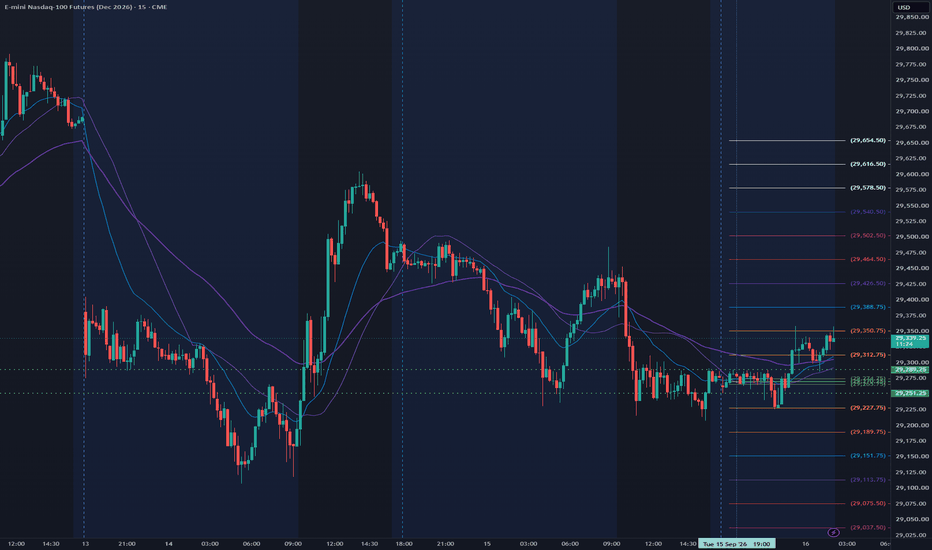
GOLD (XAUUSD) — 4H BEARISH REVERSAL SETUP Gold is approaching a 4H resistance/supply zone around 4,328–4,340 after the recent bullish recovery. Price is currently testing this area, where sellers may attempt to push the market back toward the 4,274 support.
📌 Trade Idea — SHORT
Entry: 4,328.613
Stop Loss: 4,359.181
Take Profit: 4,274.161
Risk/Reward: ≈ 1:1.8
🔎 Why I'm Watching This Setup
🔹 4H resistance zone: Price has returned to a previously important reaction area around 4,330–4,340.
🔹 Supply zone: The blue zone represents the area where sellers could potentially step in.
🔹 Bearish rejection: A rejection from this zone would provide confirmation that buyers are struggling to push higher.
🔹 Major support below: 4,274 is the key downside level and the primary target on the chart.
Confirmation
The setup becomes more interesting if we get:
Resistance rejection → bearish 4H candle → break below nearby support → continuation toward 4,274.
If Gold breaks and holds above 4,359, the bearish setup is invalidated.
🎯 Potential path:
4,328 → 4,310 → 4,290 → 4,274
⚠️ This is a technical-analysis idea, not financial advice. Wait for confirmation and manage risk appropriately.
Gold is testing 4H resistance again. Will sellers defend this zone and send XAUUSD back toward 4,274? Short 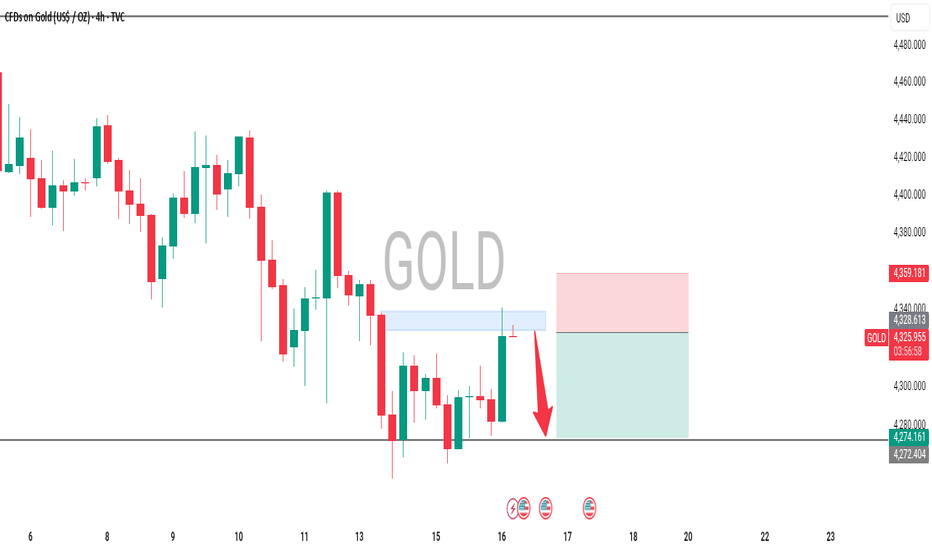
S&P 500 (ES) Analysis, Key-Zones, Setup for Wed (Sep 16)Bias: December S&P 500 futures settled Tuesday at 7,656.00 after a narrow 57.50 point session between 7,701.00 and 7,643.50, closing in the lower 22 percent of the range. The low is the fact that matters, because 7,643.50 is also the one-month low, so the contract printed a fresh monthly extreme and then failed to recover into the settle. The cash index closed at 7,586, down about 0.45 percent. The driver was the rates and energy complex rather than anything equity-specific: benchmark 10-year Treasury yields topped 5 percent for the first time since 2007 while crude rose about 4 percent to trade above 105 dollars. The broad index absorbed that better than the Nasdaq did, which is the expected ordering when the shock runs through the discount rate, and it shows in the relative structure, since this contract still holds above its 100-day average at 7,626.08 while its technology counterpart has already lost that reference. Positioning is the destabilizing input. The contract settled 47.35 points beneath the modeled gamma-flip level published for it at 7,703.35, and beneath that threshold dealer hedging extends moves rather than absorbing them. The zero-dated positive gamma pocket that stabilized Tuesday afternoon expired at the close, so that cushion is gone. Estimated gamma notional on the exchange-traded fund is negative 1.715 billion dollars with a gamma tilt of 0.607, and the fund closed at 758.05, beneath its own modeled flip level of 765 and beneath its primary put side support base of 760. Against all of that sits a genuinely stretched oscillator set, with the 14-day stochastic percent K at 12.51 and the 20-day at 11.35, readings from which relief rallies typically begin. The multi-indicator composite is only 16 percent sell, far less committed than the Nasdaq's, so this is a market that is stretched rather than trending. Bias is lower while beneath 7,727, with a retest of the 7,700 to 7,705 band the preferred area to sell, since Tuesday's high at 7,701.00 and the modeled flip at 7,703.35 sit within 2.35 points of each other. A 25 basis point increase is already roughly 92 percent priced, so the 02:00 PM ET projections and guidance, not the rate number, will write Wednesday's direction.
Resistance:
- 7,747.67 (SPX 7,678) Pivot R3, the outer boundary of the computed ladder and the practical ceiling for any session that does not involve a policy surprise
- 7,725.35 (SPX 7,655) modeled volatility threshold, a modeled underlying-price level published by the positioning source as of Tuesday's close rather than an option strike, sitting almost exactly on the second pivot
- 7,724.33 (SPX 7,654) Pivot R2, reinforced by the 40-day average crossing at 7,724.40 and the 9-day crossing at 7,726.06, which makes 7,724 to 7,726 the firmest overhead shelf
- 7,706.66 (SPX 7,637) 3 Standard Deviation Resistance, a statistical extension boundary where a tag without a close above is a fade candidate
- 7,703.35 (SPX 7,633) modeled gamma-flip level, the threshold above which dealer hedging stabilizes and below which it amplifies, sitting just 2.35 points above Tuesday's session high and forming the decisive line for Wednesday
- 7,690.17 (SPX 7,620) Pivot R1, with 1 Standard Deviation Resistance at 7,685.25 just beneath it, making 7,685 to 7,690 the first real supply band above the settle
- 7,681.15 (SPX 7,611) the 5-day average, the nearest overhead average and the first test any recovery attempt faces
- 7,666.83 (SPX 7,597) Pivot Point, only 10.83 points above the settle, so the session opens essentially at its pivot
Support:
- 7,650.78 (SPX 7,581) computed downside objective from the same level set that produces the pivot ladder
- 7,645.50 (SPX 7,576) the 50 percent retracement of the 13-week span, two points above Tuesday's low and the upper edge of the pivotal shelf
- 7,643.50 (SPX 7,574) Tuesday's session low and the one-month low, the most important level on the board, and its cash equivalent lands on the implied one-day move low that held through Tuesday's session
- 7,632.67 (SPX 7,563) Pivot S1, the first computed level beneath the monthly low
- 7,626.75 (SPX 7,557) 1 Standard Deviation Support carrying the 100-day average at 7,626.08, the structural line whose sustained loss would mark this as more than a pullback
- 7,614.63 (SPX 7,545) 2 Standard Deviation Support, reinforced by the 40-day average stall reference at 7,613.50
- 7,609.33 (SPX 7,539) Pivot S2, with 3 Standard Deviation Support at 7,605.34 immediately beneath it
- 7,575.17 (SPX 7,505) Pivot S3, effectively coincident with the primary put side support base published at 7,570.35, making 7,570 to 7,575 the deepest structural objective in view
Primary Setup: SHORT ES from the 7,700 to 7,705 zone on a retest of Tuesday's session high, where the modeled gamma-flip level at 7,703.35 sits 2.35 points above that high and gives an unusually precise place to define risk. Stop 7,727, above both Pivot R2 at 7,724.33 and the modeled volatility threshold at 7,725.35, so that a stop-out requires reclaiming the stabilizing side of the positioning structure rather than merely tagging it. Targets at 7,666.83 first, the computed Pivot Point, 7,643.50 second at Tuesday's session low and one-month low, and 7,626.75 third where 1 Standard Deviation Support carries the 100-day average at 7,626.08, taken only if momentum extends through the second target on expanding volume. From a 7,702.50 entry midpoint that is 24.50 points of risk against 35.67, 59.00 and 75.75 points of reward, roughly 1.5 to 1, 2.4 to 1 and 3.1 to 1. Half size is appropriate given that the interest rate decision, the rate statement and the Summary of Economic Projections all land at 02:00 PM ET with the press conference at 02:30 PM ET, and retail sales at 08:30 AM ET is forecast at 0.8 percent against a negative 0.6 percent prior. Pricing is likely to be disorderly between 02:00 PM and 02:45 PM ET, a volatility-index expiration at 09:30 AM ET can distort early pricing, and the cash open at 09:30 AM ET sets the session's first directional test. A sustained move above 7,727, and in particular an hourly close above the 7,741 to 7,748 band where the 20-day average and Pivot R3 sit, negates the thesis. The standing counter-argument is the oscillator set, since a 14-day stochastic percent K of 12.51 at a one-month low is the configuration from which relief rallies start, which is why this is defined at a specific confluence rather than sold into weakness.
Wednesday is a decision session rather than a trend session. At-the-money implied volatility on the cash index for Wednesday is 19.0 percent, implying roughly 119 basis points of movement, about 90 points on the cash index at Tuesday's close, which is materially wider than the 14-day average true range of 66.49 points. That is the options market stating plainly that it expects an outsized session, and the expansion is scheduled for 02:00 PM ET.
 Short
Short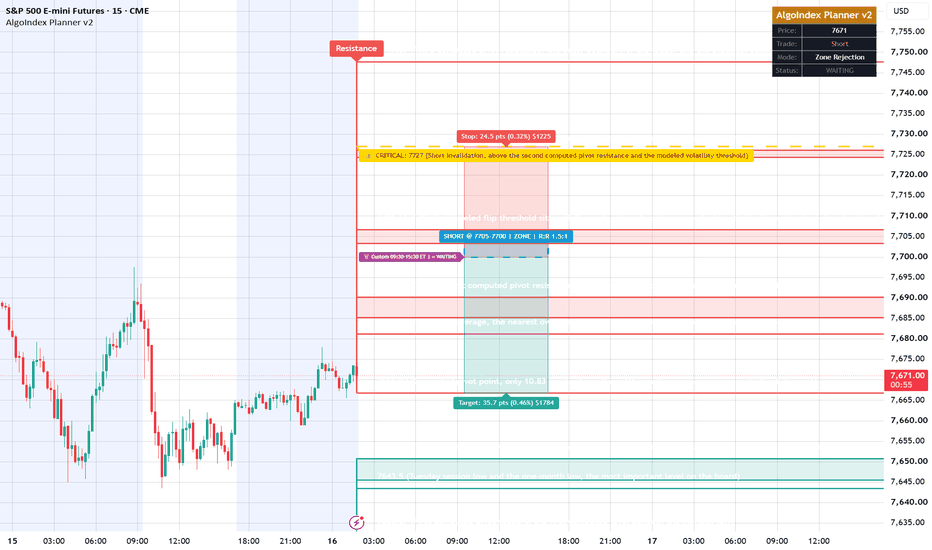
XAUUSD — Technical Analysis | Descending Trendline Setup🟡 XAUUSD — Technical Analysis | Descending Trendline Setup
📊 Market Structure: Bearish-to-neutral
💰 Current Price: ~4,330
🔻 Key Resistance
4,400–4,450 → Immediate resistance / descending trendline confluence
4,680–4,700 → Major resistance zone
🟢 Key Support
4,280 → Primary support
4,240 → Strong support / trendline area
📈 Bullish Scenario
If price holds above 4,280 and breaks the descending trendline with confirmation, a move toward 4,400–4,450 becomes technically possible.
A sustained breakout above this zone could shift the structure toward 4,500+.
📉 Bearish Scenario
A clear break below 4,280 may expose the 4,240 support area.
Failure to hold 4,240 would weaken the current recovery structure further.
🎯 Technical Bias
Price is compressed between strong support and the descending trendline. The key confirmation is a breakout rather than anticipating the direction.
⚠️ Educational technical analysis — not financial advice. Always manage risk and wait for confirmation. Long 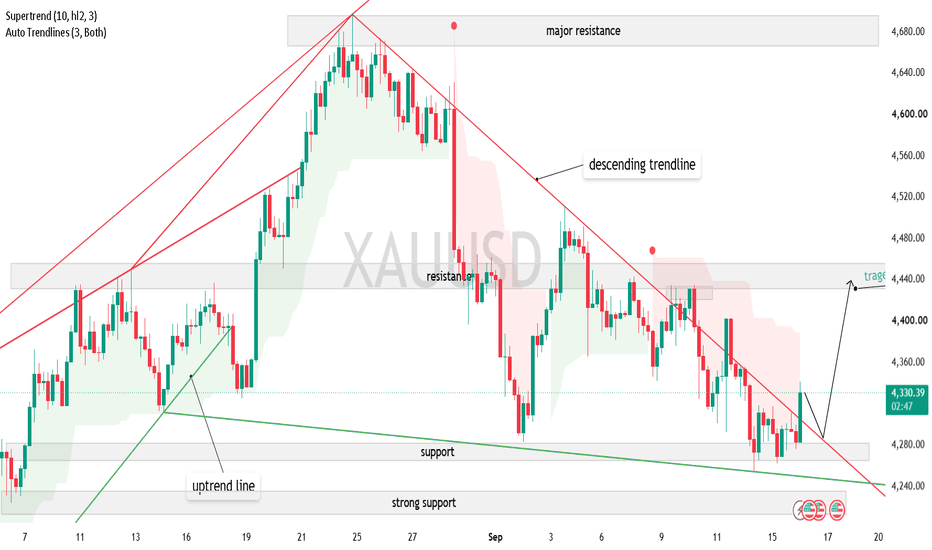
The real opportunity has arrived—do you dare to wait?Gold prices fluctuated yesterday, rising and falling back, before rebounding from a low. After a slight gap down at the open, prices rallied to around 4355 before falling back under pressure. Prices dipped sharply during the session, reaching a low of 4253 before quickly recovering some of the losses. The daily chart ultimately closed with a long lower shadow bearish candlestick. From the daily chart, gold has been maintaining an alternating up-and-down oscillation rhythm recently, which is also the core pattern of the current market. Technically, on the daily chart, the gold price has effectively broken through the 4300 mark with a large bearish candlestick. The 5-day and 10-day moving averages are opening downwards, and the rebound highs have been consistently limited to around 4350 USD. At the same time, the MACD histogram continues to expand, and the bearish pattern remains relatively clear. However, it should be noted that gold has fallen by more than $400 in the previous two weeks, and short-term oversold signals have begun to accumulate. From the daily chart, although gold has risen in the past two weeks, the overall trend is still mainly a slow decline. Some of the rises were mainly driven by safe-haven sentiment. Safe-haven funds cannot continuously drive up prices, and such rises are difficult to sustain in the long term. Therefore, as long as there has been a significant bubble-like increase in the price during the previous upward trend, a pullback at the end of the trading day or at key levels is a normal market correction. However, it remains difficult for gold to experience a significant and continuous decline in the near term. Thus, the current trend of gold can be summarized as follows: the downtrend is clear, but there is a tug-of-war between the potential for further decline and the short-term oversold condition, leaving the market in a dilemma. Looking at the 4-hour chart, the downward wave is still unfolding. The price is exhibiting a weak, stepped downward trend within a descending channel. The price is repeatedly pressured around the trendline, slowly declining in a weak, oscillating manner. Although the pace of decline is relatively slow, the weak structure remains unchanged. Currently, the 4-hour downtrend line resistance has moved down to around 4360, the Bollinger Band middle line resistance is at around 4330, and the secondary highs of the steps are concentrated in the 4400-4430 area. Among these, 4400-4430 can be considered an important dividing line between strength and weakness. If the price is trading below this area, the short-term weak structure remains unchanged for the time being.
Therefore, today's strategy remains to look for opportunities to short near the Bollinger Middle Band, while also paying close attention to the possibility of new lows below. Meanwhile, considering that gold has already experienced a significant pullback, it is not advisable to blindly short at low levels. The key is to wait for a rebound to the resistance area before looking for a more reasonable opportunity to short. In summary, today's gold trading strategy is to primarily sell on rallies and secondarily buy on dips. The key resistance level to watch in the short term is 4320-4340, while the key support level is 4250-4230. Short 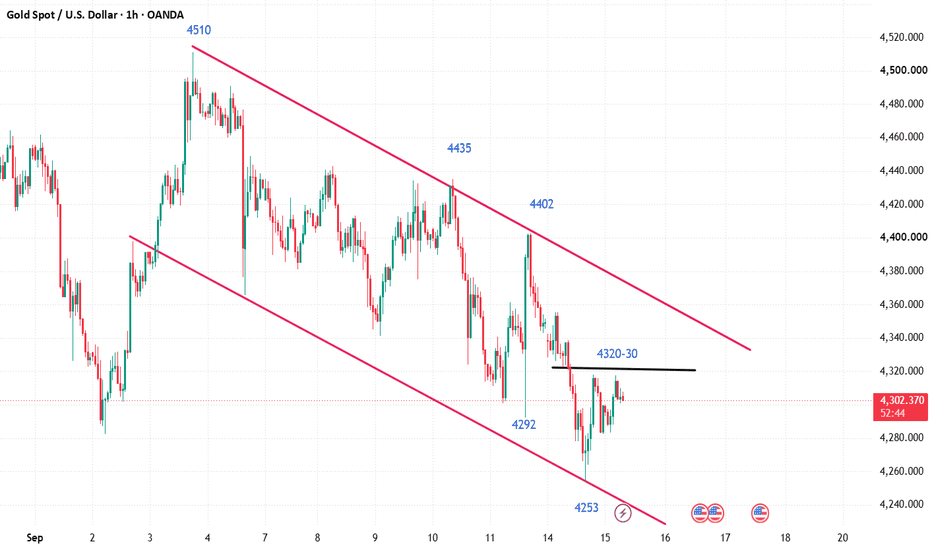
XAUUSD — 15M BEARISH REVERSAL SETUPGold has made a strong bullish move into a key resistance/supply zone around 4,337–4,343. Price is now showing signs of rejection from this area, making a potential short-term bearish setup worth watching.
📌 Trade Idea — SHORT
Entry Zone: 4,337–4,343
Key Resistance: 4,340
First Support: 4,290
Next Support: 4,278–4,271
🔎 Why I'm Watching This Setup
🔹 Supply zone: Price has reached an area where sellers could step back in.
🔹 Sharp rally: Gold moved rapidly from the 4,280s into the 4,340 area, leaving price extended in the short term.
🔹 Rejection: Price is struggling to continue higher after entering the resistance zone.
🔹 Major intraday level: The 4,290 area is an important level to watch if sellers gain control.
Confirmation
I would look for:
Rejection from 4,337–4,343 → bearish structure on 15M → break below nearby support → continuation lower.
If Gold breaks and holds above the 4,343 resistance zone, the bearish idea becomes weaker and the setup should be reassessed.
🎯 Potential downside areas:
4,302 → 4,290 → 4,278
⚠️ This is a technical-analysis idea, not financial advice. Gold can move quickly around major economic events, so manage risk carefully.
XAUUSD has reached a critical resistance zone. Will sellers defend 4,340, or will Gold break through and continue higher? Short 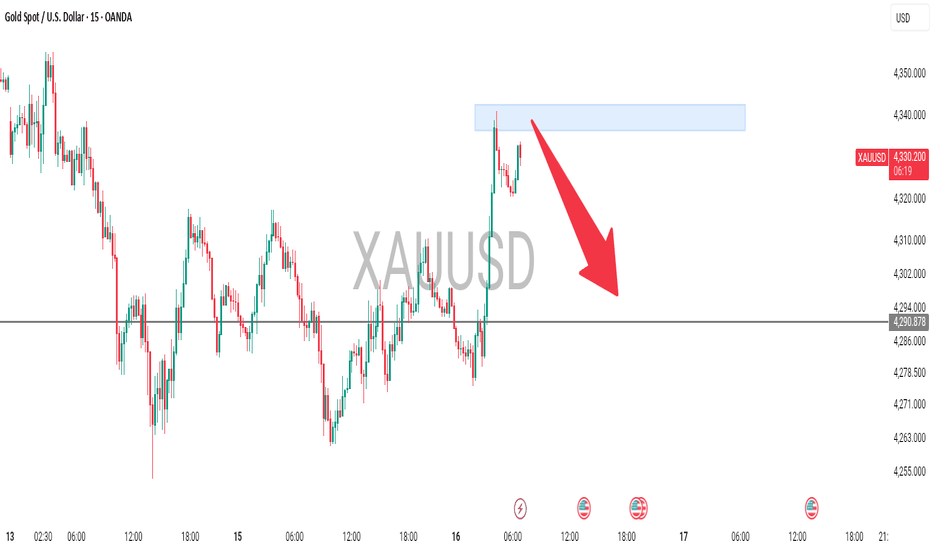
GOLD: False Breakout at Strong Support Zone — Reversal Setup?GOLD: False Breakout at Strong Support Zone — Reversal Setup?
Gold is currently testing a strong support zone around 4,285, where price has repeatedly reacted in the past.
The recent movefbelow this level appears to be a possible false breakout, with price quickly recovering back above the support area. If this structure holds and buyers continue to step in, gold could begin a recovery toward the next resistance zone.
The first key level to watch is 4,390. A confirmed breakout above this zone could open the way toward the next major target around 4,470.
Key levels:
🟢 Support: 4,285
🎯 Target 1: 4,390
🎯 Target 2: 4,470
For now, the key area remains 4,285. A sustained move back below this support would weaken the bullish reversal scenario and invalidate the setup shown on the chart.
You can find more details on the chart.
Thank you! 🍀
⚠️PS: Do your own analysis and use your own strategy to join the trade.
❤️ If this analysis helps your trading day, please support it with a like or comment ❤️
Long 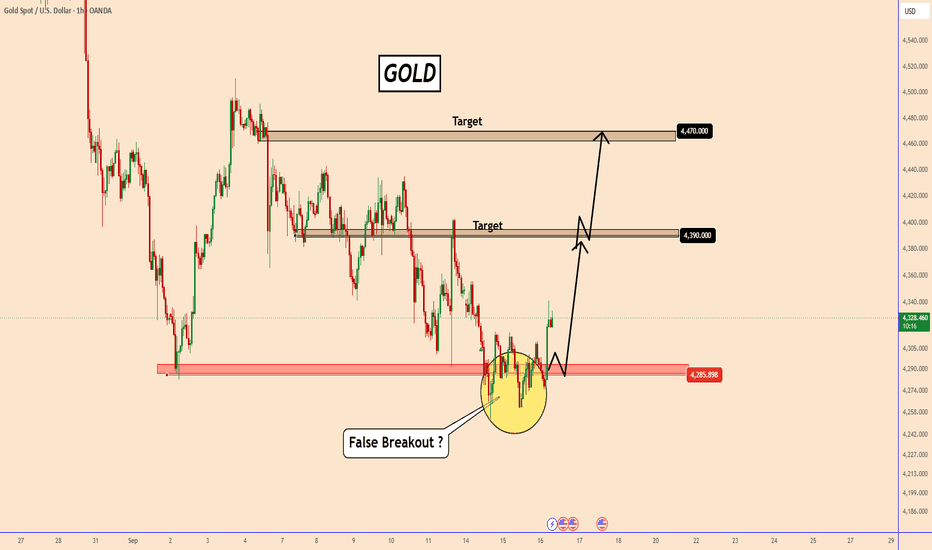
Crude Oil (CL) Analysis, Key-Zones, Setup for Wed (Sep 16)Bias: October crude settled Tuesday at 105.83, up 4.44 dollars or 4.38 percent, after trading a 5.54 dollar session between 106.75 and 101.21 and closing in the top 17 percent of that range. The high is the headline, because 106.75 is also the published 52-week high, the 13-week high and the one-month high, so crude did not merely rally, it printed a new annual peak and held nearly all of it into the settle. This is the instrument driving the rest of the complex: the surge in crude is what lifted inflation expectations, pushed benchmark 10-year Treasury yields above 5 percent for the first time since 2007, firmed the dollar and pressured equities and gold. The supply story behind it is concrete rather than speculative. A crucial Saudi pipeline struck earlier this month will be mostly out of service for three to five weeks, the conflict involving Iran is described in trade commentary as now in its seventh month, and risk around the Strait of Hormuz has opened a price gap of more than 40 dollars between crude grades. Brent settled at 108.75 dollars, up 2.9 percent, and diesel settled at 5.2620 dollars a gallon, described as the highest on record, which is the clearest evidence that the tightness is physical rather than financial. The technical condition is a powerful confirmed uptrend that is also stretched. Price sits above every average on the board, from the 5-day at 102.93 to the 200-day at 74.18, and the contract is up 84.16 percent year to date. The 9-day directional index reads 51.64 with the positive directional indicator at 36.34 against a negative of 5.04, and the multi-indicator composite reads 100 percent buy at maximum strength, the strongest reading that indicator set produces. Against that, the 14-day stochastic percent K sits at 91.80, about as overbought as these readings get. Bias stays higher while above 102.30, favouring pullbacks into 103.40 to 104.60 rather than chasing the annual high, but the risk is scheduled rather than vague: industry data released after Tuesday's close showed a crude build of 7.1 million barrels against a 1.8 million draw forecast, and the official government figure lands at 10:30 AM ET.
Resistance:
- 113.52 Pivot R3, the outer boundary of the computed ladder, reachable only on a genuine supply escalation
- 110.14 Pivot R2, effectively paired with the 3 Standard Deviation Resistance at 109.99 to form a defined upper shelf
- 109.99 3 Standard Deviation Resistance, the practical ceiling for an ordinary trending session
- 109.23 2 Standard Deviation Resistance, the first genuinely extended objective above the ladder's first rung
- 108.23 1 Standard Deviation Resistance, sitting 0.25 above Pivot R1 so the two form a single band
- 107.98 Pivot R1, the primary upside objective for a continuation session, with the 14-day relative strength reference at 107.50 just beneath it
- 107.15 the computed upside objective from the same level set that produces the pivot ladder
- 106.75 the 52-week high and Tuesday's session high, the line separating continuation from failure, and with the annual high and session high being the same print there is no supply overhead above it within the year
Support:
- 105.63 the overnight session high, the immediate reference beneath the settle that a recovery must reclaim
- 104.69 the overnight session low, where the post-settle give-back found buyers
- 104.60 the computed Pivot Point, nine cents beneath that low, making 104.60 to 104.69 the session's first decision band
- 103.43 1 Standard Deviation Support, the lower edge of the preferred entry zone, with the 14-day stochastic stall reference at 103.84 just above
- 102.44 Pivot S1 with 2 Standard Deviation Support at 102.43 one cent away and the 14-day relative strength reference at 102.39 beneath, three independent methods inside five cents and the structural line for risk
- 101.67 3 Standard Deviation Support, the statistical extreme of the downside band
- 101.21 Tuesday's session low and the base of the expansion day, whose loss means the entire Tuesday advance has been given back
- 99.06 Pivot S2, the first level beneath the round 100 handle
- 96.90 Pivot S3, the outer boundary of the ladder, with the 38.2 percent retracement of the four-week span at 96.39 just beneath it
Primary Setup: LONG CL from the 103.40 to 104.60 zone on a pullback into the band running from the computed Pivot Point at 104.60 down to 1 Standard Deviation Support at 103.43. Stop 102.30, beneath the three-method confluence at Pivot S1 102.44, 2 Standard Deviation Support 102.43 and the relative strength reference 102.39, so that a stop-out requires losing all three together rather than tagging any one. Targets at 106.75 first, the 52-week high and Tuesday's session high, 107.98 second at Pivot R1 with the computed objective at 107.15 beneath it, and 110.14 third at Pivot R2 paired with 3 Standard Deviation Resistance at 109.99, taken only if a supply catalyst carries price through the second target on expanding volume. From a 104.00 entry midpoint that is 1.70 dollars of risk against 2.75, 3.98 and 6.14 dollars of reward, roughly 1.6 to 1, 2.3 to 1 and 3.6 to 1. Half size is appropriate and the reason is specific: government crude inventories land at 10:30 AM ET forecast at a 1.5 million barrel draw, while industry data released after Tuesday's close estimated a 7.1 million barrel build, so that print carries an unusually wide distribution, and the interest rate decision with its Summary of Economic Projections follows at 02:00 PM ET with the press conference at 02:30 PM ET. Pricing is likely to be disorderly between 02:00 PM and 02:45 PM ET. A sustained move beneath 102.30, and in particular a close beneath 101.21, negates the thesis and argues for the mirror trade toward 99.06.
One sizing note specific to this instrument. The 14-day average true range of 3.92 dollars is 3.74 percent of spot, roughly four times the equivalent percentage on the broad equity index, so crude is by a wide margin the most volatile instrument in this package and position size belongs to that percentage rather than to the apparent narrowness of a dollar-denominated stop. The October contract also expires within roughly a week, so anyone carrying risk past the roll should re-derive these levels on the November contract rather than transferring them across.
 Long
Long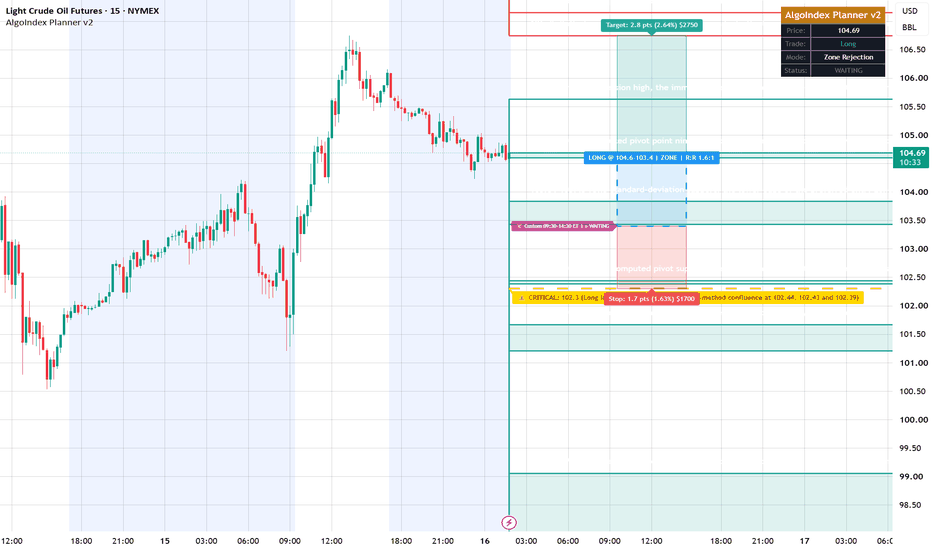
Long 
DeGRAM | XAUUSD is extending the correction📊 Technical Analysis
● XAU/USD remains below the major descending resistance line and has now broken beneath the previous key support around 4,300. The sequence of lower highs and lower lows keeps the broader 3H structure bearish.
● Price is moving inside the local bearish channel, with the 4,320–4,350 resistance zone becoming the main area for a possible corrective rebound. If sellers defend this zone, the next downside objective remains the 4,180–4,200 target zone shown on the chart.
💡 Fundamental Analysis
● Gold remains under pressure as the Fed begins its September 15–16 meeting. Markets are heavily pricing a 25 bp rate hike, while U.S. Treasury yields have climbed above 5% and the dollar remains firm. At the same time, oil above $108 is reinforcing inflation concerns, which is keeping rate expectations elevated despite ongoing Middle East tensions.
✨ Summary
● Bearish continuation remains the main scenario while XAU/USD stays below 4,320–4,350; target 4,180–4,200. A sustained recovery above resistance would weaken the bearish setup.
Share your opinion in the comments and support the idea with a like. Thanks for your support! Short 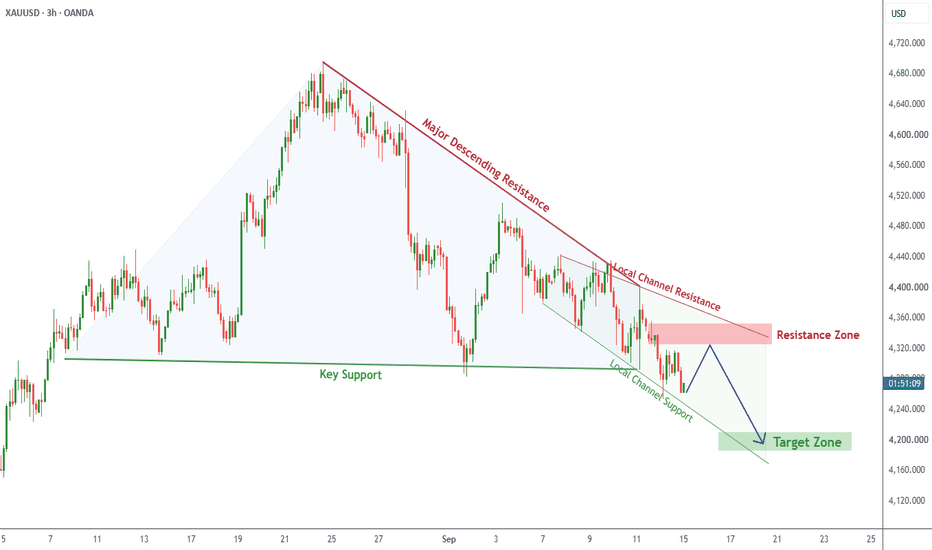
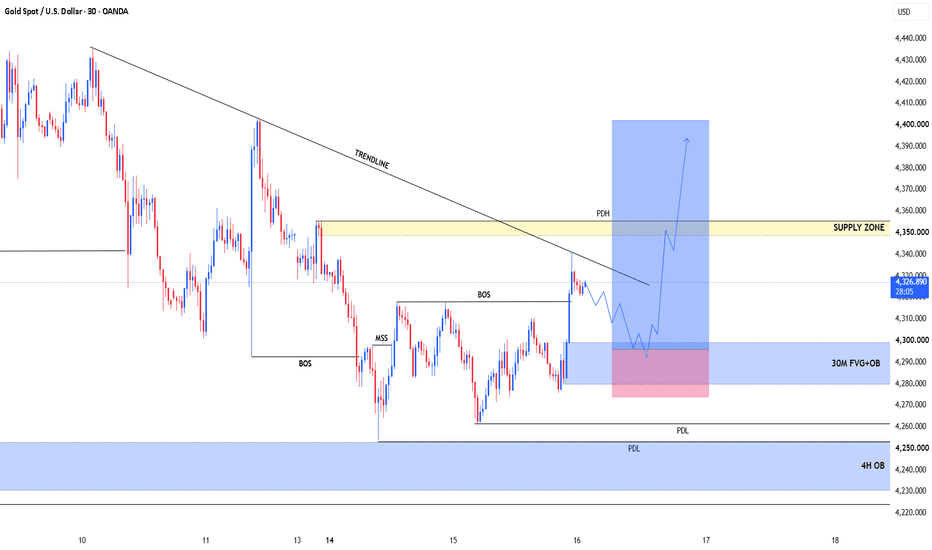
XAUUSD — 30M Market Structure AnalysisGold is currently trading around 4,326, with price approaching a descending trendline and a marked supply zone.
🔎 Technical Structure
Price has been respecting a descending trendline, keeping the broader structure under pressure.
A Market Structure Shift (MSS) followed by a BOS suggests a potential short-term change in order flow.
The 4,280–4,300 area is marked as a 30M FVG + OB, which could act as an area of interest if price retraces.
Below that, the 4H OB around 4,230–4,250 provides a deeper structural reference.
The 4,350–4,360 supply/PDH area remains an important resistance zone.
📈 Bullish Scenario
If price retraces into the 30M FVG + OB and shows bullish confirmation on a lower timeframe, the next areas to monitor would be:
4,330 → 4,350 → 4,360
A sustained break and acceptance above the descending trendline and supply zone could indicate further upside toward the higher marked levels.
📉 Bearish Scenario
If price rejects the trendline/supply area and breaks the 30M FVG + OB, attention could shift toward:
4,280 → 4,260 → 4,230–4,250
Confirmation should come from price action/market structure rather than assuming the projected path will occur.
📝 TradingView Idea Description
XAUUSD | 30M Structure & Key Levels 🔍
Gold is approaching a key confluence of the descending trendline and the 4,350–4,360 supply area. Below current price, the 4,280–4,300 region contains a 30M FVG + OB that may become relevant on a retracement.
I’ll be watching how price reacts around these areas and looking for lower-timeframe confirmation before considering the next directional move.
Key Levels:
🔹 4,280–4,300 — 30M FVG + OB
🔹 4,350–4,360 — Supply / PDH
🔹 4,230–4,250 — 4H OB
This is technical market analysis for educational purposes, not financial advice. Price can invalidate either scenario.
#XAUUSD #Gold #Forex #PriceAction #MarketStructure #SMC #ICT #TechnicalAnalysis Long