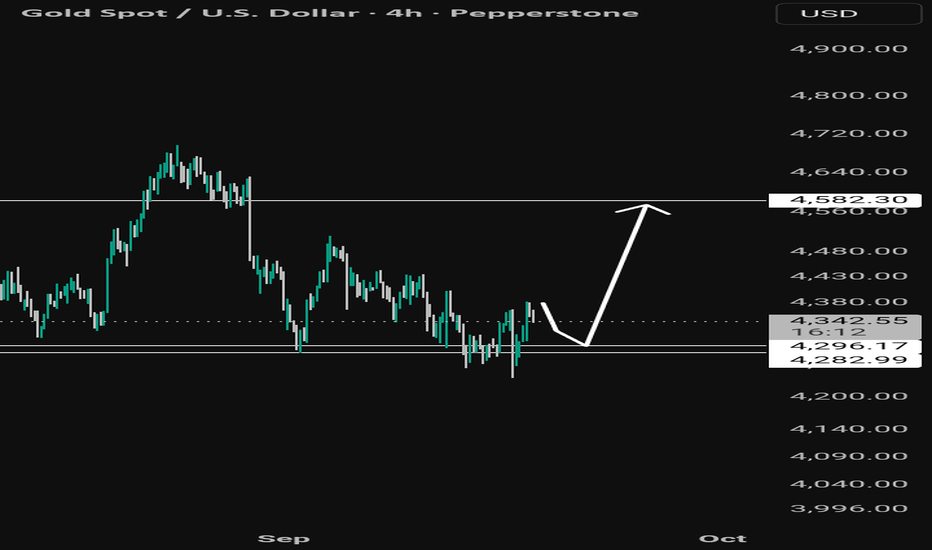
Long
Long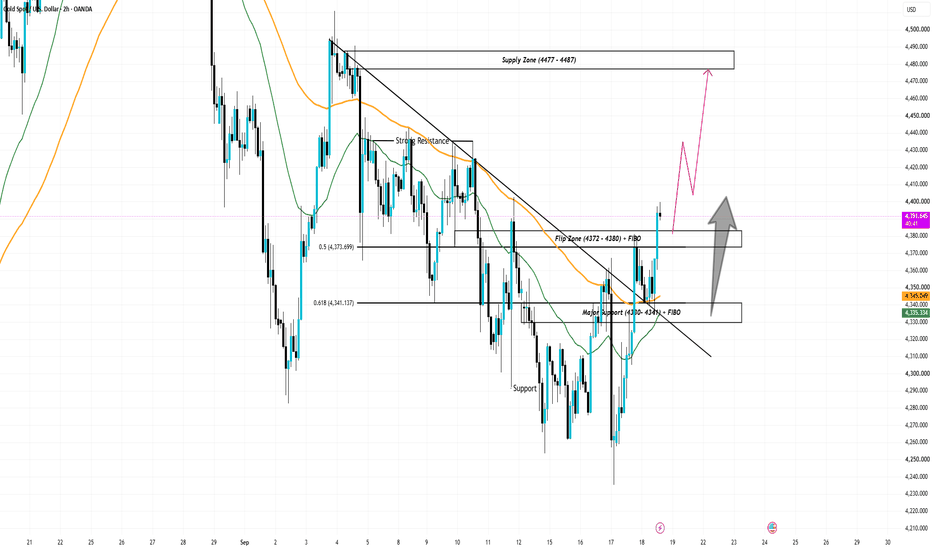
Short 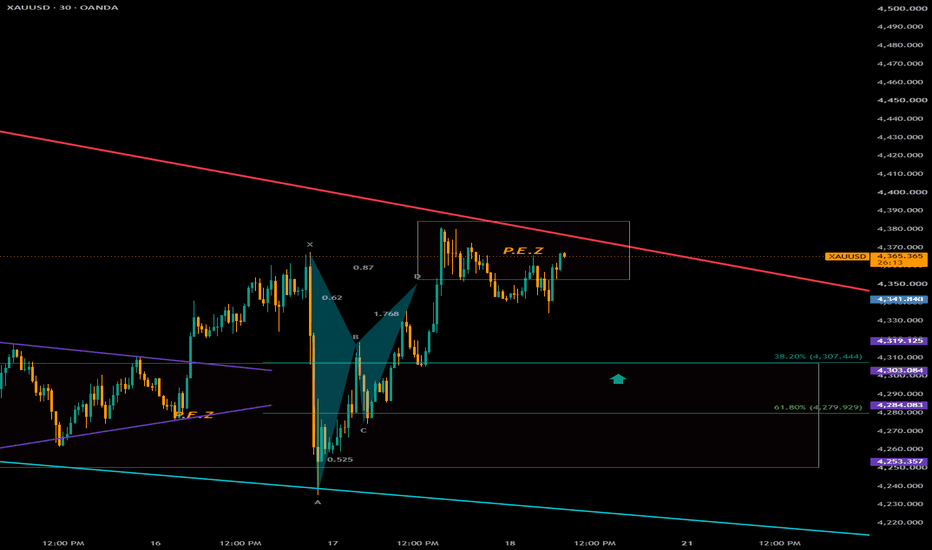
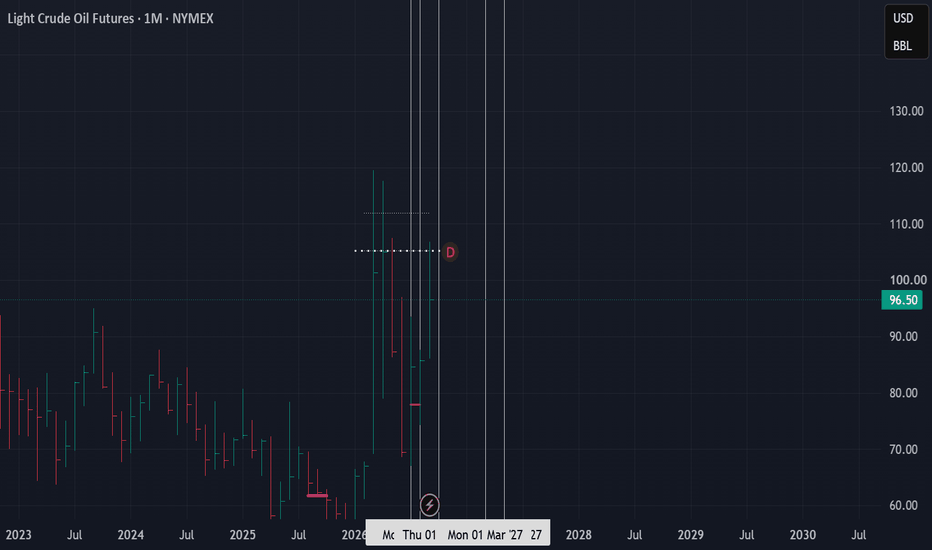
Oil: Correction Before the Next Leg HigherOil continues to trade within an ascending channel after a strong bullish impulse, with price currently around 100.80 and testing an important resistance area between 100.75 and 106.38, where the 0.79 Fibonacci level and previous local high are located. From a technical perspective, such a strong advance into resistance increases the probability of a corrective phase and accumulation before another potential upside move. The main support zone remains 93–90, where the 0.5 and 0.382 Fibonacci levels overlap with the accumulation area on the chart. A deeper correction toward 85.94 is also possible, but this would remain a secondary scenario while the ascending channel is intact. Fundamentally, the oil market remains heavily influenced by supply disruptions and geopolitical risk in the Middle East. Recent attacks and infrastructure disruptions pushed Brent and WTI above $100, while easing concerns over the restoration of Saudi export capacity have recently triggered some profit-taking and pressure on prices. The broader supply picture remains tight: the IEA reported substantial inventory declines and projected a 1.8 million barrels per day global oil-market deficit for Q3 2026 in its August report, although it also expects demand to contract in 2026 before returning to growth in Q4. At the same time, the U.S. is on track for record crude production of around 13.8 million barrels per day in 2026, which could provide additional supply and limit upside if geopolitical pressure decreases. OPEC+ has also maintained its September production requirements for October, keeping supply policy closely tied to market conditions. The main technical scenario is therefore a correction toward 93–90 followed by a bullish reaction and continuation higher. If buyers regain control, the first major target is 106.38, followed by 113.65 and 122.91. A confirmed breakout and hold above 106.38 would strengthen the continuation of the long-term bullish structure. Tactically, I would avoid chasing price directly into the 100.75–106.38 resistance zone and instead watch how price reacts around 93–90. As long as the ascending channel remains intact and the 90 support level holds, the bullish structure remains technically valid, while a sustained break below 90 would increase the probability of a deeper correction toward 85.94.
 Long
Long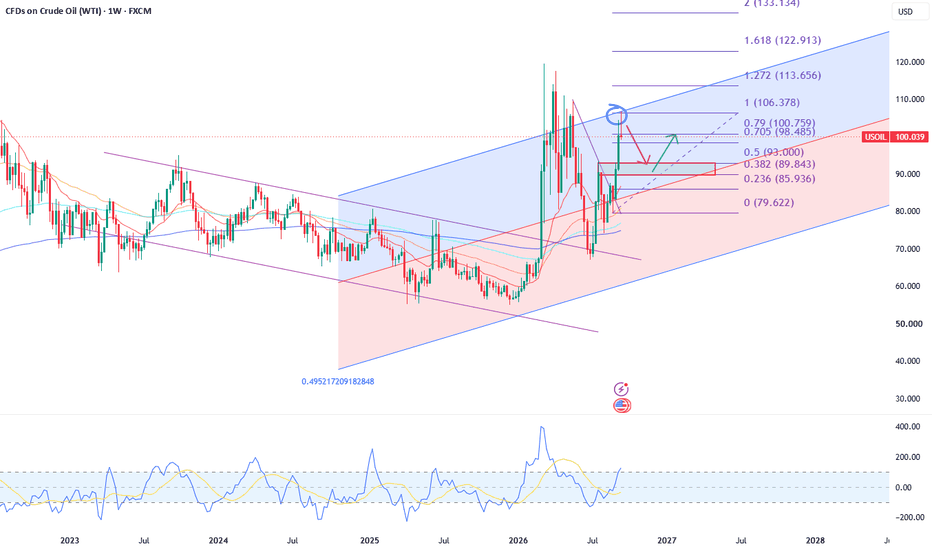
XAU/USD 18 September 2026 Intraday AnalysisH4 Analysis:
-> Swing: Bullish.
-> Internal: Bearish.
Bias and analysis to remain the same as analysis dated 30 June 2026.
Price did not print bullish CHoCH to indicate bullish pullback phase initiation. Price instead printed a new low followed by a bullish CHoCH
Price is currently trading within and established internal range, however, I will continue to monitor price with respect to depth of pullback.
Intraday expectation:
Price to trade up to either premium of internal 50% EQ, or H4 demand zone before targeting weak internal low, currently priced at 3,942.100.
Note:
Gold remains volatile as tensions between the US, Israel, and Iran keep safe‑haven demand elevated.
Markets are reacting quickly to every headline, while uncertainty around the Fed’s easing path and shifting U.S. policy under President Trump, especially tariffs continues to fuel choppy price action.
For newer traders, the key is simple, stay flexible and manage risk carefully, as fast spikes and sudden reversals are a normal part of the current XAU/USD environment.
H4 Chart:
M15 Analysis:
-> Swing: Bearish.
-> Internal: Bullish.
Price has printed according to yesterday's analysis dated 17 September 2026 whereby I mentioned, in intraday analysis, due to the narrowing of the internal range, price could potentially strong internal high and print a bullish iBOS as we are also seeing a drastic reduction in the depth of the internal range.
Price is currently trading within an internal low and fractal high. CHoCH positioning is the same as the fractal high. CHoCH positioning is denoted with a blue dotted horizontal dotted line.
Intraday expectation:
Price to trade down to either discount of internal 50% EQ, or M15 supply zone before targeting weak internal high, currently priced at 4,399.670.
Note:
Gold remains highly reactive on M15 as geopolitical risk continues to drive quick, headline‑led moves.
The tension between the US, Israel, and Iran is keeping safe‑haven demand elevated, with markets still sensitive to any sign of escalation.
At the same time, shifting US tariff policy under President Trump is adding extra uncertainty, fuelling sharp intraday swings and increasing the likelihood of sudden sentiment flips. Liquidity pockets and whipsaws remain common, making disciplined risk management essential.
Gold’s geopolitical premium is still firmly in place, and until tensions ease, short‑term volatility is likely to stay front‑loaded.
M15 Chart:  Long
Long
XAUUSD – Bullish Momentum Is BuildingIn my view, XAUUSD is clearly leaning toward a bullish scenario in the short term , as both the latest market developments and the current H1 technical structure support further upside.
From a fundamental perspective, gold is benefiting from a softer U.S. dollar and easing U.S. Treasury yields . Lower oil prices are also helping to reduce inflationary pressure in the bond market. Although the Fed remains relatively hawkish, the current reaction in the dollar and yields is creating a more supportive environment for XAUUSD.
Looking at the chart, the structure is also beginning to shift in favor of buyers. Price has broken above the descending trendline , then returned to retest the breakout area around 4,338–4,350 , where a clear bullish reaction developed. The quick recovery from this zone suggests that previous resistance is beginning to act as support.
My preferred scenario is bullish continuation following the breakout and successful retest . If buyers continue to defend 4,338–4,350 , XAUUSD could move toward 4,380–4,400 before extending the rally toward the main target around 4,430 .
As long as 4,338–4,350 remains protected, the short-term bullish structure stays valid . With the breakout already in place and the retest absorbed by buyers, 4,430 remains the next major upside target on my radar. Long 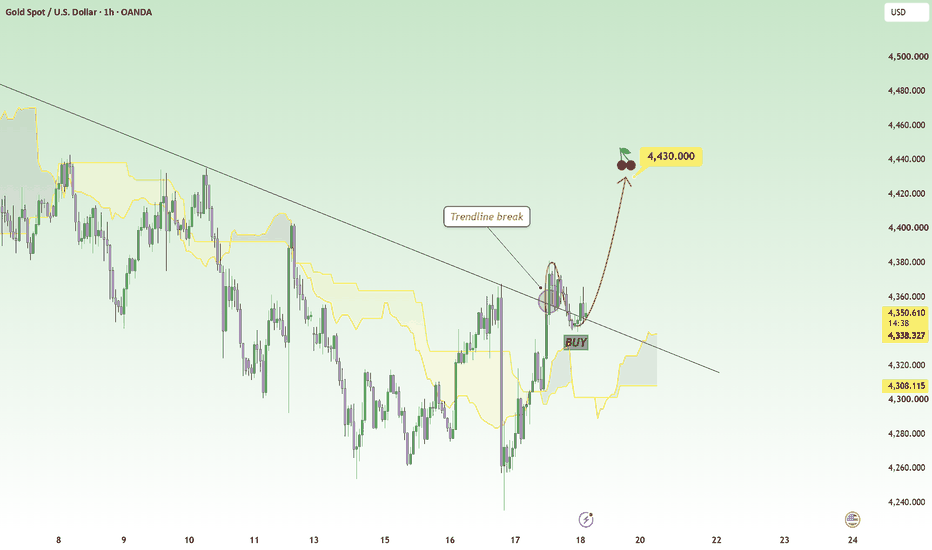
Gold Rebounds to Test the Next Resistance LevelGold prices (XAU/USD) OANDA:XAUUSD capitalized on a mild rebound during the Asian trading session on Friday, September 18, 2026, while remaining below the week's record highs.
-----------------------------------------------------------------------------------------------------------------
✅ UOB Group: US Monetary & Quantitative Outlook – Fed's New Rate Hike Cycle & December Bets (88%)
The US monetary landscape is reinforcing the Greenback's dominance against G-10 and Asian currencies:
- ⚡UOB Group's Exclusive Projection (DXY Reversal Catalyst): Analysts at UOB Group assert that the Federal Reserve's return to a new rate-hike cycle fundamentally alters the US Dollar's outlook. UOB notes: "As we now anticipate two additional Fed rate hikes, the narrowing of US interest rate differentials relative to G-10 nations—which had weighed on the DXY since late 2024—is likely to reverse and support the DXY going forward... We now see upside risks to our USD forecasts against both G-10 and Asian currencies."
- ⚡CME FedWatch Probabilities: October (54%) & December (88%): The CME Group FedWatch Tool indicates that the market is pricing in a 54% probability of a rate hike at the October meeting, surging to 88% for a hike in December 2026.
- ⚡North American Session Catalysts Tonight: Market participants await the release of US Industrial Production and Capacity Utilization data, as well as speeches from influential Federal Open Market Committee (FOMC) members later today.
-----------------------------------------------------------------------------------------------------------------
✅ Price Action Analysis (H1 Timeframe)
The H1 intraday structure confirms a transition from a bearish sell-off phase to a Bullish Reversal/Retest phase. After undergoing a liquidity sweep (a sharp spike) below the Demand floor—touching the green line at 4,235.460—gold launched an impulsive rally that successfully broke a series of local Lower Highs (LH) and established a new structure of Higher Highs (HH) and Higher Lows (HL).
At the 4,392.810 price level, the latest H1 candle is dominated by bullish movement pushing directly against the Resistance-Turned-Support (RBS) zone and the local Supply area within the 4,390.000 – 4,402.311 range (gray horizontal line).
The breakout above 4,380.000 indicates that buyers are in full control of intraday momentum.
-----------------------------------------------------------------------------------------------------------------
✅ Key Zones:
- ⚡Resistance / Supply Zone: The range of the 4,402.311 horizontal line (nearest local resistance), the green line at 4,434.913 (upper gray box / Major Supply Zone), and the green line at 4,511.158 (macro Lower High peak).
- ⚡Support / Demand Zone: The 4,340.000 – 4,360.000 range and the 4,280.000 – 4,300.000 range (lower gray box / Major Demand Zone).
-----------------------------------------------------------------------------------------------------------------
✅ Elliott Wave Analysis
Mapping the wave cycle movement on the H1 timeframe:
- ⚡ Wave Structure:
The impulsive rally from the 4,235.460 low toward the 4,380.000 range is calculated as Sub-Wave 1 (or Wave A). The corrective pullback to the 4,300.000 area is identified as the formation of Sub-Wave 2 (a micro zigzag correction).
- ⚡Current Status:
The impulsive green surge from the 4,300.000 level—currently hovering at 4,392.810—confirms the ongoing major expansion of the bullish impulsive Sub-Wave 3 (or Wave C).
- ⚡Projection:
Price action is projected to complete this Sub-Wave 3 thrust, breaking through the 4,402.311 horizontal line and crossing the LVN zone to target a test of the Major Supply Zone stronghold near the 4,434.913 green line. Long 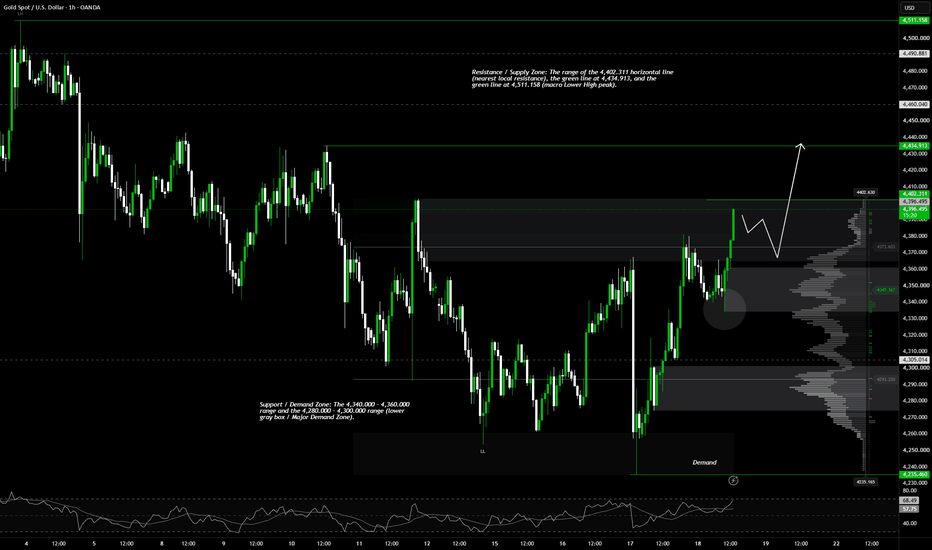
Nasdaq 100 (NQ) Analysis, Key-Zones, Setup for Fri (Sep 18)Bias: The Nasdaq-100 December contract settled Thursday at 29,743.00, up 486.25 points or 1.66 percent, the strongest single-session advance across the energy, metals and equity index contracts, and the one whose daily bar carries the cleanest trend shape. December opened at 29,271.00, printed its low at 29,247.75 just 23.25 points beneath the open and its high at 29,793.25, and settled 90.8 percent of the way up a 545.50 point range. The driver originated in the energy market rather than the technology sector: crude's decline eased the expected inflation path enough for equities and bonds to rally together a day after the Federal Reserve raised rates 25 basis points to 3.75 to 4.00 percent, the first increase since July 2023. Within that move technology led decisively, with the semiconductor sector fund gaining 3.4 percent against the technology index fund's 1.7 percent, a two-to-one leadership ratio that marks a genuine risk-on session rather than a defensive rotation. More than half of roughly three billion dollars of positive single-stock delta flow came from the mega-capitalisation complex and was driven by longer-dated call buying, which is a statement about earnings power in a higher-rate environment rather than a short-dated momentum chase. Structurally the index cleared its entire dealer-positioning stack in one session: the cash index closed at 29,436.60, above the call-side hedging boundary at 29,275, above the modeled volatility threshold at 29,070, above the primary gamma concentration at 29,000 and above the modeled gamma-flip level at 28,655. Those five figures are cash index levels; every other number in this note is the December futures contract, which settled 306.40 points above the cash index. It also carries the only positive dealer gamma notional in the complex at positive 6.28 million dollars with a gamma tilt of 1.06, a stabilising configuration heading into Friday's quarterly expiration, carried in the options positioning data rather than a verified calendar and unconfirmed. The caution is that the mechanical indicators have not confirmed: the multi-indicator composite still reads 16 percent sell at minimum strength, the 14-day directional index is 14.41 with negative direction 21.67 still above positive direction 16.47, and the five-day change is only 20.00 points, so one session has not reversed a fortnight of drift. In futures terms the settlement sits just 15.16 points beneath the 100-day average at 29,758.16, the tightest relationship on the board. Bias is constructive higher while the 29,566 to 29,623 confluence holds, with the 100-day average the decision line, and Friday's September quarterly expiration, carried in the options positioning data rather than a verified calendar and unconfirmed, the dominant structural fact of the session.
Resistance:
- 31,385.50 52-week high, ceiling of the larger structure at 5.52 percent above settlement
- 31,293.50 13-week high
- 30,487.08 Pivot R3, extended objective requiring roughly 1.8 average ranges
- 30,140.17 Pivot R2, sitting 30.92 points above the 1-month high
- 30,109.25 1-month high, the level whose breach ends the month-long range
- 29,941.58 Pivot R1, primary upside objective for the session
- 29,793.25 session high, minimum evidence the trend day is extending
- 29,758.16 100-day moving average, cleared intraday Thursday then given back, the decision line 15.16 points above settlement
Support:
- 29,623.24 20-day moving average, upper edge of the primary support band
- 29,594.67 Pivot Point, 28.57 points beneath the 20-day average
- 29,565.96 50-day moving average, completing a three-way confluence inside 57.28 points
- 29,480.05 5-day moving average, the level whose loss invalidates the setup
- 29,396.08 Pivot S1, first mechanical objective beneath the confluence
- 29,247.75 session low, 23.25 points beneath the open
- 29,053.00 1-month low, within 3.83 points of Pivot S2 at 29,049.17, the structural line of the range
- 28,850.58 Pivot S3, deepest level with mechanical basis for the session
Primary Setup: LONG NQ from the 29,566 to 29,623 zone on a pullback into the confluence where the 50-day average, the Pivot Point at 29,594.67 and the 20-day average sit within 57.28 points of one another, with the thesis resting on a trend bar that settled 90.8 percent up its range with its low 23.25 points beneath the open, and on the only positive dealer gamma reading in the complex. Stop 29,470, placed beneath the 5-day average at 29,480.05, since a break there would mean the three-way confluence failed on its first test after a trend day. Targets at 29,758 first, the 100-day average that Thursday cleared intraday and could not hold into the settlement, 29,941 second at Pivot R1, and 30,109 third at the 1-month high if momentum extends through the second target. The position carries half the normal allocation given a September quarterly expiration, carried in the options positioning data rather than a verified calendar and unconfirmed, in which roughly twenty percent of total US options expire or roll and whose delta-notional total is set to exceed June's record, since expiration flows can move price without conveying direction. Pricing is likely to be disorderly around the 9:15 AM ET industrial production release, and the cash open at 9:30 AM ET sets the session's first directional test, with Federal Reserve commentary from Bowman and Schmid carried on the news-feed calendar at 9:30 AM ET and 11:45 AM ET, both unconfirmed against a primary source. The overnight Bank of Japan decision, carried on the news-feed calendar at 11:30 PM ET on a tentative statement time and unconfirmed against a primary source, is the most duration-relevant scheduled item available, since a second major central bank tightening in the same week lifts global term premium and this is the most duration-sensitive of the equity index contracts. A decisive break beneath 29,470 negates the long case and opens Pivot S1 at 29,396.08 and then the 29,049 to 29,053 band where Pivot S2 at 29,049.17 and the 1-month low converge.
Friday is a decision session rather than a trend session. The 14-day average true range is 421.22 points, or 1.42 percent of the settlement, and Thursday's 545.50 point range exceeded that average by 124.28 points, so the baseline is already wide. For an expiration of this size the adjustment is upward rather than downward, and with the settlement sitting 15.16 points beneath the 100-day average, the session opens on the tightest relationship on the board.
 Long
Long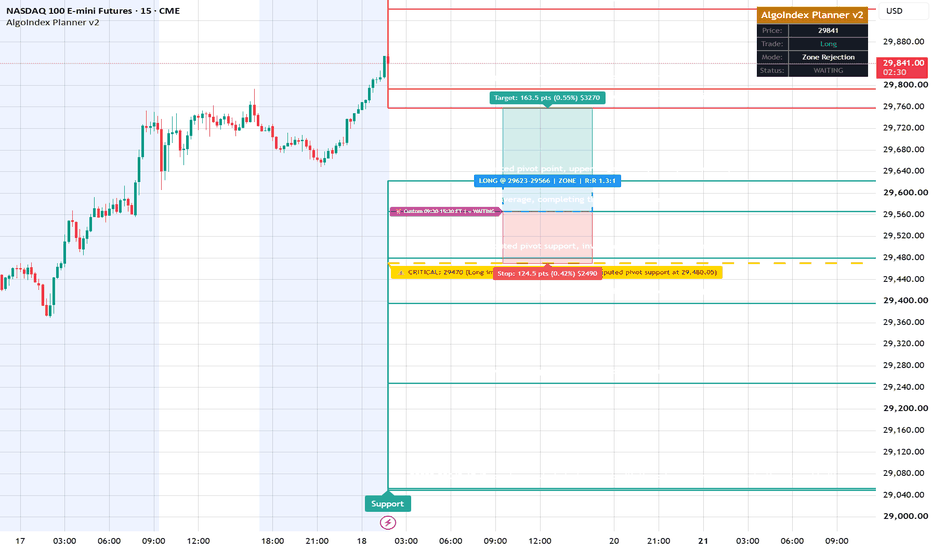
Long 
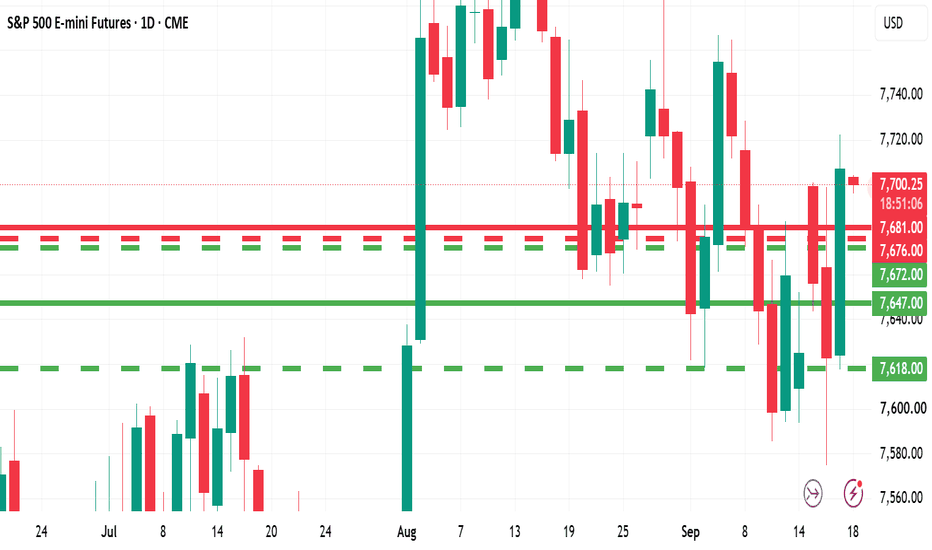
S&P 500 (ES) Analysis, Key-Zones, Setup for Fri (Sep 18)Bias: The December S&P 500 contract settled Thursday at 7,707.25, up 84.25 points or 1.11 percent, and against a prior close of 7,551.81 the cash index closed at 7,635.65 for the identical percentage gain. December opened at 7,624.00, printed its low at 7,617.50 just 6.50 points beneath the open and its high at 7,722.25, and settled 85.7 percent of the way up a 104.75 point range. The futures contract opened 1.00 point above its prior settlement with no gap; the cash index was closed overnight, and no cash opening print was captured for this note. The cause was not equity-specific: crude's decline eased the expected inflation path enough to let stocks and bonds rally together a day after the Federal Reserve raised rates 25 basis points to 3.75 to 4.00 percent, the first increase since July 2023, unanimously, with twelve of eighteen officials projecting one further increase this year and no cut next year. That the index gained 1.11 percent on a session when the ten-year inflation-protected auction cleared at a 2.653 percent high yield against 2.438 percent previously indicates the market is being carried by the inflation path rather than the rate path. Internal evidence is more mixed than the headline. Roughly ten billion dollars of negative index delta flow crossed during the day, combining zero-day put buying with zero-day call selling and including about twenty thousand customer-bought 7,550 cash puts opened near 10:00 AM ET, implying net market-maker selling pressure that was absorbed while the index still closed higher. Against that, single-stock flow ran about three billion dollars positive on longer-dated call buying, more than half from the mega-capitalisation complex, so the market bought companies for the medium term while hedging the index for the day. Semiconductors led at 3.4 percent against the technology index fund's 1.7 percent, and, down 12.81 percent on the day, the volatility index closed near 15.45. Dealer positioning is net negative at negative 610.377 million dollars of gamma notional, which amplifies directional movement rather than damping it. Against the advance, the 9-day directional index reads 25.41 with negative direction 25.55 against positive direction 12.63, a better than two to one negative skew above the trend threshold, so the short-horizon trend system has not confirmed Thursday's move. Structurally the settlement sits 0.90 points above the 50-day average and 26.14 points beneath the 20-day average, with a modeled volatility threshold 2.07 points beneath that average. Bias is constructive higher while the 7,676 to 7,682 band holds, with the 7,731 to 7,733 zone the decision line, and Friday's September quarterly expiration, carried in the options positioning data rather than a verified calendar and unconfirmed, the dominant structural fact of the session.
Resistance:
- 7,851.92 (SPX 7,780) Pivot R3, within 1.17 points of the 1-month high
- 7,850.75 (SPX 7,779) 1-month high, structural ceiling of the monthly range
- 7,787.08 (SPX 7,715) Pivot R2, roughly 1.1 average ranges above settlement
- 7,747.17 (SPX 7,676) Pivot R1, primary upside objective
- 7,733.39 (SPX 7,662) 20-day moving average, upper edge of the decision zone
- 7,731.32 (SPX 7,660) modeled volatility threshold, 2.07 points beneath the 20-day average
- 7,722.25 (SPX 7,651) session high, immediate ceiling
Support:
- 7,706.35 (SPX 7,635) 50-day moving average, 0.90 points beneath settlement
- 7,682.33 (SPX 7,611) Pivot Point, upper edge of the primary entry zone
- 7,676.05 (SPX 7,604) 5-day moving average, completing a confluence inside 6.28 points
- 7,642.42 (SPX 7,571) Pivot S1, invalidation reference for the setup
- 7,635.32 (SPX 7,564) modeled gamma flip level
- 7,633.51 (SPX 7,562) 100-day moving average, within 1.81 points of that modeled level
- 7,617.50 (SPX 7,546) session low, 6.50 points beneath the open
- 7,577.58 (SPX 7,506) Pivot S2, within 6.26 points of the primary gamma concentration
- 7,571.32 (SPX 7,500) primary gamma concentration and put side hedging boundary
- 7,537.67 (SPX 7,466) Pivot S3, deepest level with mechanical basis for the session
Primary Setup: LONG ES from the 7,676 to 7,682 zone (SPX 7,604 to 7,611) on a pullback into the confluence where the 5-day moving average and the Pivot Point sit within 6.28 points of each other, with the thesis resting on a bar that settled 85.7 percent up its range with its low 6.50 points beneath the open and on roughly ten billion dollars of negative index delta flow being absorbed without breaking it. Stop 7,640, placed beneath Pivot S1 at 7,642.42, since a break there opens the band where the 100-day average and the modeled gamma flip level converge within 1.81 points. Targets at 7,722 first (SPX 7,651, the session high), 7,747 second (SPX 7,676, Pivot R1), and 7,787 third (SPX 7,715, Pivot R2) if momentum extends through the second target. Half size given a September quarterly expiration, carried in the options positioning data rather than a verified calendar and unconfirmed, in which roughly twenty percent of total US options expire or roll and whose delta-notional total is set to exceed June's record, and given that dealer gamma is net negative so any directional impulse extends further than the compressed 9.75 percent historic volatility would suggest. Pricing is likely to be disorderly around the 9:15 AM ET industrial production release, and the cash open at 9:30 AM ET sets the session's first directional test, with Federal Reserve commentary from Bowman and Schmid carried on the news-feed calendar at 9:30 AM ET and 11:45 AM ET, both unconfirmed against a primary source. A decisive reclaim of the 7,731 to 7,733 zone unlocks Pivot R1 at 7,747.17 and then Pivot R2 at 7,787.08, while a decisive break beneath 7,640 negates the long case.
Friday is a decision session rather than a trend session. At-the-money implied volatility for the expiration is 13.8 percent, implying roughly 86 basis points of intraday movement, against a 14-day average true range of 71.77 points, or 0.93 percent of the settlement. The expiration-specific figure is the closer of the two forward estimates to the realised average range and is the more appropriate planning number, and with roughly twenty percent of all listed US options expiring or rolling, the flows set the session's character rather than its direction.
 Long
Long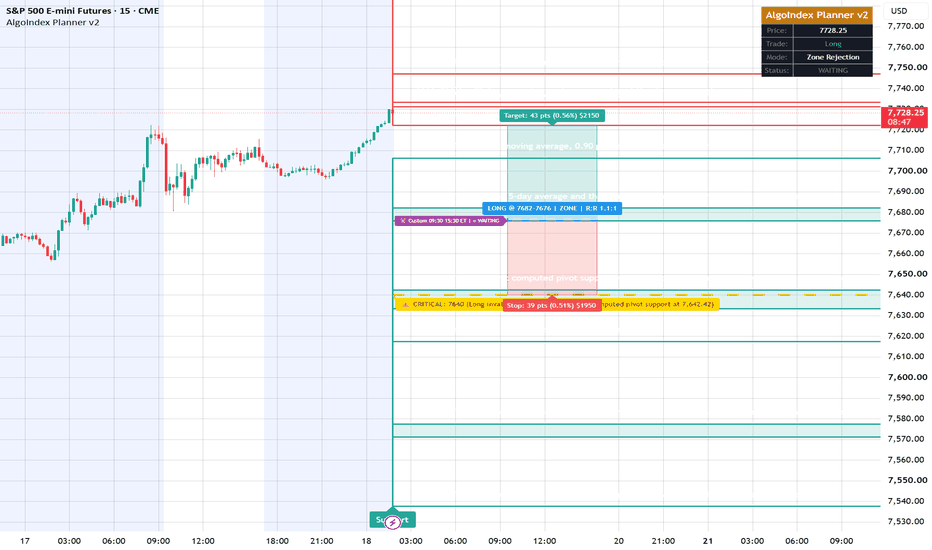
Long 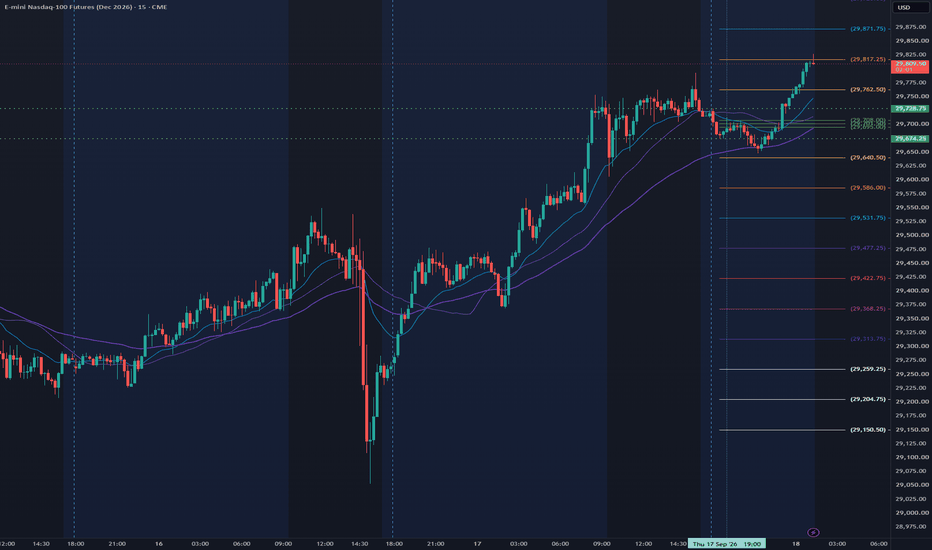
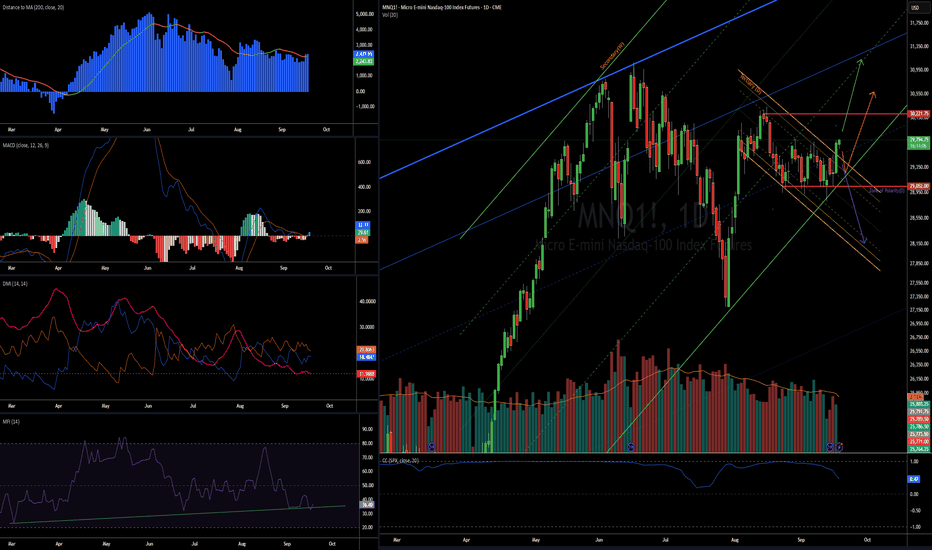
MNQ1! (Micro Nasdaq-100) – Daily – 9/17/26 – Journal EntryMNQ1! (Micro Nasdaq-100) – Daily – 9/17/26 – Journal Entry
Setup: MNQ underperforming SPX since Aug rally (lower high vs June). Broke above descending tertiary (yellow) channel today @ 29,739, but on weak volume. Don't believe it will be a breakaway-gap type move.
Read: Fragile, low-conviction breakout. Momentum indicators lean early-bullish.
Cautiously optimistic, watching for fakeout risk.
3 Scenarios:
1) Bull flag/RBR — holds above tertiary as new support, shallow base, +DI crosses -DI, breaks 30,221.75, continues up green (Secondary (W)) channel.
2) Fakeout/retest (base case) — fails back into tertiary, holds , bounce off the secondary (green) channel lower line or the 29,052 bounces, reclaims breaks above the teriary Channel.
(Long opportunity)
3) Bear case — Price falls back into the tertiary channel AND below the 2condayr Channel.... Bad case.
Watching: 29,052–30,221 range for price movement, for scenario 1,2,3.
NFA. My research only. Long
Long
Gold Holds Above Support – Can Buyers Build a Stronger Recovery?Market Structure
Gold is trading in a short-term bearish structure on the 4-hour chart. Although price has recently bounced from the latest swing low, it continues to trade below previous lower highs, indicating that sellers still have the broader advantage. The current move appears to be a technical rebound rather than a confirmed trend reversal.
Market Sentiment - Bearish
Buying interest has improved from the recent lows, but the overall structure remains under pressure. Unless price breaks back above key resistance, short-term sentiment continues to favor the downside.
Bullish Scenario
If price holds above the 4,320 support area and breaks above 4,380, buying momentum could strengthen and drive Gold toward the 4,450 resistance zone. A sustained move above that level would improve the short-term outlook and suggest buyers are regaining control.
Bearish Scenario
If price fails to hold above 4,320 and breaks lower, selling pressure could return and push Gold toward the 4,260 support area. A decisive break below that level would reinforce the current bearish trend.
────────────────────
Market Outlook
Gold is attempting to stabilize after an extended decline, but the overall structure remains cautious. Buyers need to reclaim key resistance before a stronger recovery can be confirmed.
────────────────────
Key Levels
First Resistance: 4,380
Second Resistance: 4,450
First Support: 4,320
Second Support: 4,260
────────────────────
Future Scenarios
A break above the first resistance would indicate improving buying momentum and could open the way toward the second resistance.
Conversely, a break below the first support would reinforce the bearish structure and expose the second support as the next downside objective.
────────────────────
Event Risk
Gold may remain sensitive to upcoming U.S. economic data, Federal Reserve policy expectations, Treasury yields, the U.S. Dollar, and overall market risk sentiment.
Price action remains the most important signal. If positive news fails to push Gold above the first resistance, upside momentum may remain limited. Conversely, a break below the first support would suggest that sellers remain in control.
────────────────────
Please share your view below:
Do you think Gold will extend its rebound from current support, or is another downside move more likely?
More market structure and key level updates will be shared regularly.
Long 
Short 
XAU/USD Bullish Reversal | Buy Zone Holds, 4,369 Target in FocusXAU/USD 15M — Bullish Buy Setup
Bias: 🟢 BULLISH
Gold has reacted strongly from the demand zone around 4,230–4,245 and formed a recovery with higher lows. Price is now holding above the marked buy/retest zone around 4,292–4,293, suggesting bullish continuation if this area remains supported.
📌 Trade Plan
Entry: 4,292–4,293
Stop Loss: 4,270.8
TP1: 4,320
TP2: 4,340
TP3: 4,360
Final Target: 4,369.4
Resistance / Supply: 4,365–4,380
Invalidation: A sustained 15M break below 4,270.8 weakens the bullish setup.
🔎 Key Structure
Demand → Bullish reversal → Higher lows → Retest of 4,292–4,293 → Continuation toward 4,369 Long 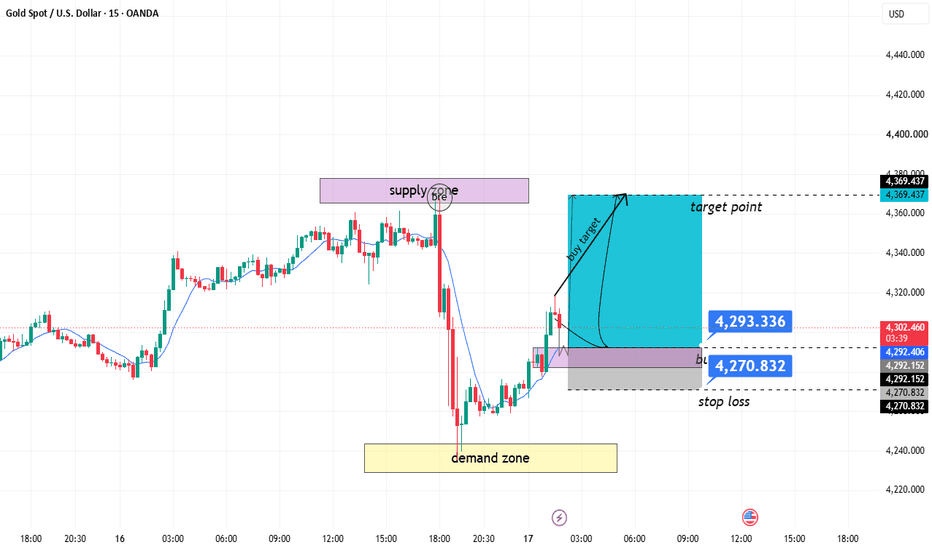
 Short
Short
Long