XAUUSDGold has been carving out a well-defined descending triangle since February 2026, with price compressing from a high near $5,400 down to current levels around $4,019. The upper trendline shows a clear series of lower highs, reflecting persistent seller control, while the lower support line has held with less steep declines, creating the classic converging structure.
Price is now trading right at the apex of the triangle — a zone historically associated with sharp volatility expansion. Recent price action shows tightening, choppy consolidation just above support, typical of the final stage before a decisive breakout.
Key levels to watch:
🔺 Resistance (triangle upper bound): ~4,100–4,150
🔻 Support (triangle lower bound): ~3,750–3,900
A confirmed break below support opens room toward the $3,500 area, while a break and hold above resistance would target a retest of the $4,600 zone. Given the compression, a decisive move in either direction is likely near-term.
Not financial advice — for educational/technical discussion purposes.
Futures market
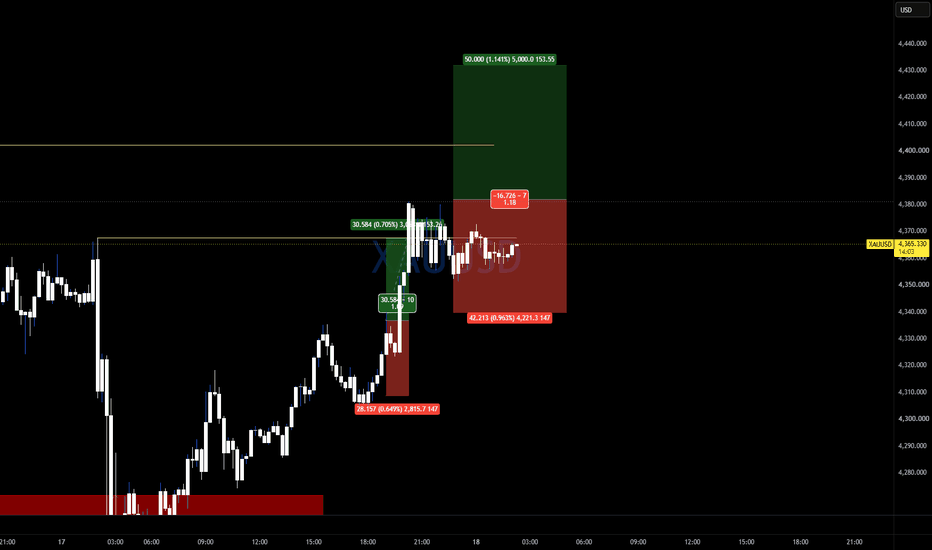
Day 3 Trading Journal | Trade 8 | Running Net P&L -50 pipTrade Plan
Entry: 3995.57
Stop Loss: 3982.90
Take Profit: 4050.27
At 1:1 (4007.74) : I'll book 50% profits and move my stop loss to breakeven, making the remaining position risk-free.
Market Bias
I'm not forcing a direction right now. I'll let the market confirm the move before making any changes.
If price closes below 3980, I'll exit the trade. I'm not closing because of a wick—only a candle close below 3980 will invalidate this setup.
Risk management first. Let the market do the rest.
Gold Exactly as Predicted! Perfect Drop, Keep Shorting!Regarding gold: The Federal Reserve has kept monetary policy unchanged since the last rate cut in December. Two key developments—the labor market's rebound from its February lows and the inflationary shock to the global economy caused by Trump's actions regarding Iran—have completely shattered widespread market expectations for a resumption of rate cuts. Consequently, the decline in gold prices falls within market expectations; the opening strategy I provided over the weekend aligns well with today's actual market movement. The price opened lower near 4001.7, dipped to a low of 3982.7 before rebounding, and has since retraced and fluctuated after hitting a high of 4020.7. For the remainder of the session, we are focusing on the key resistance zone at 4032–4040.
Looking at the 4-hour chart, the primary focus is on the resistance zone at 4032–4040 and the short-term support zone at 3955–3960. Our trading strategy is to look for short positions if the price faces resistance during a rebound.
Gold Trading Strategy:
1. Short gold in the 4032–4040 range; stop-loss at 4057; target 3955–3960; if this level breaks, look toward 3930–3940.
WTI Crude Oil (H4) – Trade Idea**🛢️ WTI Crude Oil (H4) – Trade Idea**
WTI is trading in a strong bullish structure after breaking out from the previous downtrend. Price has formed higher highs and higher lows while respecting the ascending trendline.
A short-term pullback toward the trendline is expected before buyers step back into the market. If price holds above the trendline and forms bullish confirmation, the uptrend is likely to continue.
**📈 Bullish Scenario**
* Wait for a retracement into the trendline support.
* Look for bullish price action before entering.
* Upside targets: **84.50 → 88.00 → 92.00+**
**⚠️ Invalidation**
* A strong H4 candle closing below the trendline would weaken the bullish setup and increase the probability of a deeper correction.
*Trade with proper risk management and wait for confirmation before entering.*
XAUUSD H4 – Bullish Breakout Outlook📊 XAUUSD H4 – Bullish Breakout Outlook
Gold is testing a major descending trendline after holding a strong demand zone. A confirmed breakout above this trendline could signal a shift in market structure and open the door for further upside.
🔹 Price is holding above a key demand zone.
🔹 Descending trendline resistance is under pressure.
🔹 A confirmed H4 breakout could trigger strong bullish momentum.
🔹 Wait for a breakout and retest confirmation before considering long positions.
Bias: Bullish above the descending trendline with confirmation.
Gold Analysis & Trading StrategyGold is currently trading in a weak sideways range with no momentum for a sharp bullish rally. The core driving factor weighing on gold prices remains Federal Reserve rate hike expectations. Gold generates no interest income, so the metal stays suppressed as long as US Treasury yields and the US dollar remain elevated.
The key resistance zone on the upside sits between 4040 and 4060; prices tend to stall and reverse lower whenever rebounding into this band. The short-term bearish bias will only ease if gold breaks and holds firmly above 4120.
The 4000 level is merely a psychological round number, where price action will repeatedly test back and forth. Major downside support lies at 3960–3980, a zone that consistently attracts buying interest on dips. A decisive break below 3940 would open further room to the downside for gold.
Trading Bias: Short on Rebounds
Entry: Short between 4030–4050
Target 1: 4000–3980; Target 2: 3960 if support breaks
Oil Above $80 — Is the Next Stop $90?After tensions between Iran and the United States escalated again in the Middle East, crude oil ( FX_IDC:USDBRO ) rallied from around $70 and has successfully established itself above $80. So far, oil has gained more than +20%, reflecting the market’s reaction to the renewed geopolitical tensions.
Since oil prices are highly sensitive to geopolitical developments, any news regarding an escalation or de-escalation of tensions can have an immediate impact on the market. Therefore, make sure to manage your risk carefully, especially when trading crude oil.
Crude oil now appears to have broken above the resistance zone($86-$82) and completed its pullback in the form of a Triangle Pattern. This could signal that oil is preparing for its next bullish move toward the next resistance zone($91.50-$89.50) and the important psychological level of $90.
From an Elliott Wave perspective, it appears that main wave 4 has been completed, and we can now expect the next impulsive move as main wave 5 begins.
I expect crude oil to continue its bullish trend and gain at least another 4–5%, potentially reaching the $90 area.
First Target: $88.87
Second Target: $90.20
Stop Loss(SL): $83(Worst)
Points may shift as the market evolves
Gap: $79.50-$77.22
What’s your view on crude oil? Do you think oil can move above $90, or should we expect another correction before that?
💡 Please respect each other's opinions and express agreement or disagreement politely.
📌U.S. Dollar/Brent Crude OIL Analysis (USDBRO), 4-hour time frame.
🛑 Always set a Stop Loss(SL) for every position you open.
✅ This is just my idea; I’d love to see your thoughts too!
🔥 If you find it helpful, please BOOST this post and share it with your friends.
BEARS GAINING MOMENTUM TO PUSH PRICE DOWN A sell at 4120-25 sl at 4135 ,
bears are likely going to push price lower to clear below 3940 to signal long term sells again so I think its not advisable to hold buy because market already confirmed a bearish week by last week price action and now bears are gaining strength.
Bearish forces dominate market sentiment and suppress pricesBearish forces dominate market sentiment and suppress prices
🌐1. The Fed's hawkish stance has solidified: Dallas Fed President Logan (a voting FOMC member this year) publicly stated that a single month of improved inflation data is insufficient to meet anti-inflation goals; she explicitly called for moderate rate hikes to ensure price stability, becoming the first policymaker to publicly support further hikes under Chair Warsh. Meanwhile, Fed Vice Chair Jefferson and Chair Warsh reiterated that the option for rate hikes remains on the table until the 2% inflation target is met, and a "higher-for-longer" interest rate path remains the baseline policy; consequently, the opportunity cost of holding non-yielding gold remains high.
💠2. Economic fundamentals offer no recession-driven case for rate cuts: High-frequency data on retail sales, employment, and manufacturing all demonstrate the resilience of the US economy, leaving no fundamental justification for the Fed to loosen policy due to a "hard landing" recession. CME interest rate tools show the probability of a 25-basis-point hike in September rising to 56.2%, with the cumulative probability of a hike before year-end approaching 75%; thus, a bullish rally lacks a long-term narrative to support it.
⛽3. Geopolitics and oil prices drive inflation, creating headwinds for gold: US-Iran tensions have crossed "red lines" regarding civilian targets, with US airstrikes hitting Iranian nuclear facilities and port infrastructure, and Iran attacking Kuwaiti power facilities. Commercial shipping traffic through the Strait of Hormuz has dropped to a three-week low, and crude oil prices surged nearly 16% in a single week. The market's transmission logic is fixed: crude oil spikes → energy-driven inflation rebounds → the Fed is forced to maintain tightening or even hike rates → safe-haven capital flows into the US dollar rather than gold. Geopolitical conflict no longer acts as a traditional bullish driver for gold; instead, it creates risks of future inflation that suppress upward price momentum.
Gold Is Rebounding, But The Real Test Lies Ahead | XAUUSD 20/07XAUUSD has recovered from the recent H1 demand zone after sweeping sell-side liquidity, allowing buyers to regain short-term momentum.
The problem?
Price is approaching a major decision area. While buyers have reclaimed the nearby 4,020–4,025 reaction zone, Gold still trades below the descending trendline and the 4,060–4,070 H1 Order Block—the key resistance that could determine whether this recovery continues or fails.
Until buyers can break and hold above these overhead barriers, the current move should be viewed as a bullish retracement rather than a confirmed trend reversal.
For now, buyers are building momentum.
But sellers still control the broader market structure.
Currently
• Price reacted strongly from the 3,960–3,970 demand zone
• Sell-side liquidity has been swept
• Buyers reclaimed the 4,020–4,025 H1 reaction zone
• Price remains below the descending trendline
• Major H1 Order Block sits at 4,060–4,070
• Higher-timeframe bearish structure remains intact
Trading Plan
Bias: Bullish Retracement Within a Bearish Structure
Main Zone
• 4,060–4,070 → H1 Order Block
Execution Idea
As long as price continues holding above the recent higher lows, buyers may extend the recovery toward the 4,060–4,070 H1 Order Block, where stronger selling pressure could emerge.
A successful H1 reclaim of both the Order Block and the descending trendline would strengthen the bullish outlook and expose higher liquidity.
However, if price is rejected from this resistance area, sellers could regain control and drive Gold back toward the 3,980 sell-side liquidity, keeping the broader bearish structure intact.
Targets
→ TP1: 4,030 → Internal Liquidity
→ TP2: 4,060 → H1 Order Block
→ TP3: 4,070 → Major H1 Resistance
Invalidation
A confirmed H1 close below 3,990 would invalidate the bullish retracement scenario and expose the 3,960–3,970 demand zone once again.
Key Insight
A recovery from demand is encouraging, but the trend has not changed. Buyers must reclaim the H1 Order Block and break the descending trendline before a larger bullish narrative can be considered.
Key Question
Is Gold building enough momentum to reclaim the H1 Order Block, or is this rebound simply creating better prices for sellers?
GOLD Will Go Lower From Resistance! Sell!
Please, check our technical outlook for GOLD.
Time Frame: 1h
Current Trend: Bearish
Sentiment: Overbought (based on 7-period RSI)
Forecast: Bearish
The market is testing a major horizontal structure 4,011.63.
Taking into consideration the structure & trend analysis, I believe that the market will reach 3,970.43 level soon.
P.S
Overbought describes a period of time where there has been a significant and consistent upward move in price over a period of time without much pullback.
Like and subscribe and comment my ideas if you enjoy them!
Continued accumulation - gold price below 4100GOLDEN INFORMATION:
Gold (XAU/USD) reverses a modest Asian session dip to the $3,983-$3,982 area and is now looking to build on Friday's bounce from the monthly low. The intraday uptick is sponsored by a softer US Dollar (USD), which tends to benefit the commodity. That said, rising geopolitical tensions and expectations of higher US interest rates favor the USD bulls, warranting caution before positioning for any meaningful appreciation for the non-yielding bullion.
⭐️Personal comments NOVA:
Gold prices remain in consolidation around 4000, with a potential downward trend below 4000.
⭐️SET UP GOLD PRICE
🔥SELL GOLD zone: 4071 - 4073 SL 4081
TP1: $4055
TP2: $4033
TP3: $4005
🔥BUY GOLD zone: 3962- 3960 SL 3952
TP1: $3977
TP2: $3992
TP3: $4022
⭐️Technical analysis: Based on technical indicators EMA 34, EMA89 and support resistance areas.
⭐️NOTE:
Note: Nova wishes traders to manage their capital well
- take the number of lots that match your capital
- Takeprofit equal to 4-6% of capital account
- Stoplose equal to 2-3% of capital account
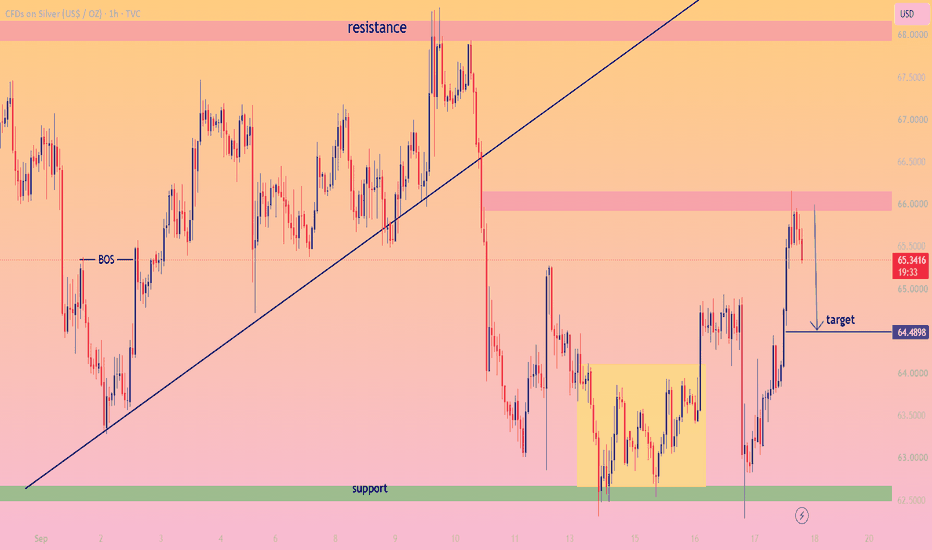
Silver Short IdeaSilver is testing a key pivot level as resistance. This area has been support and resistance multiple times. We have descending trend line resistance above as well. Technically, this calls for a short trade until the resistance breaks clearly.
Disclaimer: This is for education purpose only and not financial advice.
Weekly overview: XAUUSD, #SP500, #BRENT | 24 July 2026XAUUSD: SELL 4015.00, SL 4050.00, TP 3927.50
Gold begins the week near $4,015 per ounce, remaining under pressure as rising oil prices lead markets to reassess Federal Reserve interest rate expectations. Higher energy costs are increasing inflation risks, supporting US Treasury yields, and raising the opportunity cost of holding the metal.
Geopolitical tensions continue to sustain demand for defensive assets, but this has not yet offset the impact of the US dollar and expectations that interest rates will remain elevated for longer. If the oil price shock continues to support US yields, the fundamental scenario allows for a further decline in XAUUSD.
Trading idea: SELL 4015.00, SL 4050.00, TP 3927.50
#SP500: SELL 7505, SL 7555, TP 7380
The #SP500 enters the week following a decline in the technology sector, while higher oil prices are reviving concerns about inflation and borrowing costs. Rising US Treasury yields could place additional pressure on company valuations, particularly in sectors that are sensitive to financing costs.
Major corporate earnings could support the index if results confirm strong profit expectations. However, high market concentration and the correction in semiconductor stocks increase the risk of disappointment. If oil prices and US yields remain elevated, the baseline scenario continues to point lower.
Trading idea: SELL 7505, SL 7555, TP 7380
#BRENT: BUY 90.30, SL 87.80, TP 95.30
Brent begins the week above $90 per barrel following a sharp increase in risks to Middle Eastern oil supplies. Reduced shipping activity through the Strait of Hormuz and tensions surrounding Iranian ports are increasing the likelihood of disruptions, keeping the geopolitical risk premium as the market’s main driver.
The advance has already been substantial, increasing the risk of a correction if there are signs of de-escalation or a normalization of shipping activity. Nevertheless, restricted transit capacity and low inventories continue to provide fundamental support for oil. Until supply risks ease, the priority remains a cautious upside scenario for #BRENT.
Trading idea: BUY 90.30, SL 87.80, TP 95.30
Gold weekly trade analysis: 20–24 July 2026Gold is attempting a short-term recovery, but it remains inside a materially bearish higher-timeframe structure. The hourly and 15-minute charts show improving momentum and stabilising volume participation, while the four-hour chart remains below its 55 EMA, 200 EMA and daily 200 EMA. Four-hour OBV also remains below its 200-period EMA.
Understanding the Macro
Gold would ordinarily benefit from geopolitical escalation and defensive positioning. The current macro environment is more complicated because the dollar is absorbing part of the haven demand, while elevated oil prices can keep inflation expectations and real yields firm.
The attached macro report therefore does not support a simple “geopolitical risk equals higher gold” conclusion. Gold’s primary weekly drivers are likely to include:
US real yields and Treasury-market direction.
Dollar performance.
Oil-related inflation expectations.
Middle East escalation or de-escalation.
Friday’s global flash PMIs.
Technology-market volatility and broader demand for liquidity.
Gold’s strongest bullish environment would combine declining real yields, dollar weakness and escalating geopolitical risk. Higher real yields alongside a firm dollar would keep the larger bearish trend intact, even with geopolitical uncertainty.
Expectation
Entry zone: 4020 – 4024
Stop-loss: 4033
Take-profit 1: 4005
Take-profit 2: 3985
Take-profit 3: 3965
XAUUSD SELL SHORTXAUUSD SELL SHORT
- - XAUUSD / GOLD Bearish Market structure Shift on HTF , After Daily BPR Mitigate and Major BSL Liquidate then , on H4 TF When Market will reach out the H4 Mitigated SIBI , after H4 2nd SIBI Liquidate our entry on 1st SIBI , go to LTF ( H1 / M15 ) after Liquidity Sweep & See a Valid MSS Conformation Then Enter with Proper SL & Hold for a Long Target ( aprox 30 hndl SL n 150 hndl TP ) , Target SSL .
NOTE :- IN LTF after Valid Mss then Enter , Use For Sell Entry Use SIBI / BPR / AB / OB / PB / SPLZ
- Enjoy Floks ..........................................
..........................................................
..........................................................
..........................................................
Gold Key Breakout AreaGold is holding at an interesting technical level. It's currently on the $4,000 psychological level whilst holding below a long standing downtrend line.
With the current downtrend line and strong support level we could be looking at two possible scenarios:
- Bearish scenario: Price breaks lower confirming the descending triangle shape that is forming and opening the door for a larger move down.
- Bullish scenario: If $4,000 continues to hold, a break above the downtrend line and some nice resistance zones could indicate a larger move to the upside.
Fundamentally, geopolitical tensions are causing fundamental direction to be a bit more complicated. Rising tension should generally support safe haven assets moving higher but the increasing oil prices reviving concerns of rising inflation and interest rate expectations strengthening the USD and putting downwards pressure on gold.
Last weeks softer than expected US CPI was initially supportive of gold but it still seems to be grinding lower. Ideally a breakout would be confirmed with data providing a shift in expectations for US rates.
Gold Analysis & Trading Strategy | July 20-21🌐Hello traders! I’m Jack Blackwell, with 15 years of experience in analysis and trading in the futures and forex markets. Below are my technical analysis views based on the current XAUUSD (4H and 1H timeframes) chart structure.
✅ 4-Hour Trend Analysis
From the 4-hour timeframe, gold remains within a descending channel, with lower highs continuing to form, indicating that the medium-term bearish structure has not yet been broken.
The 4-hour Bollinger Band upper band is located at 4058.57, while the lower band is at 3962.58. The price is currently trading in the middle-to-lower section of the Bollinger Bands, suggesting limited upside potential and continued risk of a pullback. If gold fails to regain and stabilize above the 4010–4020 area, it is more likely to retest the support levels around 4000 and 3976.
✅ 1-Hour Trend Analysis
From the 1-hour timeframe, the current price is below the MA10 at 4012.47 and the MA20 at 4012.23, indicating that short-term rebound momentum has weakened significantly and the hourly structure has shifted back to a sideways-to-bearish bias.
The 1-hour Bollinger Band middle line is located at 4012.23, the upper band at 4029.36, and the lower band at 3995.09. The price is currently below the middle line and gradually approaching the lower band, showing that short-term selling pressure has gained some advantage. However, technical buying support may emerge around the 3995–4000 area.
🔴 Key Resistance Levels
● 4018–4029: 1-hour Bollinger Band upper resistance area
● 4040–4054: Descending trendline resistance area
● 4058–4064: 4-hour Bollinger Band upper resistance area
🟢 Key Support Levels
● 4000–3995: 1-hour Bollinger Band lower support area
● 3985–3976: Key support area
● 3963–3959: 4-hour Bollinger Band lower support area
● Around 3936: Important lower support area
✅ Trading Strategy Reference
🔰 Short Position Strategy
👉 Sell Zone 1: 4018–4028
👉 Sell Zone 2: 4040–4050
🎯 Targets: 4000 → 3985 → 3976 → 3962
🔰 Long Position Strategy
👉 Buy Zone 1: 4000–3995
👉 Buy Zone 2: 3985–3976
🎯 Targets: 4012 → 4025 → 4029 → 4040
⚠️ The hourly chart has already broken below the short-term ascending trendline. Therefore, long positions are better considered only after clear signs of stabilization appear within the support zones, rather than chasing the price higher from the middle of the range. If gold falls below 3995 and fails to recover quickly, it may continue declining toward 3976. If 3959 is also broken, the rebound structure will largely become invalid, and the price may continue falling toward 3936 or even 3912.
🔔 If you find my analysis helpful, please like, share, and stay tuned for future updates. Your support is my motivation to continue sharing professional insights. Wishing everyone smooth trading and steady profits!
GOLD’s Fundamental OutlookVANTAGE:XAUUSD Gold is still camping around the $4,000 mark, but I’m still not seeing enough from the bulls.
Right now, Gold isn’t calling the shots. The Dollar CAPITALCOM:DXY is.
The US and Iran situation keeps heating up, and every new headline puts the Strait of Hormuz right back in focus. Oil catches a bid, inflation worries come back, and suddenly the market starts talking about higher rates all over again.
That’s the problem for OANDA:XAUUSD Gold.
As long as traders believe inflation sticks around, the Fed has every reason to stay hawkish. Right now, the market is leaning toward at least two more rate hikes before year end, with September looking like a real possibility.
That keeps the Dollar in the driver’s seat.
Normally, this kind of geopolitical tension would have Gold ripping higher. But this time the market seems a lot more focused on higher yields and a stronger Dollar than chasing safe havens.
For me, the story hasn’t changed.
Unless something shifts with the Fed or the Dollar finally starts rolling over, I still think every pop is a selling opportunity. The $3,950 area is still very much on my radar. 📉
Gold Market Analysis July 20
📈 Gold Market Analysis July 20 | Can the Rebound Continue?
Dear traders, good day! ☀️
📌 Trade Review
Last Friday, we provided a live trading signal:
📍 Sell Gold at 4010-4015
Gold moved as expected and we closed the position near:
✅ 4005 for profit-taking.
Although the profit was limited, successful trading is not about chasing every move. The key is risk control and consistent returns.
Congratulations to all traders who followed the strategy! 🎯👏
Due to unexpected weekend risks, I do not recommend holding positions overnight. More opportunities are coming next week.
🌍 Gold Fundamental Analysis
The current gold market is mainly influenced by two factors:
1️⃣ Safe-Haven Demand Returns
The latest COT report shows:
📊 Gold net long positions increased by 4,294 contracts to 119,147 contracts.
Funds are returning to gold as uncertainty rises, showing renewed demand for gold’s safe-haven and monetary value.
However:
⚠️ Silver net long positions decreased by 1,755 contracts to 10,377 contracts.
This gold-silver divergence suggests investors are currently focusing more on:
✔ Gold’s safe-haven role
✔ Currency protection
✔ Risk hedging
while remaining cautious about silver’s industrial demand.
2️⃣ Interest Rates Still Pressure Gold
Gold remains supported by long-term factors, but short-term upside is limited by interest rate expectations.
Factors affecting gold:
💵 Strong US Dollar
📈 Higher real interest rates
🏦 Delayed Fed rate-cut expectations
These increase the holding cost of non-yielding gold.
Currently, gold is caught between:
📌 Long-term support from central bank buying and geopolitical risks
and
📌 Short-term pressure from monetary policy.
📅 Market Focus Next Week
July 20-24 will bring several important events:
🔥 US economic data
🔥 Inflation reports
🔥 Employment data
🔥 PMI indicators
🔥 ECB policy signals
Traders should focus on:
✔ Fed policy expectations
✔ Dollar movements
✔ Global risk sentiment
These factors may determine the next major direction for gold.
📊 Gold Technical Analysis
Weekly Chart
Gold remains in a weak structure.
Current conditions:
❌ Price below major moving averages
❌ Bearish weekly pattern
❌ Rebounds lack strong buying momentum
The current rise is considered a:
📌 Technical correction, not a confirmed trend reversal.
Key levels:
🔺 Resistance: 4150
🔻 Support: 3850
A break below 3940 could open further downside.
Daily Chart
Gold continues to face pressure from:
5-day MA
10-day MA
20-day MA
The short-term structure remains bearish.
Important resistance:
🔥 4040-4050
Only a strong breakout above this zone could improve the short-term outlook.
4H Chart
Gold is currently in a consolidation range.
Market condition:
📌 Buyers defend support
📌 Sellers pressure resistance
📌 No clear one-way trend yet
Technical signals:
✔ Moving averages flattening
✔ Bollinger Bands narrowing
✔ MACD showing mixed momentum
Key levels:
🔺 Resistance: 4040
🔻 Support: 3960
🔻 Strong support: 3940
A break below 3940 may accelerate the decline.
📌 Monday Trading Strategy
🔴 Short Setup
📍 Sell Gold near:
4040-4050
Stop Loss:
❌ Above 4070
Targets:
🎯 4010
🎯 3980
🎯 3960
🟢 Long Setup
📍 Buy Gold near:
3960-3970
Stop Loss:
❌ Below 3940
Targets:
🎯 4000
🎯 4020
🎯 4030
💡 Trading Outlook
Gold is currently in a:
Weak consolidation and technical recovery phase.
Avoid chasing rallies and avoid panic selling.
Watch closely:
✅ Can gold break above 4060?
✅ Can 3960 support hold?
✅ Will 3940 remain the key defense level?
Trade with confirmation, manage risk carefully, and wait patiently for high-probability opportunities.
The market never lacks opportunities — discipline and patience create long-term success.
📈 Wishing everyone successful trading!
Share your gold market views in the comments. Let’s explore opportunities together! 🤝🔥