GOLD Price Update – Clean & Clear ExplanationGold is currently trading around 4,334, showing a short-term recovery from the lower support area. Price is approaching a key supply/resistance zone around 4,360–4,380, which is marked as the decisive level between bullish and bearish momentum.
Technically price moves higher into the 4,360–4,380 resistance zone but fails to break and hold above it, a strong bearish rejection could develop. From that area, the downside structure points toward TP1 at 4,300, followed by TP2 around 4,280, with an extended move toward TP3 near 4,260.
The 4,380 level is critical: a clear breakout and sustained hold above it would weaken the bearish setup and indicate that buyers are gaining stronger control. Until that happens, rejection from the upper supply zone keeps the downside projection active.
Overall structure: Watch the reaction around 4,360–4,380 for confirmation. A rejection from this zone can open the path toward the marked downside targets.
your support means a lot! If you found this analysis useful, leave a Like and tell me your thoughts in the comments. Best of luck with your trading journey! 🚀  Short
Short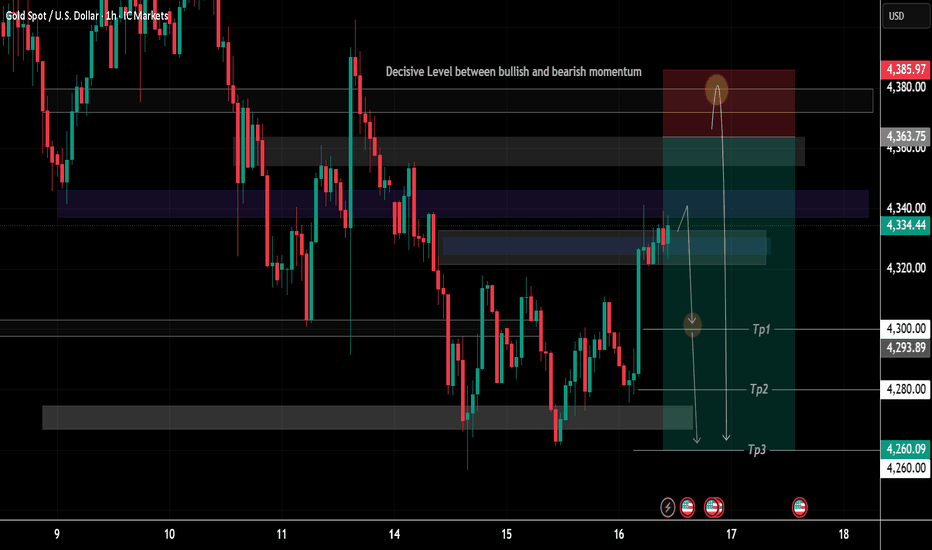
XAUUSD 1H Breakout and Pullback StrategyHello traders,
Gold is currently trading in a range. I have two clear scenarios based on breakout and pullback. I will only enter after confirmation.
Key Levels
Resistance 1: 4,366.90
Resistance 2: 4,498.80
Support 1: 4,234.59
Support 2: 4,101.91
Scenario 1 Bullish Breakout
If price breaks above 4,366.90 with a confirmed close, wait for a pullback to retest it as support. After bullish confirmation, enter long.
Entry: On pullback to 4,366.90 after confirmation
Stop Loss: Below 4,300
Target 1: 4,420
Target 2: 4,498.80
Invalidation: Price closes back below 4,366.90
Scenario 2 Bearish Breakdown
If price breaks below 4,234.59 with a confirmed close, wait for a pullback to retest it as resistance. After bearish confirmation, enter short.
Entry: On pullback to 4,234.59 after confirmation
Stop Loss: Above 4,280
Target 1: 4,150
Target 2: 4,101.91
Invalidation: Price closes back above 4,234.59
Pro Tips
1 Do not chase the breakout. Always wait for the pullback.
2 The pullback gives a better entry with lower risk.
3 Confirm the retest with price action on lower timeframes.
4 Patience is key.
My Personal View
Above 4,366.90 with a pullback equals long to 4,498.80. Below 4,234.59 with a pullback equals short to 4,101.91. I will wait for the market to show its hand first.
Not financial advice. Trade at your own risk.
Tags XAUUSD Gold Breakout Pullback SupportAndResistance PriceAction TradingView
Short 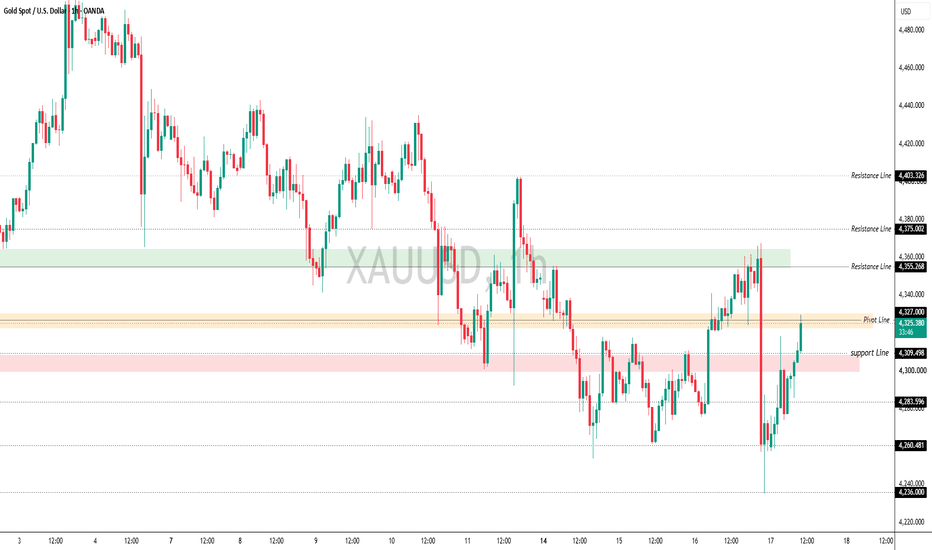
 Short
Short
Long 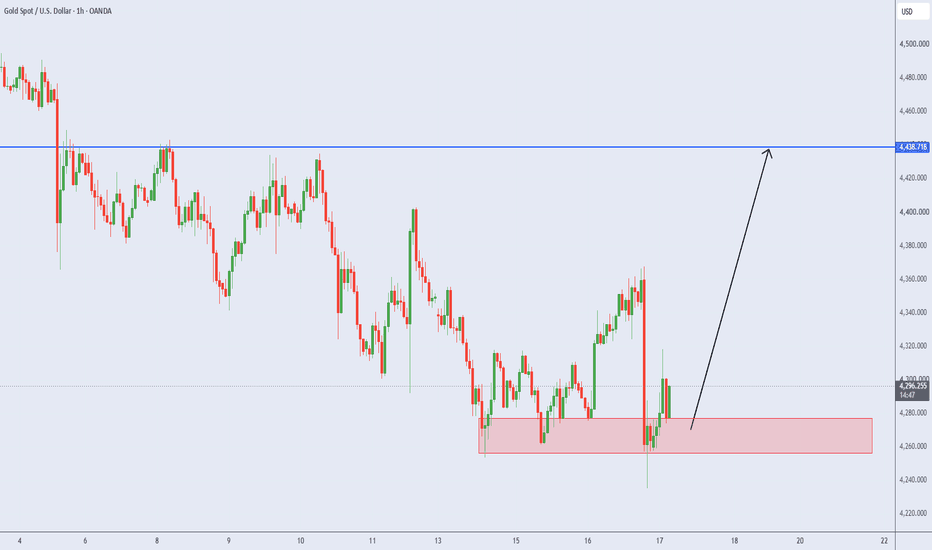
GOLD - A countertrend correction ahead of the news ICMARKETS:XAUUSD is bouncing from support ahead of the news and forming a countertrend correction amid the dollar’s stagnation following a five-day rally. The FOMC meeting and comments from the regulator are ahead...
Technically, most of the hawkish risks have already been priced in, but gold will remain vulnerable if the Fed signals that it intends to keep rates elevated for an extended period. Geopolitical risks and high energy prices are providing support. Gold is caught between expectations of tighter monetary policy and safe-haven demand.
Technically, the market is moving toward a liquidity zone, which could be tested before another decline within the local trend
Drivers:
Downside: hawkish Fed, strong dollar, rising yields.
Upside: dovish Fed, weak dollar, geopolitical support
Resistance levels: 4,355, 4,402
Support levels: 4,250, 4,230, 4,200
Gold, having failed to reach the key levels at 4,230–4,200, is forming a countertrend correction ahead of the upcoming news — the interest rate decision. A short squeeze of the 4,355–4,400 resistance zone could trigger a decline toward the key areas of interest
Best regards,
R. Linda! Short 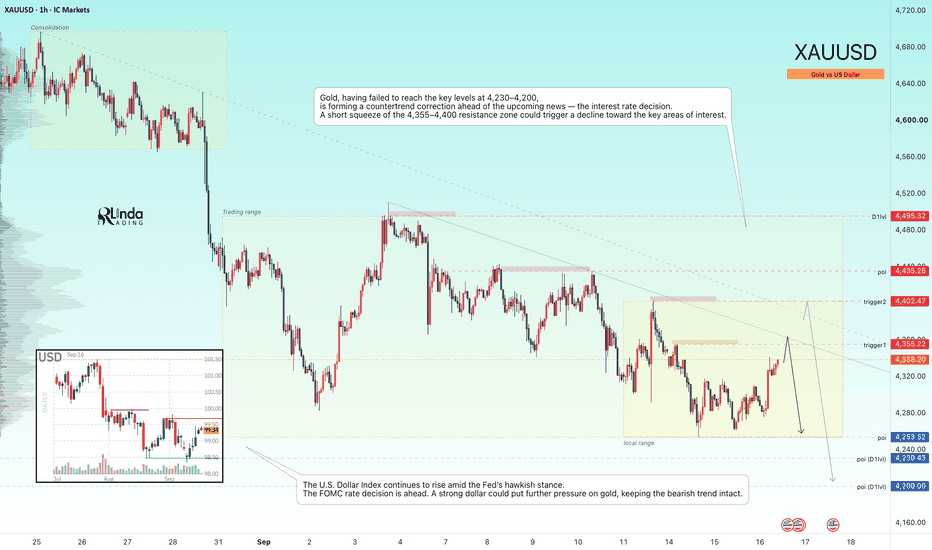
XAUUSD: Corrective Rally Toward Bearish Order Block ExpectedDescription:
Gold is currently trading within a clear bearish market structure following a series of Breaks of Structure (BOS) to the downside.
Market Structure Overview Multiple confirmed BOS have established a strong short-term bearish bias.
External liquidity to the downside has already been partially addressed.
Price is now approaching a decision zone.
Key Technical Levels
Bearish Order Block: 4,380 – 4,400
This is the last bullish candle before the most recent impulsive sell-off. It represents a high-probability supply zone where institutional selling interest may re-emerge.
Near-term Support: 4,260 – 4,280
Price has shown some reaction here, suggesting a possible corrective bounce.
Projected Scenario
The most probable path is a corrective upside move toward the Bearish Order Block (4,380–4,400). A clean rejection from this zone would open the door for continuation lower, potentially targeting the external liquidity below.
Educational Trade Frame work Bias: Short-term corrective bounce → then bearish
Sell Zone: 4,380 – 4,400 (Bearish OB)
Invalidation: Daily close above 4,410
Downside Targets: 4,260 / 4,220
This setup reflects classic Smart Money behavior: liquidity is taken, a corrective move occurs into a higher-timeframe supply zone, and then the original trend resumes.
This analysis is strictly for educational purposes. It does not constitute financial advice.
Always apply proper risk management.
Short 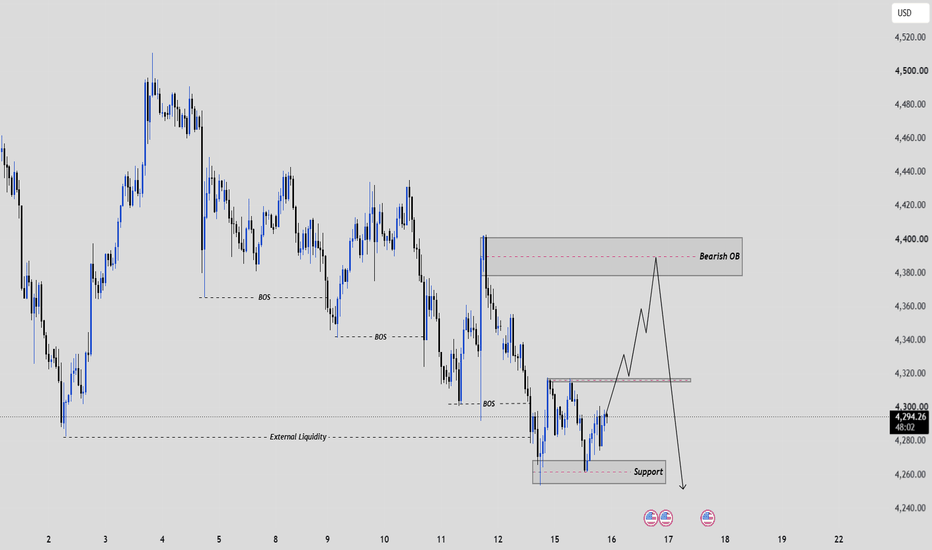
Long 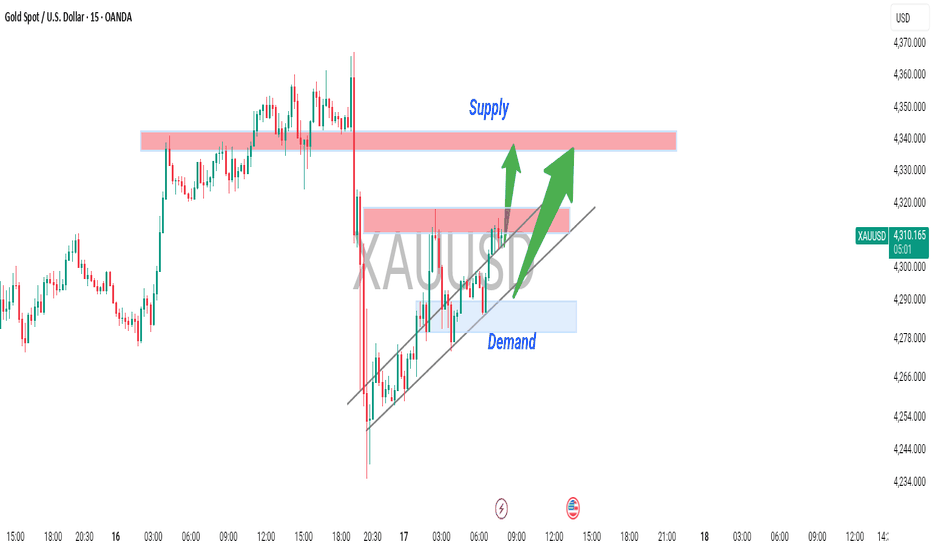
H1 Descending Channel: 4,365 Trap Before 4,215?
Macro Backdrop: Post-FOMC Repositioning Meets Persistent Dollar Dominance
Gold (XAUUSD) trades near 4,296.050 (+0.44% floating) on Thursday, September 17, 2026. Following the Federal Open Market Committee (FOMC) rate verdict and policy projections yesterday, bullion experienced sharp volatility, printing an aggressive short squeeze up to the 4,367 boundary before encountering institutional supply. With the US Dollar Index (DXY) maintaining structural strength and benchmark Treasury yields holding elevated, non-yielding precious metals continue to face overhead macro resistance. While sovereign fiscal debt sustainability concerns and central bank reserve diversification offer a long-term safety floor, short-term order flow remains anchored to a dominant higher-timeframe distribution channel. Smart Money is utilizing this post-FOMC bounce to engineer buy-side inducement before executing an aggressive liquidation flush into deep discount liquidity pools.
📉 Technical Analysis: Descending Channel Structure, Bearish Order Flow & SMC Blueprint
The updated H1 structural blueprint reveals a textbook Smart Money Concepts (SMC) channel markdown and mitigation cycle:
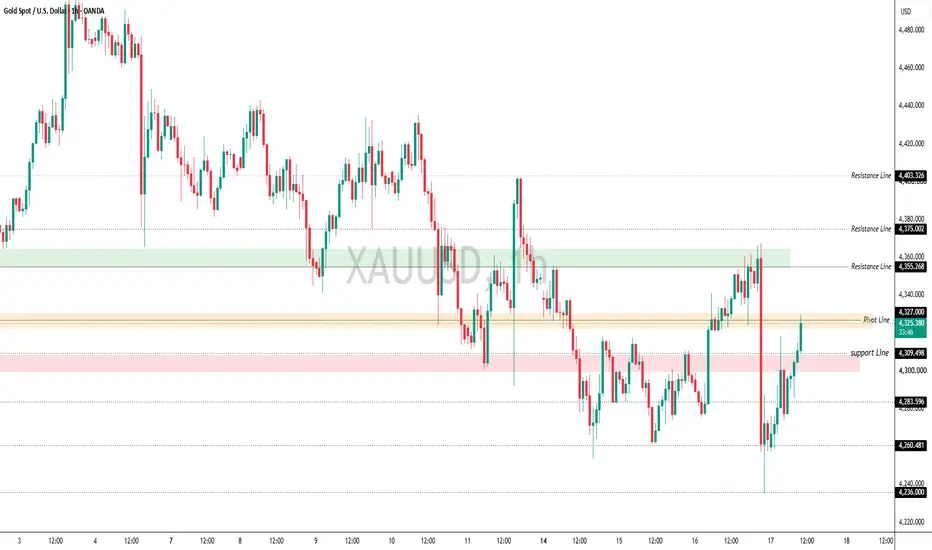
1. Structural Downtrend & Trend Indicator: The H1 Trend Indicator remains firmly Negative (Upper Range: 4,367.415 | Mid Pivot: 4,301.290 | Lower Range: 4,235.165). Price continues to carve out consecutive Lower Highs (LH) and Lower Lows (LL) along a massive Descending Channel (shaded corridor).
2. Premium Supply Box Rejection (4,350.00 — 4,367.00 Corridor): Price recently completed an impulsive relief squeeze that tapped the channel upper ceiling and the unmitigated Premium Supply Zone (LH pivot at 4,367.41). A heavy bearish displacement candle closed immediately back below the 4,301.290 Mid Pivot, confirming that institutional sellers are defending the ceiling.
3. Current Price Action & Support Shelf (4,270.00 — 4,285.00 Area): Price is currently hovering around 4,296, reacting to the recent internal swing low.
4. The Projected Zigzag Roadmap:
- Primary Rebound / Inducement Leg: A corrective relief bounce from current levels back toward the 4,330 — 4,350 area to trap premature breakout buyers (Inducement).
- The Institutional Flush: Once the secondary LH is printed, Smart Money is mapped to unleash a heavy liquidation flush slicing through the 4,260 — 4,240 base.
- Final Destination: An extended expansion drive down to the unmitigated HTF Discount Demand Floor at 4,210.00 — 4,225.00.
5. Macro Target Floor (4,210.00 — 4,225.00 Corridor): The ultimate destination of this liquidation phase. Resting at the channel base, this major Sell-Side Liquidity (SSL) pool is engineered to clear trailing retail stops before any significant macro accumulation can unfold.
🔄 IF–THEN Playbook (Execution Scenarios):
• IF price completes the relief bounce into the 4,330 — 4,350 zone and prints a clean lower-timeframe failure (M5/M15 CHoCH Reversal) -> THEN execute high-probability short positions targeting 4,280, 4,240, and the 4,215 Macro Demand Floor.
• IF price breaks directly below 4,270 without completing the pullback -> THEN enter continuation shorts on a retest of 4,285 targeting the 4,215 floor.
• IF an H1 candle closes decisively above 4,375.000 on heavy volume -> THEN invalidate the bearish channel markdown thesis and step aside for structural reassessment.
• IF price sweeps the 4,210.00 — 4,225.00 Demand Floor and prints strong bullish absorption wicks -> THEN prepare to cover shorts and scout high-conviction swing longs.
🎯 Strategic Metrics Summary:
• Current Market Price: 4,296.050 (+0.44%)
• Structural Trend Indicator: Negative (Upper: 4,367.41 | Mid: 4,301.29 | Lower: 4,235.165)
• Premium Supply Rejection Zone: 4,350.00 — 4,367.00
• Inducement Pullback Target: 4,330.00 — 4,350.00
• Intermediate Support Floor: 4,260.00 — 4,280.00
• Ultimate Macro Demand Target: 4,210.000 — 4,225.000 (
• Structural Invalidation Level: Decisive H1 close above 4,375.00
Are you looking to short the 4,335–4,350 relief bounce, or do you expect buyers to break above the 4,367 channel ceiling? Short 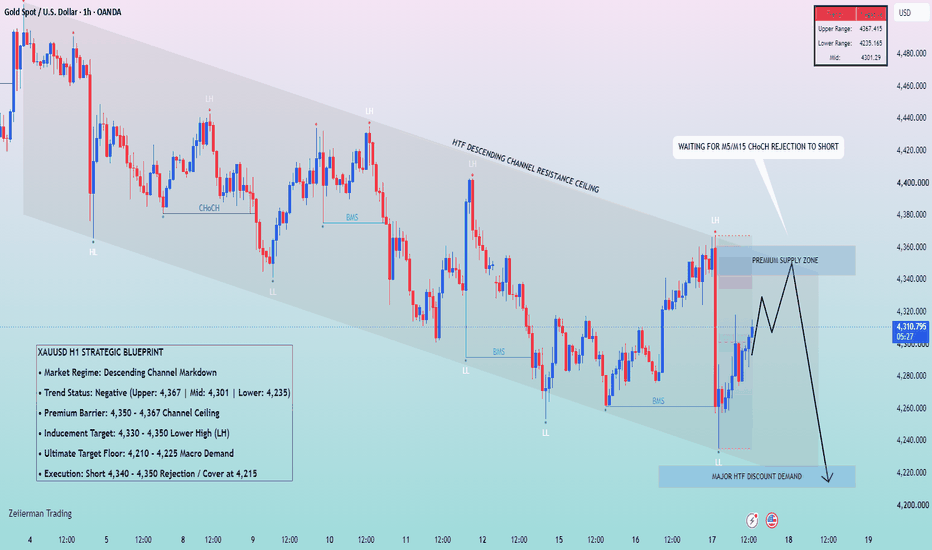
Long 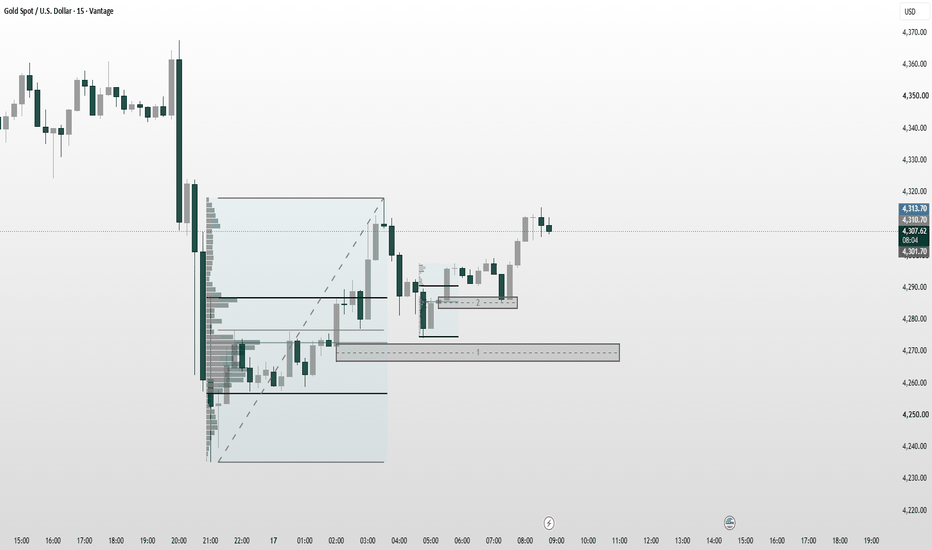
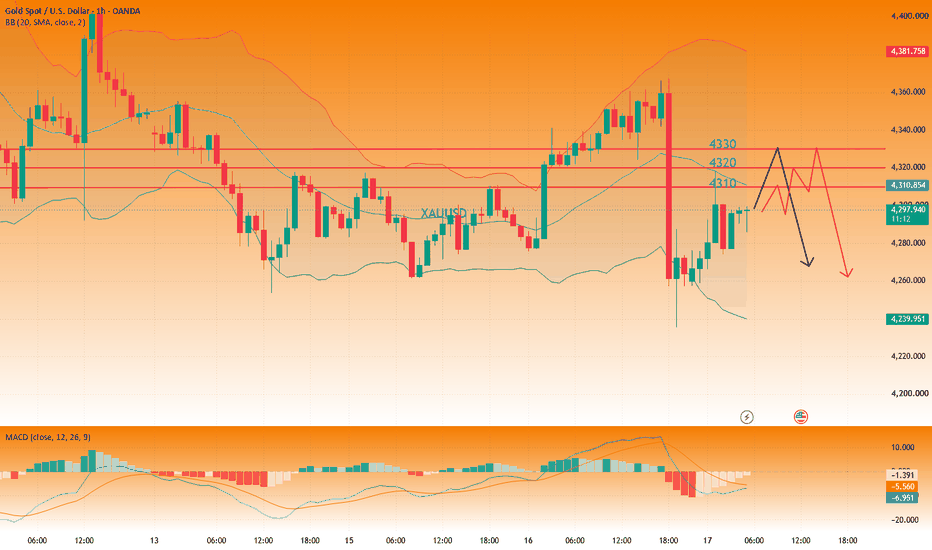
GOLD: Gold H1 Analysis – September 17📰 Gold News & Market Developments
Following the Fed's decision, the USD and US bond yields remain elevated, exerting pressure on Gold. XAUUSD experienced a sharp decline and is currently recovering from the 4,260 level.
On the H1 timeframe, the current recovery is insufficient to confirm a reversal. Prices remain below key EMA lines.
=> Short-term fundamentals: Bearish bias for Gold.
📊 Analysis
The H1 structure still shows Lower Highs and Lower Lows, with the EMA alignment EMA20 < EMA50 < EMA100 < EMA200 → the downtrend remains dominant.
The rise from 4,260 to above 4,280 may simply be a technical rebound. Therefore, rather than selling at the current price, it is advisable to wait for Gold to rally toward a resistance zone for a better entry position.
If the price breaks strongly above 4,325 and holds there, exercise caution with Sell orders and watch for a potential move toward the 4,350–4,365 zone.
🎯 Trading Strategy
🔴 Sell Zone 4,315–4,325 : The EMA20, EMA50, and EMA100 converge here. If the price rallies but faces rejection, sellers may step back in.
🔴 Sell Zone 4,357–4,370 : EMA200 + downtrend line + supply zone → a strong resistance area.
🟢 Buy Zone 4,255–4,265 : Key support zone. Only consider buying if a clear reversal signal appears.
=> Key strategy: Patiently wait for Gold to rebound to the resistance zone to look for selling opportunities, rather than chasing the trade at the current price. Short 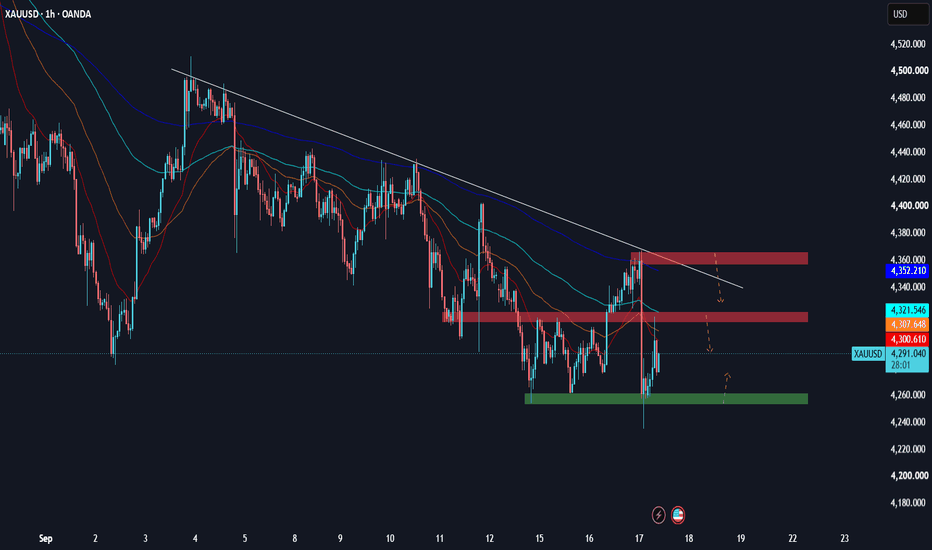
Larry Williams' Variable Accumulation: A Conceptual Study● 📊 The Conceptual Origin
- The concept at the heart of this discussion belongs to a family of tools developed to answer a single persistent question in market analysis: does the volume transacted during a given period confirm or contradict the price movement that accompanied it. Larry Williams, working in the tradition of accumulation and distribution theory pioneered by earlier chartists, proposed a refinement that moved beyond the simple close-to-close volume attribution used in classical accumulation and distribution lines. His insight was that not all volume within a bar carries equal informational weight, and that the true measure of buying or selling pressure must account for the position of the close relative to the entire range traversed during that period, scaled against the magnitude of that range itself.
- This is fundamentally a variable-weighting philosophy. Rather than treating every unit of volume as an equal vote for accumulation or distribution, the underlying logic assigns a proportional weight based on where the close settled within the high-low range, and then further normalizes that proportion against the range's own size relative to its recent history. The economic rationale is that a narrow-range day with a close pinned at the extreme reflects concentrated conviction, whereas a wide-range day with a close near the midpoint reflects contested, indecisive participation, even if both days transacted identical volume.
- Historically, this approach emerged from a broader academic and practitioner effort during the late twentieth century to quantify what had previously been a purely visual and intuitive judgment: the sense that "volume confirms price." By formalizing this intuition into a repeatable mathematical construct, the concept became transferable, testable, and combinable with other analytical frameworks, which is precisely why variants of this logic persist across multiple generations of technical analysis literature.
● 📈 Narrative Technical Analysis
- Mechanically, the logic operates on three interdependent inputs drawn from each price bar: the closing price, the true high and low of that bar's range, and the volume transacted. The distance between the close and the midpoint of the range is measured, then divided by the total range itself, producing a normalized ratio that oscillates between negative and positive extremes depending on whether the close favored the upper or lower portion of the bar. This ratio is then multiplied by the period's volume, converting a purely positional measurement into a volume-weighted pressure reading.
- When this pressure reading is summed cumulatively across a rolling window, the resulting series behaves as a structural regression milestone of sorts, a running ledger of net buying or selling conviction that traders can compare against price action to detect divergence. If price advances to new highs while this cumulative pressure fails to make a corresponding new high, the narrative technical interpretation is that the rally is being carried on thinning conviction, a classic bearish divergence signature. The inverse configuration, where price makes new lows while the pressure ledger refuses to confirm, suggests exhaustion among sellers.
- Consolidation box mapping becomes particularly relevant here, because during range-bound conditions the cumulative pressure line tends to oscillate within a horizontal band that mirrors the price consolidation itself. A breakout from that pressure band, occurring in advance of or simultaneously with a breakout in price, is often read as an early confirmation signal, since it implies that the underlying accumulation or distribution activity is beginning to resolve before the price chart makes the move obvious to a purely visual observer.
- Volume profile anomalies add another dimension to this narrative. When a disproportionately large volume spike occurs on a bar whose close sits near the range's midpoint rather than its extreme, the resulting pressure contribution is muted despite the raw volume being exceptional. This creates a subtle but important distinction from tools that weight volume uniformly: a volume spike is not automatically read as directional conviction unless the closing behavior corroborates it, which academically aligns the concept closer to an efficient-market interpretation of information absorption than to a naive volume-follows-price assumption.
● 🏛️ Institutional vs. Retail Perspective
- Institutional participants, who transact in sizes large enough to move markets across multiple sessions, tend to interpret this class of pressure measurement as a proxy for order-flow absorption. Because institutional execution is typically distributed across time to minimize market impact, a sustained divergence between cumulative pressure and price is often read by desks and quantitative research teams as evidence of a large participant working an order in the opposite direction of the visible trend, quietly absorbing supply or distributing inventory without immediately revealing intent through price alone.
- Retail participants, by contrast, generally encounter this concept as a confirmation overlay rather than as a standalone order-flow proxy. Lacking access to genuine order-book depth or block-trade reporting, the retail trader treats the cumulative pressure reading as a secondary filter: a way of asking whether the breakout, pullback, or reversal visible on the price chart is being accompanied by proportionate conviction, or whether it looks thin and therefore suspect. This creates a meaningful asymmetry in how the same mathematical construct is actually deployed across market participants.
- A further distinction lies in time horizon. Institutional desks studying accumulation and distribution behavior often do so across weeks or months, correlating the metric with known reporting cycles, index rebalancing dates, or macro event calendars. Retail usage, driven by shorter holding periods and intraday decision cycles, tends to compress the same logic into much shorter lookback windows, which changes the statistical reliability of the readings considerably, since shorter windows are inherently noisier and more susceptible to a handful of anomalous bars skewing the cumulative sum.
- There is also a philosophical divergence in how each group treats disagreement between pressure and price. Institutional research desks are more inclined to treat such divergence as a probabilistic signal to be weighted alongside dozens of other factors in a broader model, whereas retail traders are more prone to treat a single divergence reading as a binary trade trigger, a difference in epistemic humility that has significant consequences for risk management downstream.
● ⚙️ Strategic Variance
- In a trending market regime, this class of volume-weighted pressure measurement tends to move in reasonably close alignment with price, since sustained directional moves are usually accompanied by consistent closing behavior near the favorable extreme of each bar's range. In such conditions the metric functions primarily as a confirmation tool, reinforcing conviction in the prevailing trend rather than generating novel signals, and traders who rely heavily on divergence detection in this regime often find fewer actionable discrepancies simply because the underlying conviction genuinely is present.
- In a ranging or sideways regime, the behavior changes substantially. Because closes oscillate between the upper and lower boundaries of a horizontal channel without net progress, the cumulative pressure series tends to flatten or oscillate within its own horizontal band, mirroring the price structure. This is precisely the environment in which the consolidation box mapping described earlier becomes most valuable, since early resolution of the pressure band ahead of a price breakout can offer a meaningful edge, though this same environment also produces the highest incidence of false signals, since minor volume fluctuations during low-conviction ranging conditions can produce erratic short-term swings in the cumulative reading.
- High-volatility regimes introduce a distinct set of challenges. Wide-range bars with volume spikes can produce outsized single-bar contributions to the cumulative pressure sum, occasionally distorting the broader trend of the metric for several subsequent periods until the rolling window normalizes the anomaly. Traders operating in these conditions must therefore exercise particular caution when interpreting sudden shifts in the pressure reading, since a single climactic bar, whether representing genuine capitulation or a transient liquidity event, can masquerade as a structural shift in accumulation or distribution behavior when it may in fact be an isolated occurrence with limited persistence.
- Academically, this regime-dependent behavior underscores a broader point about volume-weighted pressure constructs in general: they are not regime-agnostic tools, and their statistical reliability, false-positive rate, and interpretive value shift meaningfully depending on the volatility and directional character of the underlying market, a consideration too often glossed over in simplified treatments of the concept.
● 🧠 Psychological Architecture
- The appeal of a volume-weighted pressure construct lies partly in its promise of objectivity, an attempt to replace the subjective visual judgment of "does this move look convincing" with a repeatable numerical output. Yet this very promise introduces its own psychological trap, because traders can develop an unwarranted confidence in a single derived metric simply because it is expressed numerically, mistaking mathematical precision for predictive certainty. The metric measures historical conviction; it does not forecast future conviction, and conflating the two is among the most common cognitive errors traders commit when working with any accumulation-distribution style construct.
- Confirmation bias plays an outsized role in how divergence signals from this type of metric are actually used in practice. A trader already inclined toward a bullish thesis will scan the pressure reading selectively for confirming divergence and discount contradicting readings as noise, while a trader inclined bearish will do the reverse. This selective attention undermines the entire analytical value of the tool, because the metric was designed to challenge existing assumptions, not to be filtered through them after the fact.
- Loss aversion further complicates the psychological relationship traders have with divergence-based signals. Because a pressure and price divergence often precedes a reversal by an uncertain and sometimes lengthy interval, traders who position early based on the divergence frequently experience a stretch of unrealized drawdown before, if ever, being proven correct. The discomfort of that interim drawdown is felt far more acutely than the eventual satisfaction of a correct call, which tempts many traders to exit prematurely at the point of maximum psychological discomfort rather than at a point dictated by the original analytical thesis.
- There is also a subtler cognitive hazard rooted in the illusion of granularity. Because the underlying calculation processes every single bar, traders can develop a false sense of precision, believing that because the metric updates continuously it must also be continuously actionable. In reality, the statistical noise embedded in bar-by-bar volume and range data means that only sustained, multi-bar patterns in the cumulative reading carry meaningful signal, while single-bar fluctuations are largely indistinguishable from randomness, a distinction that requires considerable discipline to internalize and respect under live market conditions.
● 🎲 Risk & Probability Sagas
- Any accumulation-distribution style construct, however elegantly derived, remains fundamentally a descriptive statistic about historical order flow rather than a probabilistic forecast of future price behavior, and conflating description with prediction is the single greatest risk-management error associated with this entire category of analysis. The mathematics of the underlying calculation guarantees nothing about forward returns; it merely summarizes what has already occurred in the relationship between price positioning and volume.
- From a probabilistic standpoint, divergence signals derived from volume-weighted pressure measurements should be understood as shifting the odds of a particular outcome rather than determining it outright. A divergence that has historically preceded reversals in a given percentage of observed instances still carries a complementary percentage of instances in which no reversal occurred, or in which the reversal was of insufficient magnitude to be tradeable after accounting for transaction costs and slippage. Treating any single divergence occurrence as a near-certain outcome rather than a probabilistically favorable but far from guaranteed condition is a fundamental misapplication of the statistical nature of the underlying data.
- The philosophy of position sizing under this kind of probabilistic uncertainty deserves particular emphasis. Because the reliability of any accumulation-distribution divergence varies considerably across market regimes, asset classes, and time horizons, as discussed extensively above, a rigid, uniform approach to position sizing irrespective of regime context is itself a source of unmanaged risk. Sound risk philosophy demands that conviction expressed through position size be proportional not merely to the presence of a signal, but to the historical reliability of that signal type within the specific regime currently prevailing, an asymmetry that many traders fail to account for.
- Ultimately, the mathematical philosophy underlying this entire category of volume-weighted pressure analysis rests on a probabilistic worldview: markets are not deterministic systems awaiting decoding by a sufficiently clever formula, but stochastic processes in which certain structural relationships, such as the one between closing position within a range and transacted volume, exhibit statistically meaningful but imperfect tendencies. Respecting that imperfection, rather than seeking false certainty from it, is the mark of a mature analytical approach to this category of technical construct.
● ⚠️ Risk Disclaimer
- The concepts discussed in this article are presented for educational and academic purposes only and do not constitute financial, investment, or trading advice of any kind. Technical analysis constructs, including volume-weighted accumulation and distribution frameworks, describe historical relationships between price and volume and carry no guarantee of predictive reliability in future market conditions. Trading and investing in financial markets involves substantial risk, including the potential loss of principal, and past performance or historical statistical tendencies are in no way indicative of future results. Readers should conduct independent research, consider their own risk tolerance and financial circumstances, and consult a qualified financial professional before making any trading or investment decision. Education 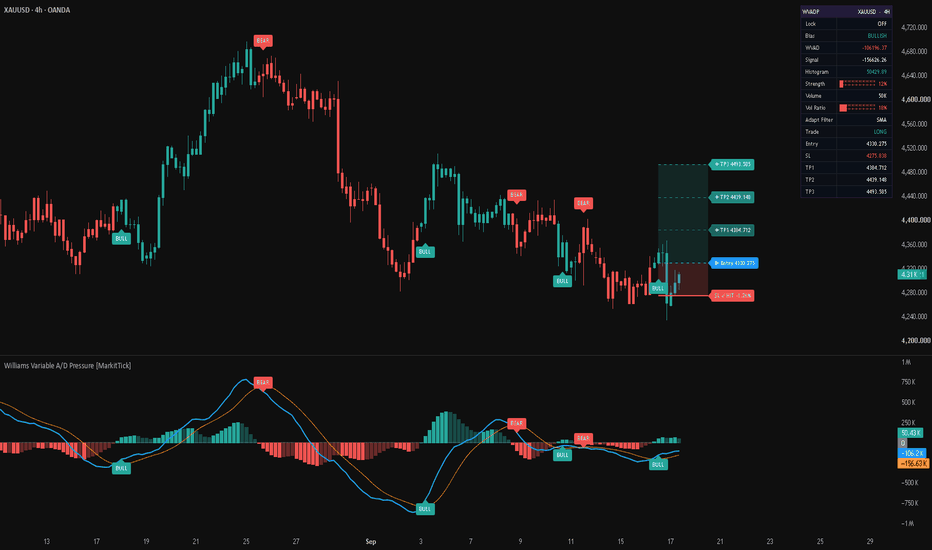
Short 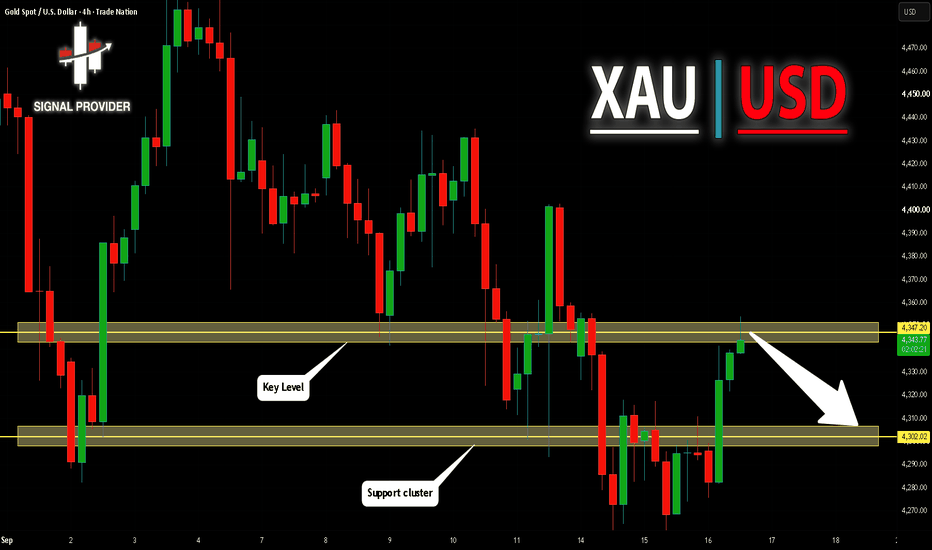
XAUUSD Breakout Imminent: How I’m Trading This Gold RangeXAUUSD 🌍
The macro narrative heading into this trading window is heavily dictated by central bank monetary policy updates and elevated Treasury yields, keeping the broader dollar dynamics volatile while fundamental backdrop drivers continue to test precious metals 🏦. Interestingly, general online sentiment is heavily leaning bearish following recent pullbacks, with retail consensus aggressively positioning for a deeper sell-off; this crowded environment suggests a prime opportunity for a liquidity sweep to trap early retail direction before the true market drive develops 🧹.
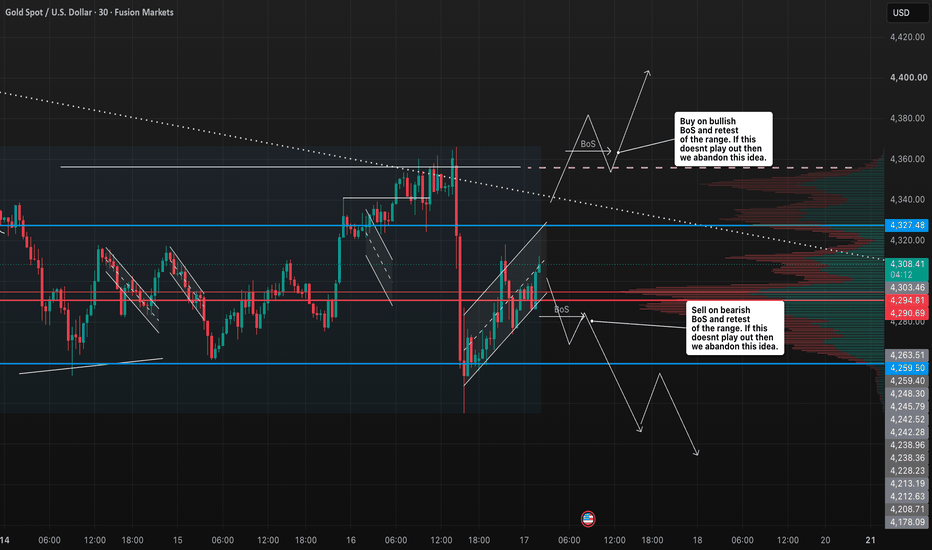
We are witnessing a compression phase on the intraday chart where price is coiling within an ascending parallel channel and respecting clear horizontal range boundaries 📈. While retail consensus is actively trying to pick tops and bottoms based on short-term noise, our structural footprint shows clear Wyckoffian balance before potential markup or markdown, indicating that breakout traders will likely be caught off-guard on the initial probe 📉.
Key Zone: The visible volume profile reveals a dense Point of Control (POC) oscillating near $4,295 to $4,303, flanked by Value Area High (VAH) resistance around $4,327 and Value Area Low (VAL) support near $4,259 📉. The current VWAP positioning reinforces this tight value equilibrium, confirming that institutional players are storing energy inside this high-volume node rather than driving value directional discovery just yet.
Looking at the broader weekly context, price action is hovering right in the middle of our balanced range 💰. I am actively watching for a clear "run on liquidity" above the prior highs near $4,360 or below the lower channel boundary near $4,280 to sweep the impatient stop-losses placed by late retail traders across various social forums before initiating our execution protocol.
My Trade Plan 🎯
Bias: Neutral until structural confirmation. Patience is paramount while price remains bound within value.
Entry Protocol:
Bullish Scenario: A clean Break of Structure (BoS) above $4,360 followed by a retest of the upper range/VWAP value zone for a long targeting $4,410+.
Bearish Scenario: A decisive Break of Structure (BoS) below $4,280 followed by a retest of the breakdown level/VWAP node for a short targeting $4,228–$4,208.
Short 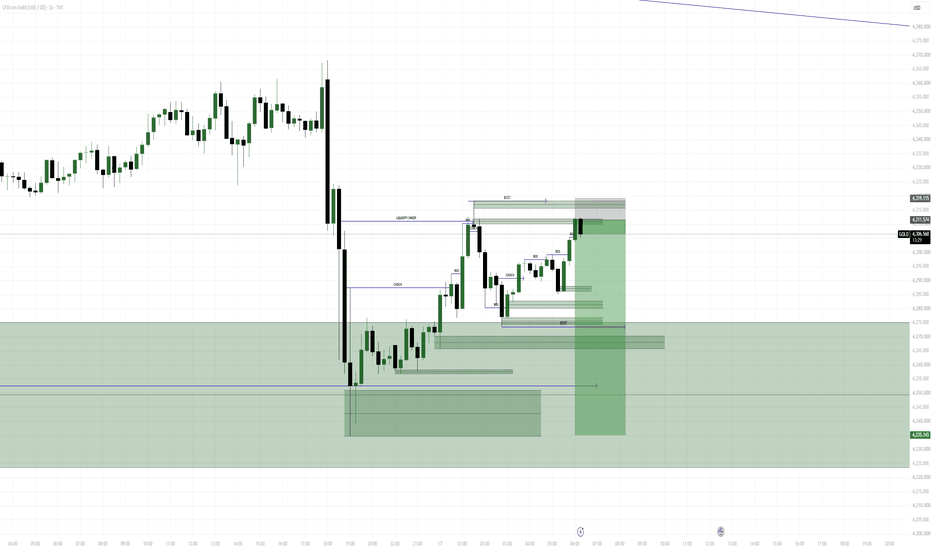
Short 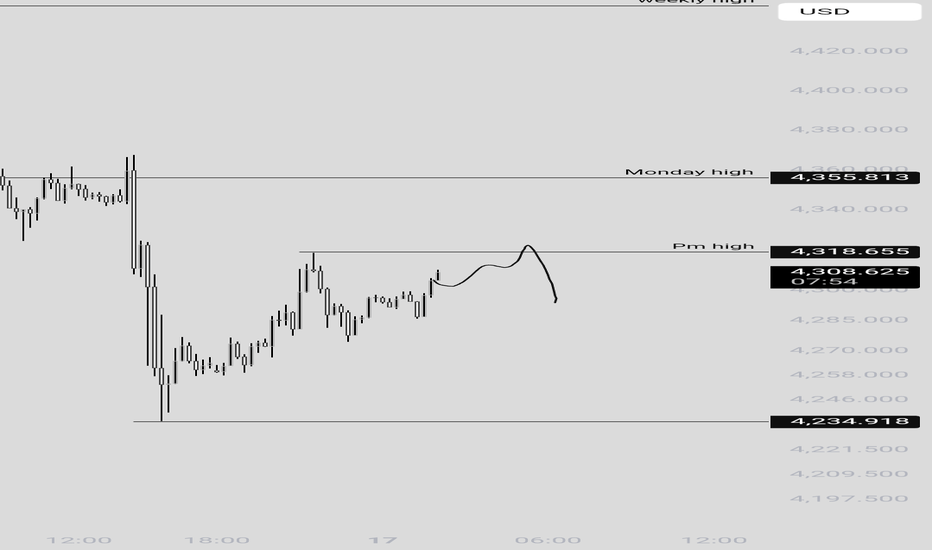
 Long
Long
Short 
 Long
Long
Short