XAUUSD Weekly Outlook — Breakout Needs a Retest
Gold is sitting around 4,378 after breaking the H4 descending trendline.
The structure is improving, but price is now testing the 4,385–4,405 immediate resistance area.
The simple read
A pullback toward 4,290–4,320 would be the cleaner test for buyers.
If this zone holds, Gold may recover toward 4,400 first, followed by the major 4,485–4,510 resistance.
A clean break above 4,510 could later expose the H4 resistance around 4,630.
If 4,290 fails, the major swing support near 4,235 becomes important again.
Key price zones
4,385–4,405 — immediate resistance
4,290–4,320 — key pullback support
4,235 — major swing low
4,485–4,510 — major resistance
4,630 — H4 resistance
The trendline break is encouraging, but I prefer a retest before continuation.
Do not chase the breakout.
Wait for the zone.
Can buyers defend 4,30x and open the path toward 4,500?  Long
Long
Gold Consolidated Facing Downside Pressure Near major Resistanceold is currently showing a recovery into a major resistance area around 4,400 / 4,420, but the upside move is losing momentum. On the chart, price has repeatedly reacted from this upper zone, suggesting that sellers are still defending the area.
The recent downside pressure is also linked to the Federal Reserve’s hawkish shift. On September 16, the Fed raised rates by 25 bps to 3.75%–4.00% and indicated that inflation remains elevated. Market expectations also point toward another possible hike this year. Higher rates and elevated Treasury yields can increase the opportunity cost of holding non-yielding gold.
However, today’s movement is not purely bearish. The US dollar and Treasury yields have pulled back, while oil prices have eased, which has provided some support to gold and helped the recent recovery.
Key Level
Resistance Levels ; 4400 / 4420
Support Levels ; 4350 / 4320
As long Price failure to sustain above 4,400 / 4,420 could trigger another downside reaction toward 4,350 and potentially 4,320 a clean breakout and sustained hold above the resistance zone would weaken the immediate bearish setup.
Hope you found this analysis helpful. 👍
Like, Comment & Follow for more updates.
Short 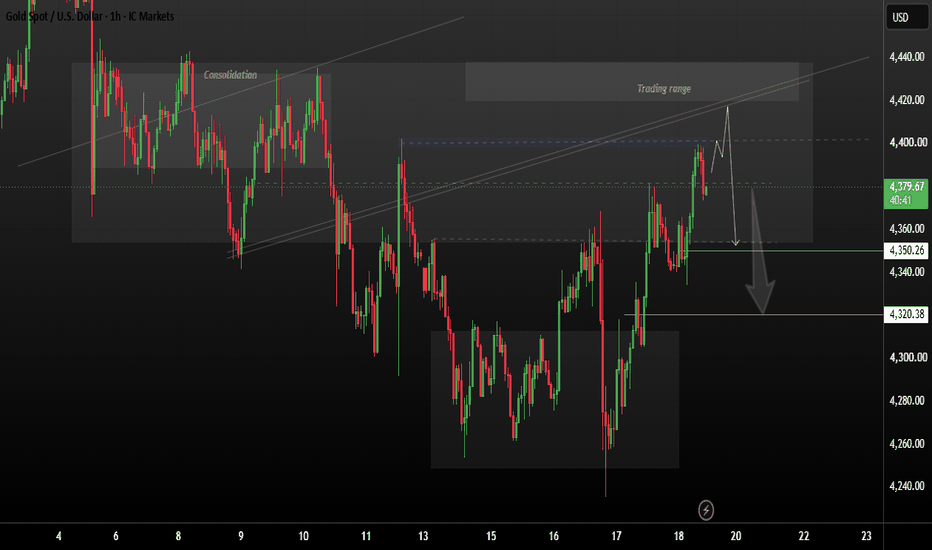
Short 
Education 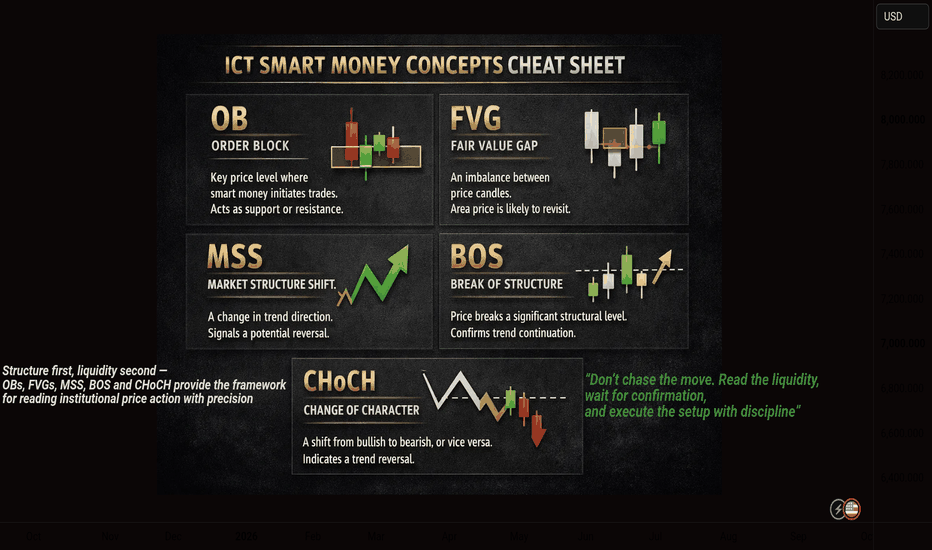
Weekly Outlook: Bullish Retest After Trendline BreakoutGold enters next week after posting its first weekly gain in four weeks, supported by easing oil prices and the unwinding of bearish positions built ahead of the Fed meeting. The Fed raised rates by 25 bp this week, but traders are now pricing roughly a 55% chance of another hike in October. Meanwhile, the U.S. dollar remains near a seven-week high and the 10-year Treasury yield is hovering around the critical 5% area, so the macro environment is still mixed for Gold.
Next week, attention shifts toward Fed speakers, U.S. PMI data and broader inflation signals. Oil remains above $100 and Middle East tensions are still an important source of volatility, while markets will also monitor the Trump–Xi meeting for potential shifts in global risk sentiment.
SMC View
The H1 chart is showing a meaningful structural improvement.
Price has broken the descending trendline, printed a bullish MSS followed by BOS, and is now consolidating beneath the $4,390–$4,400 bullish BOS area. This suggests bearish delivery has weakened and short-term order flow is beginning to reprice higher.
The cleaner continuation setup is not to chase current price. The $4,320–$4,340 trendline retest / FVG rebalance area remains the strongest discount POI for a potential continuation move.
If buyers defend this area and produce fresh bullish displacement, external buy-side liquidity above becomes the next logical draw.
Main Trading Scenario
Buy Priority: $4,320–$4,340
Condition: Wait for a controlled retracement into the broken trendline / FVG rebalance zone. A liquidity sweep followed by bullish rejection and a lower-timeframe MSS or CHOCH would provide confirmation.
Entry: $4,320–$4,340 after bullish confirmation
SL: Below $4,300 and the confirmed reaction structure
TP1: $4,390–$4,400
TP2: $4,424–$4,440
TP3: $4,445–$4,460
Key Zones to Watch
$4,390–$4,400 — Bullish BOS / immediate resistance
$4,424.395 — Decision POI
$4,425–$4,440 — External BSL / secondary target
$4,445–$4,460 — Premium BSL / major upside draw
$4,320–$4,340 — Main trendline retest / FVG POI
$4,295–$4,310 — Discount Demand
Below $4,295 — Bullish continuation structure weakens
The weekly bias remains Buy, but the preferred approach is to wait for discount rather than chase price beneath resistance.
A retracement into $4,320–$4,340 followed by bullish confirmation would keep the breakout structure constructive and could reopen delivery toward $4,400, then the external liquidity around $4,425–$4,440. If bullish momentum persists, the $4,445–$4,460 Premium BSL remains the larger upside objective.
No confirmation, no trade. Long 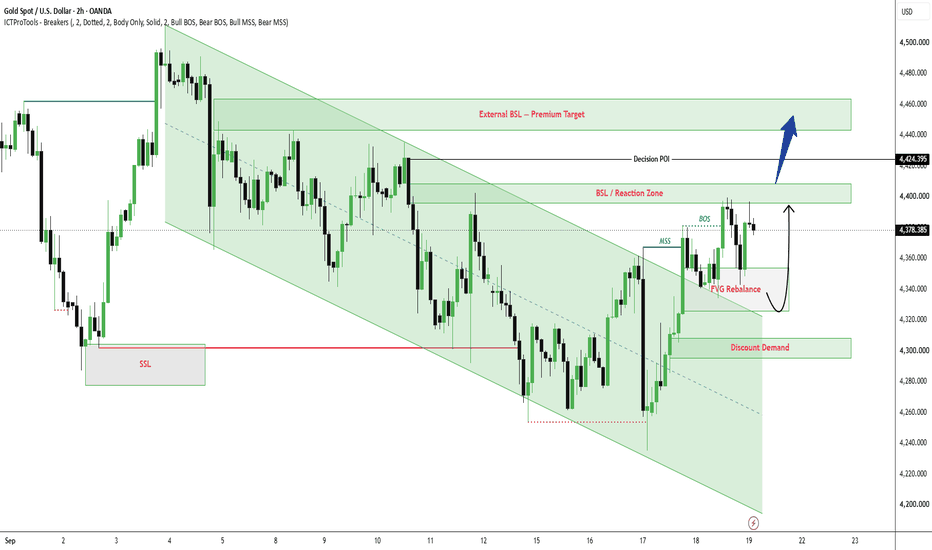
Long 
XAUUSD — Bullish Wave Structure Toward 4,490
From Kelly’s view, gold is rebuilding a bullish structure after breaking away from the previous descending trendline. Price is trading around 4,391, and the recent recovery suggests buyers are trying to establish a new impulsive sequence toward the upper Fibonacci resistance zones.
The key idea is simple: the main trend may stay bullish while price continues to form higher lows, with 4,405–4,415 acting as the first important resistance test before a potential expansion toward 4,459 and the 4,488–4,497 area.
⟡ Market structure
Gold has recovered strongly from the 4,240–4,260 swing-low area and is now trading above the former descending trendline.
The short-term structure has shifted toward higher lows, while the projected Elliott Wave path suggests another bullish impulse may be developing.
The first obstacle is the Fibonacci resistance zone around 4,405–4,415. If buyers can absorb selling pressure here, price could continue toward 4,433 and 4,459.
Above that, the major resistance and projected Wave (5) completion zone sits around 4,488–4,497, close to the 2.618 Fibonacci extension.
➤ Key levels
◌ Current price area: 4,390–4,395
◌ Main bullish retest zone: 4,375–4,390
◌ Strong support: 4,335–4,350
◌ First resistance: 4,405–4,415
◌ Key resistance: 4,433
◌ First target: 4,459
◌ Main target: 4,488–4,497
◌ Invalidation: Below 4,335
⌁ Elliott Wave view
Wave (1): The current recovery may extend toward the 4,405–4,415 resistance area.
Wave (2): A controlled pullback toward approximately 4,375–4,390 could follow if buyers take profit near resistance.
Wave (3): If the pullback holds and bullish confirmation appears, the stronger expansion could target 4,459.
Wave (4): Price may then consolidate or retrace toward the 4,430–4,440 area.
Wave (5): The final bullish leg could extend toward 4,488–4,497, where the major Fibonacci resistance and projected Wave (5) target overlap.
▸ Trading scenario
Preferred bullish scenario
Entry: 4,375–4,390 after bullish confirmation
Stop Loss: Below 4,335
Take Profit 1: 4,410–4,415
Take Profit 2: 4,459
Take Profit 3: 4,488–4,497
The cleaner plan is to wait for buyers to defend the projected Wave (2) retracement area rather than chase price directly into Fibonacci resistance.
Alternative scenario:
If gold breaks and holds above 4,415 without a deeper pullback, a confirmed retest of this zone could support continuation toward 4,433–4,459.
◌ Invalidation
The bullish structure would weaken if price loses the 4,335–4,350 support area and begins trading back below the recent higher-low structure. A sustained break below 4,335 would invalidate the preferred bullish wave sequence.
⌁ Kelly’s view
Kelly’s main view remains bullish while gold continues to defend its higher-low structure above 4,335–4,350.
The immediate test is 4,405–4,415. If buyers can break and hold above this Fibonacci resistance, the next wave may open the way toward 4,459, followed by the larger 4,488–4,497 Wave (5) target.
Do you think gold will complete this bullish wave structure toward 4,490, or retest the key support zone first? Long 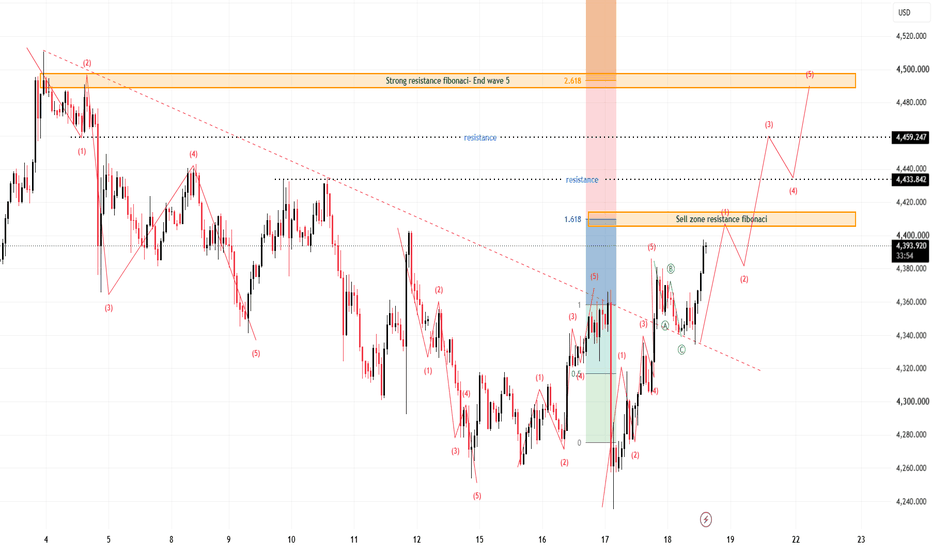
H1 Major Supply Rejection Toward Lower LiquidityXAUUSD is trading around 4,378 after extending its recovery from the lower H1 structure. Price has returned directly into the 4,385–4,405 Major Supply Zone, where the broader bearish trendline also remains relevant.
Gold reached a one-week high on Friday as easing crude oil prices reduced part of the inflation pressure that had dominated markets earlier in the week. Spot gold climbed about 1.2%, while softer energy prices helped Treasury yields retreat from their recent highs.
However, the broader macro backdrop remains restrictive. The Fed has raised rates to 3.75%–4.00% and still expects further tightening, while markets currently price roughly a 55% probability of another hike in October. The dollar also remains near a seven-week high, and the U.S. 10-year yield has recently traded above 5%, limiting the strength of gold’s recovery.
Technical View
The H1 recovery has improved after the recent MSS and rebound from lower demand, but price is now entering the main decision area.
The 4,385–4,405 Major Supply Zone aligns with the previous bearish trendline and recent swing structure. This makes the current area less attractive for chasing longs.
A rejection or failed acceptance above this supply could trigger a corrective move back toward the 4,335–4,350 Demand Zone.
If that demand fails to absorb selling pressure, the larger downside objective sits around 4,270–4,290, where the marked downside target and previous liquidity structure align.
Below that, the 4,235–4,250 Major Demand / SSL Zone remains the deeper structural support.
Key Zones
Current Price: 4,378.385
Major Supply / Sell Area: 4,385–4,405
Demand Zone: 4,335–4,350
Downside Target: 4,270–4,290
Major Demand / SSL: 4,235–4,250
Bearish invalidation: sustained H1 acceptance above 4,410–4,420
Trading Plan
Sell Priority: 4,385–4,405
Condition: wait for price to retest Major Supply and show bearish rejection, liquidity sweep, failed acceptance or lower-high confirmation.
TP1: 4,335–4,350
TP2: 4,270–4,290
TP3: 4,235–4,250
Invalidation: sustained H1 acceptance above 4,420.
Sell View
The cleaner approach is to avoid selling aggressively below current price after the recent recovery.
I prefer to let gold test 4,385–4,405 first. If sellers clearly defend the zone, the risk/reward improves for a rotation back toward demand.
A clean H1 breakout and acceptance above 4,420 would weaken the immediate bearish scenario and require reassessment.
Important Note
Lower oil prices are helping gold recover in the short term, but the Fed’s renewed tightening cycle, a strong dollar and elevated Treasury yields remain important headwinds. This creates a two-sided environment where liquidity sweeps around resistance may be aggressive.
Final View
Gold has recovered strongly, but H1 is now testing a key supply area rather than trading from clean demand.
The main scenario is a retest and rejection from 4,385–4,405, followed by a move toward 4,335–4,350 first and potentially 4,270–4,290 if bearish momentum expands.
Will H1 Major Supply stop the recovery before gold rotates back toward lower liquidity? Short 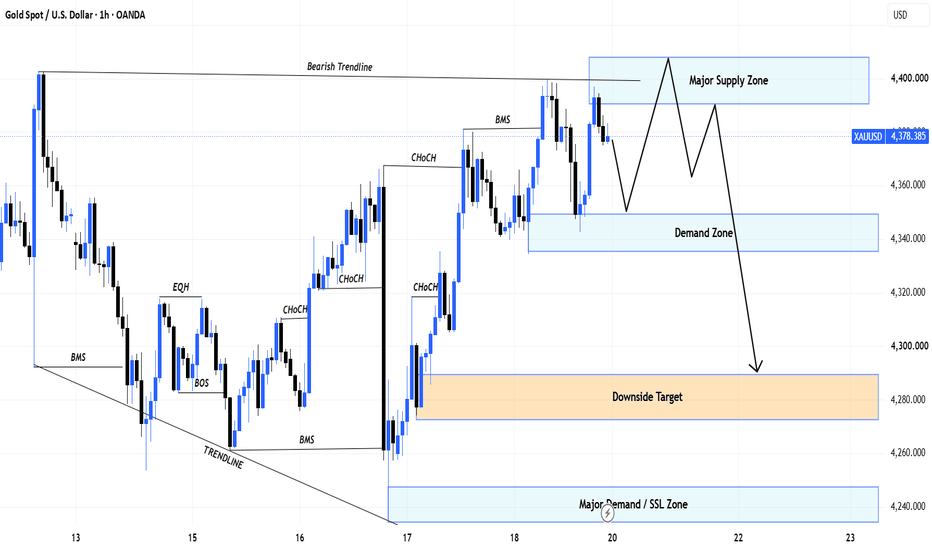
BSL Rejection Opens Corrective Move
Fundamental Analysis
Gold remains supported by softer oil prices and easing Treasury yields after the Fed’s latest rate hike. However, the Fed has signaled that further tightening is still possible, so Gold may remain sensitive to changes in yields, the dollar and energy prices.
Technical Analysis
On H1, Gold confirmed a bullish BOS and pushed into the 4,390–4,405 BSL, where price is now showing rejection.
This makes a short-term correction more likely. The first support sits around 4,350–4,367 OB + Fibo. If sellers break this zone, price could extend toward the 4,300–4,318 POC.
Important Key Levels
4,390–4,405 — BSL / Major Resistance
4,350–4,367 — OB + Fibo
4,300–4,318 — POC
4,235–4,250 — SSL / Major Support
Trading Scenario
Sell priority remains after rejection from 4,390–4,405.
Target: 4,350–4,367 first, then 4,300–4,318 if support fails.
Invalidation: H1 acceptance above 4,405.
Overall View
Gold has reached major upper liquidity after a strong recovery. The cleaner setup now is to watch for a corrective move toward lower support rather than chase buys near resistance.
Will Gold hold the OB + Fibo, or correct deeper toward the POC? Short 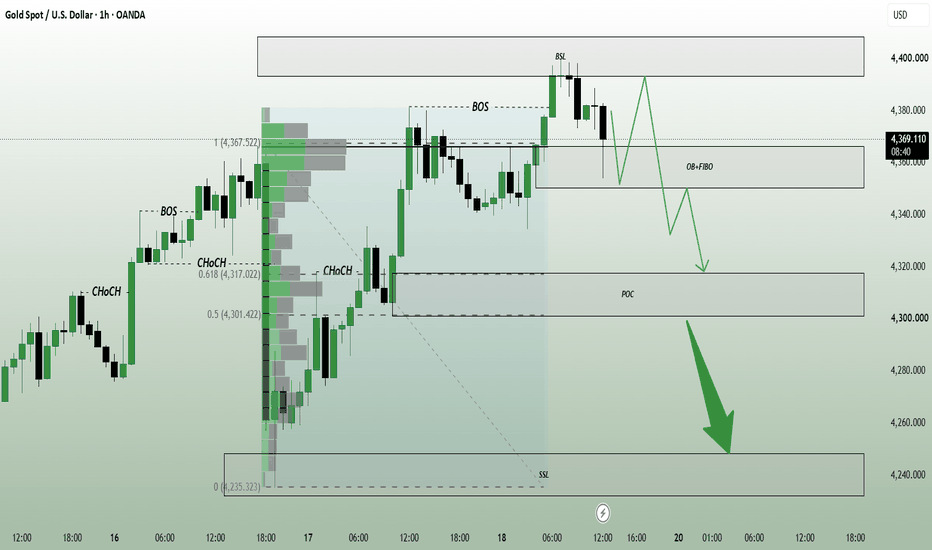
XAUUSD Daily: Post-Range Breakout, Now at the Pullback Decisionwww.tradingview.com
This is the Gold Spot / USD daily chart (19 Sep 2026). Price is currently around 4,378. The core idea is that Gold fell for a long stretch, built a range, swept sell-side liquidity, broke the HTF trendline, and has now pulled back and bounced. It is approaching a decision point for the next move. All levels below are my approximate readings from the chart, so small deviations are possible.
1. Big picture (Nov 2025 to now)
Gold started rising in Nov 2025 from around 4,000 and peaked near 5,600 at the end of Jan 2026. This is marked as External Range Liquidity.
A sharp drop followed in early Feb, then a second high formed in March near 5,400, lower than the first. This is marked as Buy Side Liquidity.
By late March, price fell back to around 4,100. April brought a bounce, but it stalled near 4,900, a rejection inside the Internal Range Liquidity FVG (roughly 4,860 to 4,970). The highs kept stepping down: 5,600, 5,400, 4,900.
From June to early Aug, price moved sideways in a range (roughly 3,930 to 4,300), labeled "Price in Range" on the chart. In July, wicks below the range swept the sell-side liquidity, where the Order Block (OB) zone sits at roughly 3,860 to 4,010.
In Aug, price broke out of the range and closed above the HTF Resistance Trendline. This is the first major structural change. A high formed in late Aug near 4,680.
A pullback followed through mid-Sept, bottoming near 4,235, and price has now bounced back to 4,378.
2. Key levels
Upside (POIs):
POI 1, around 4,390 to 4,400: immediate resistance, where price is now.
POI 2, around 4,520: an older swing level and the second target.
POI 3, around 4,680 to 4,690: the Aug high and the main upside target. The green arrow points here.
Beyond that: the Internal Range FVG (4,860 to 4,970), then Buy Side Liquidity (5,400) and External Range Liquidity (5,600).
Downside:
DIV POI, around 4,235: the recent swing low and first support.
FVG zone (pink box), roughly 4,100 to 4,235: the imbalance left by the Aug breakout, which price may return to fill.
DIV POI 2, around 4,080: the last line of defense below the FVG.
Below that: the range low and Sell Side Liquidity with OB (3,860 to 4,010).
3. Structure read
Short term looks better. The July low was about 3,930 and the Sept pullback low is 4,235, so price has made a higher low. The trendline break is also a bullish signal.
Medium term calls for caution. The 4,680 high sits below April's 4,900, so on the bigger picture the lower-high structure has not been broken. Solid bullish confirmation would be a close above 4,690, and then above 4,900.
The trendline now sits below price and appears to run near the FVG zone. That makes 4,100 to 4,235 an important support area, since the FVG and the trendline overlap there.
4. The USD (DXY) factor
The small USD chart in the top-left shows a falling red trendline and a "FVG with support" zone below. The analyst's note says the USD made a sharp bullish reversal but has weakened over the past two days and may now target downside POIs. Gold and the USD usually move inversely, so if the USD keeps falling, Gold gets support to move up. If the USD strengthens again, Gold may struggle to hold above 4,400. This is only a correlation, not a guarantee.
5. Two possible scenarios
Bullish scenario:
Price holds above 4,235 and prints a daily close above 4,400 (POI 1).
Next targets are 4,520 (POI 2), then 4,690 (POI 3).
A close above 4,690 opens the path toward the 4,900 FVG, where major resistance is likely.
Pullback / bearish scenario (red arrow):
Price is rejected at POI 1 and starts falling again.
First stop is 4,235. If that breaks, price could drop into the FVG (4,100 to 4,235).
A reaction from the FVG could set up another move higher, which is the chart's green plan. A close below 4,080 weakens the bullish idea and puts the range low and sell-side liquidity (3,860 to 4,010) back in play.
6. Summary
The short-term bias is cautiously bullish, because the trendline is broken, a higher low has formed, and the USD is weakening. However, price is sitting at POI 1, the first area of resistance, and the larger structure has not fully flipped given the lower highs. The clearest confirmation would be a close above 4,690, and the most important support is 4,235 with the FVG zone below it.
This is educational chart analysis only, not trading or financial advice. Please set your own risk management and stop loss, and recheck the levels on a live chart before any trade. Long 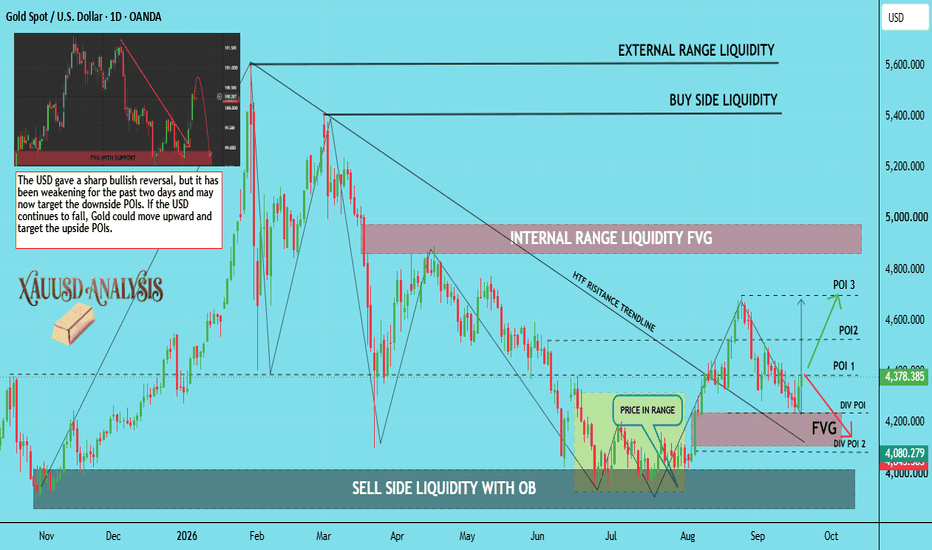
Your Risk-to-Reward Ratio Might Be Lying to YouA lot of traders are taught that the higher the Risk-to-Reward ratio, the better.
A 1:3 setup looks more attractive than 1:1. A 1:5 setup looks even better. And when traders see 1:10, many think they’ve found an incredible opportunity.
But there’s a problem:
R:R only tells you how much you can lose versus how much you aim to make. It does not tell you how likely the market is to actually reach your TP.
That’s why an attractive R:R can sometimes give traders confidence in the wrong place.
1. A Good R:R Doesn’t Mean a Good Setup
Suppose you risk $100 and set a $300 profit target.
On paper:
Risk = $100
Reward = $300
R:R = 1:3
Looks reasonable.
But what if price needs to break through two major resistance zones and move well beyond its typical range to reach that $300 target? Is the target still realistic?
You can make almost any chart show 1:5 simply by moving the TP farther away.
The number changes. The probability of the setup doesn’t automatically improve.
2. R:R and Win Rate Must Be Viewed Together
This is where many traders go wrong.
A strategy doesn’t need an extremely high win rate to be profitable if its average winner is large enough. On the other hand, a high R:R cannot save a system whose win rate is too low.
Here’s a simple example, ignoring fees and slippage:
Strategy A
R:R = 1:1
Win rate = 60%
After 100 trades:
60 winners = +60R
40 losers = -40R
Result: +20R
Strategy B
R:R = 1:3
Win rate = 20%
After 100 trades:
20 winners = +60R
80 losers = -80R
Result: -20R
Interestingly, Strategy B has a much more attractive R:R, yet it still loses money in this example.
So the question shouldn’t only be:
“What is the R:R on this trade?”
It should also be:
“At this R:R, how often does my system actually win?”
3. Pay Attention to Expectancy
This is a number every trader should understand.
In simple terms:
Expectancy = (Win Rate × Average Win) − (Loss Rate × Average Loss)
Suppose your system:
Wins 45% of trades
Has an average winner of 2R
Loses 55% of trades
Has an average loser of 1R
The expectancy would be:
(0.45 × 2R) − (0.55 × 1R) = +0.35R
That doesn’t mean every trade will make 0.35R. An individual trade can still win or lose.
It means that over a sufficiently large sample of trades , those assumptions produce an average expectancy of +0.35R per trade before costs.
That’s why trading should be evaluated as a series of decisions, not by the outcome of a single trade.
4. Don’t Force the Chart to Give You 1:3
This is a mistake I see all the time.
A trader finds a setup, but the market structure only provides a reasonable target of around 1.5R.
They want at least 1:3.
So what do they do?
Move the TP farther away.
Or worse:
Move the SL closer.
Now the chart shows a beautiful 1:3, but the logic of the trade has been changed just to satisfy a number.
Your SL should be placed where your trade thesis is actually invalidated.
Your TP should be placed where market structure and price behavior suggest price can reasonably reach.
Then calculate the R:R.
Not the other way around.
5. Planned R:R and Realized R:R Are Two Different Things
You might plan a 1:3 trade.
But if you regularly take profits at +0.8R, move your stop without a plan, close trades out of fear, or allow a -1R loss to become -2R...
then your actual R:R is no longer 1:3.
This is why journaling matters.
Don’t just record the R:R you planned at entry. Track your actual:
Average Win, Average Loss, Win Rate, and Expectancy.
Those numbers tell you how you really trade , not how good your setup looked on TradingView.
6. A Higher R:R Comes With a Price
A farther target usually means the market needs to travel a greater distance for you to win.
That can reduce your win rate.
A closer target may be reached more often, but each winner produces fewer R.
There is no magical ratio such as 1:2 or 1:3 that works for every strategy.
A scalping system, trend-following system, and mean-reversion system can have completely different win rates and return distributions.
What matters is whether the system produces positive expectancy over a sufficiently large sample of trades.
7. Before Entering, I Check These 4 Things
Instead of looking only at R:R, ask:
Structure: Is my SL placed where the trade idea is actually invalidated?
Target : Is my TP based on market structure, or did I simply stretch it to reach 1:3?
Probability : What does my journal or backtest tell me about how this setup performs?
Execution : Do my actual average wins and losses match what I planned?
If you don’t know the answers to these questions, a 1:5 displayed on your chart doesn’t tell you very much.
R:R still matters. It helps quantify risk and compare the potential reward with the amount of capital you’re willing to lose.
But don’t let an attractive number convince you that a trade automatically has an edge.
Risk-to-Reward tells you the payoff.
Win rate tells you the probability.
Expectancy tells you how they work together.
A trader needs all three. Education 
XAUUSD — 4400 Is the Trap Zone XAUUSD — 4400 Is the Trap Zone
Gold gave us a messy week, but the story is actually pretty clear.
Earlier in the week, sellers were in control after price failed to hold the higher range. Every bounce was getting sold, and gold kept drifting lower toward the discount area. Then we saw the market defend the 4,235 - 4,280 zone, which created that short-term recovery into the end of the week.
But here is the part I don’t want to ignore.
This recovery is now pushing directly into a bearish mitigation area around 4,390 - 4,410. That is where trapped buyers from the previous breakdown may meet sellers again. Above that, the stronger HTF supply zone sits around 4,445 - 4,465. So even though gold bounced well from the lows, the bigger structure is still not fully repaired.
In simple SMC language: gold swept lower liquidity, bounced from discount, and is now retesting a zone where sellers may defend the trend.
The current price around 4,378 is sitting in the middle. Not cheap enough to buy. Not high enough to sell blindly. This is why patience matters here.
My main view is still bearish while gold stays below 4,410 - 4,465.
If price rejects from the bearish mitigation zone, I would expect a pullback toward the Bullish OB around 4,295 - 4,310. That zone is important. If buyers defend it, gold can build another bounce. But if price breaks below that OB, the next sell-side liquidity around 4,260 - 4,235 becomes exposed again.
For bulls to take real control, gold needs to break above 4,465 and hold. Without that, any move into supply still looks like a possible trap.
Key price zones to watch
Current price area: 4,378
Bearish mitigation zone: 4,390 - 4,410
HTF supply zone: 4,445 - 4,465
Main reaction support: 4,295 - 4,310
Lower sell-side liquidity: 4,260 - 4,235
Bullish confirmation: clean break above 4,465
Invalidation for bearish view: strong close above 4,465
For now, I’m reading this as a recovery into resistance, not a clean bullish reversal yet.
Do you think gold rejects from 4,400 first, or pushes into the HTF supply before dropping?
Short 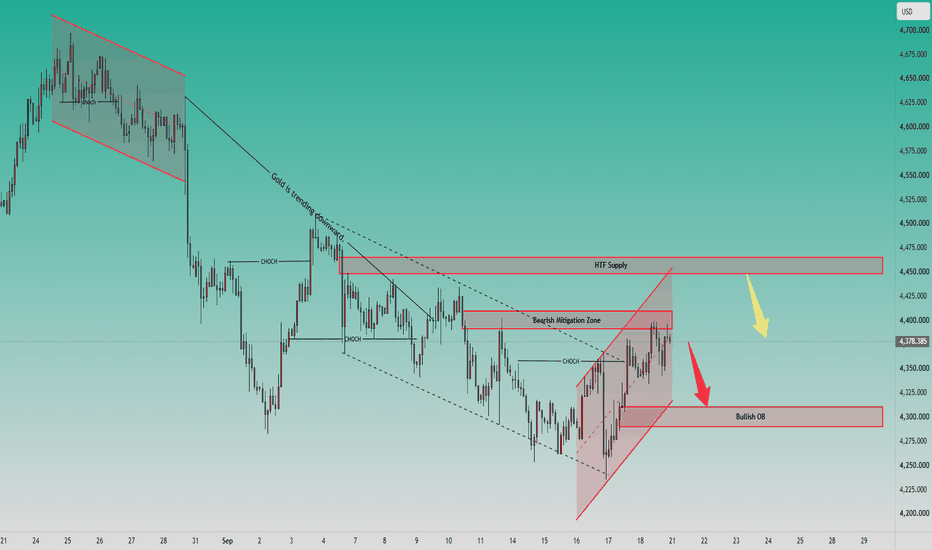
XAUUSD H4: Bullish Recovery Toward the Upper OB After the LiquidXAUUSD is currently trading around 4,334, showing a short-term bullish recovery after reacting from the H4 Demand Zone around 4,230–4,260 and reclaiming the 4,320–4,335 liquidity breakout area.
The broader H4 structure previously experienced a corrective phase after rejecting from the 4,650–4,690 Buy-Side Liquidity + OB zone. Multiple BOS confirmed the downside correction, but recent price action suggests that bearish pressure is weakening as price reacts from the lower demand area and begins to reclaim short-term structure.
Price is now holding above the recent liquidity breakout zone around 4,320–4,335. If this area continues to hold as support, the next important POI is the 4,480–4,510 OB.
The higher-timeframe Buy-Side Liquidity + OB around 4,650–4,690 remains the major upside objective if bullish momentum continues and price successfully reclaims the intermediate OB.
The Bias: Short-Term Bullish Recovery / Potential Continuation After Liquidity Breakout.
The Target Path: Price may first retest the 4,320–4,335 breakout zone, followed by expansion toward the 4,480–4,510 OB. If price successfully reclaims this OB, the next major area of interest could be the 4,650–4,690 Buy-Side Liquidity + OB.
Potential Setup: Observe price reaction around 4,320–4,335. A controlled pullback into this area, followed by bullish displacement and a confirmed MSS/CHoCH, could provide a potential continuation scenario toward the upper OB.
Confirmation: A successful hold above 4,320–4,335, followed by bullish displacement and a clear break above the recent H4 swing structure, would strengthen the bullish recovery thesis toward 4,480–4,510.
Alternative Scenario: If price fails to hold the liquidity breakout and moves back below 4,320, the recovery could lose momentum. A deeper retracement toward the 4,230–4,260 Demand Zone may then become relevant.
Invalidation: Strong acceptance below the 4,230–4,260 Demand Zone would weaken the bullish recovery thesis and suggest that the broader corrective structure remains dominant.
Educational purposes only — Not financial advice. Long 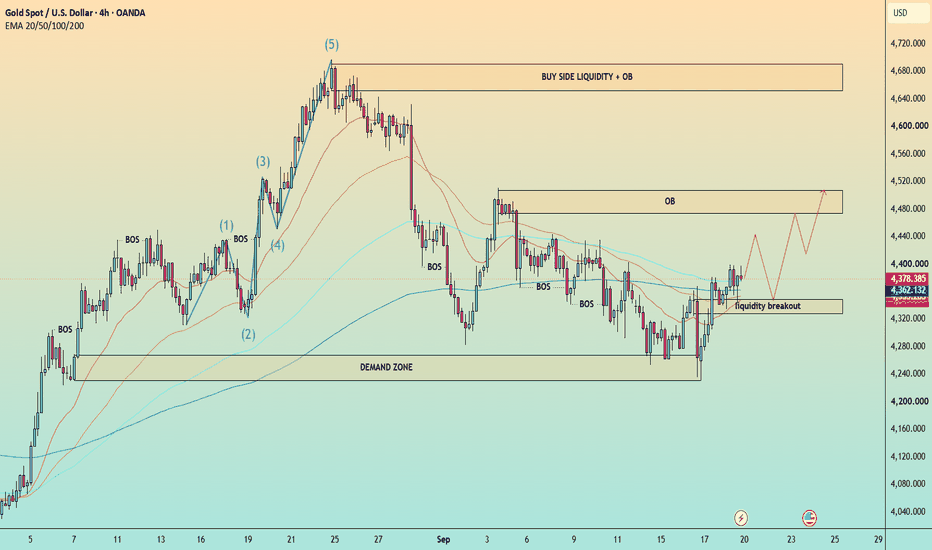
XAUUSD: Recovery Is Here, But 4,445 Is the Trap Zone XAUUSD: Recovery Is Here, But 4,445 Is the Trap Zone
Market Context
Gold is holding its recent recovery from the six-week low around 4,235, but the market is still cautious near the end of the week.
The US Dollar is trading quietly as oil prices and Treasury yields cool down, helping gold recover in the short term. Gold also closed above the 100-day SMA around 4,320, while the daily RSI remains neutral.
This tells us one thing: buyers are reacting, but they have not fully taken control yet.
Technical Structure
Gold is recovering into a sensitive resistance area after the strong rebound from the weak low.
Price is currently trading around 4,390 - 4,395, approaching the Main Sell Reaction Zone and LTF Supply area. This is where short-term buyers may start facing pressure again.
The key resistance zone is 4,420 - 4,445. This area overlaps with HTF Supply and the Major Premium POI, which makes it an important sell reaction zone. If gold pushes into this area and gets rejected, bearish pressure may return quickly.
Above that, 4,488 is the key liquidity reference. A clean break above 4,488 would weaken the bearish setup and open the door for a stronger recovery.
Below current price, 4,350 - 4,360 is the first reaction support. If gold loses this area, the next downside risk may return toward 4,280 and potentially the 4,235 weak low.
Key Levels
Current Price: 4,393
Main Sell Reaction Zone: 4,420 - 4,445
LTF Supply / Internal Bearish POI: 4,350 - 4,390
Key Liquidity Level: 4,488
First Support: 4,350 - 4,360
Weak Low: 4,235
Bullish Recovery Confirmation: Above 4,488
Bearish Pressure Zone: Below 4,420 - 4,445
Trading Plan
Primary Sell Scenario
Entry: 4,420 - 4,445 after bearish confirmation
SL: Above 4,488
TP: 4,360 / 4,320 / 4,280
Condition: Price recovers into the HTF Supply zone but fails to break higher. A rejection from this area would suggest sellers are still defending the premium zone.
Short-Term Buy Continuation Scenario
Entry: Above 4,445 after breakout and retest
SL: Below 4,390
TP: 4,470 / 4,488 / 4,520
Condition: Buyers must break through the Main Sell Reaction Zone and hold above it. Without acceptance above 4,445, the recovery remains vulnerable.
Support Reaction Scenario
Entry: 4,350 - 4,360 after bullish confirmation
SL: Below 4,320
TP: 4,390 / 4,420 / 4,445
Condition: Gold must show a clean reaction from the first support area. This is only a recovery setup unless price breaks above 4,445 with strength.
Breakdown Sell Scenario
Entry: Below 4,350 after breakdown and retest
SL: Above 4,390
TP: 4,320 / 4,280 / 4,235
Condition: Gold loses the recovery base and fails to reclaim it. This would expose lower liquidity again and keep the bearish structure active.
Overall Bias
Gold is recovering, but the recovery is moving directly into a dangerous supply zone.
The market may look bullish in the short term, but 4,420 - 4,445 is the real test. If buyers cannot break this area, sellers may use the recovery as another opportunity to push price lower.
Above 4,488, the bearish view starts to weaken. Below 4,350, the recovery loses strength and downside risk returns.
Best approach: do not chase the rebound late. Wait for either a confirmed rejection from 4,420 - 4,445 or a clean breakout above 4,488.
Will gold break through the premium supply zone, or will sellers turn this recovery into another trap?
Long 
Short 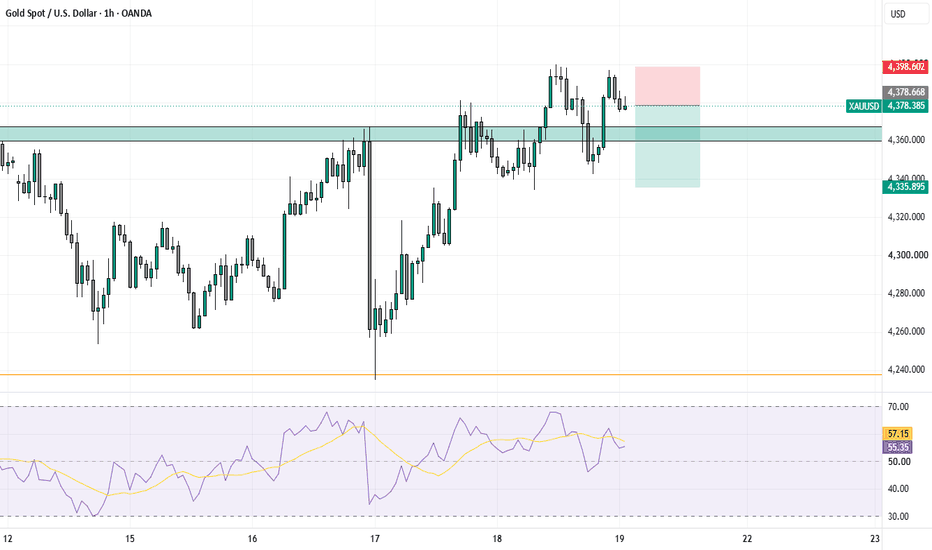
XAUUSD – H2 Bullish Recovery Toward Supply
XAUUSD is trading around 4,354 after extending its recovery from the lower structural area. Price has broken above the recent descending trendline and printed an MSS, showing that short-term buyer momentum is improving. However, gold is now entering the first resistance / supply zone, so a controlled pullback may be needed before the next expansion.
Gold gained more than 2% on Thursday as the U.S. dollar weakened, oil prices eased and Treasury yields pulled back. Spot gold was still around 4,361 early Friday, while the U.S. 10-year yield moderated to roughly 4.94% and Brent slipped toward $103.77.
The broader macro backdrop remains restrictive. The Fed raised rates by 25 bp to 3.75%–4.00%, and 16 of 18 policymakers still expect at least one additional hike this year. That keeps higher real yields and a stronger-dollar risk in play even as gold attempts to recover.
Technical View
The H2 chart shows a meaningful recovery from the lower trendline structure around 4,260–4,280.
Price has now pushed back above the descending trendline and printed a bullish MSS, which weakens the immediate bearish momentum.
The first important obstacle is the 4,355–4,380 Resistance / Supply Zone. Because price is already testing this area, chasing the rebound offers weaker positioning.
The cleaner bullish location sits lower at the 4,300–4,320 Demand Zone. A controlled pullback into this area followed by bullish rejection, higher-low formation or another MSS would support continuation.
Above current resistance, the next major target is the 4,415–4,435 Major Supply Zone.
If buyers establish acceptance above that structure, the larger recovery objective sits around 4,495–4,510.
Key Zones
Current Price: 4,353.695
Resistance / Supply: 4,355–4,380
Buy Priority / Demand: 4,300–4,320
Major Supply: 4,415–4,435
Upper Supply: 4,495–4,510
Structural Support: 4,234.819
Trading Plan
Buy Priority: 4,300–4,320
Condition: wait for an H2 pullback into demand followed by bullish rejection, liquidity sweep + reclaim, higher-low formation or renewed MSS confirmation.
TP1: 4,355–4,380
TP2: 4,415–4,435
TP3: 4,495–4,510
Invalidation: sustained H2 acceptance below 4,300 would weaken the immediate recovery setup.
Buy/Sell View
The preferred idea is not to chase gold directly into resistance.
A retracement toward 4,300–4,320 would provide a cleaner location to evaluate buyer strength. If demand holds and structure confirms, the recovery can continue toward the higher supply zones.
If demand fails, the bullish recovery thesis should be reassessed rather than forcing another long.
Important Note
The Fed remains hawkish despite the current gold rebound. Lower oil and Treasury yields are helping buyers in the short term, but another rise in yields or renewed dollar strength could quickly cap the recovery.
Final View
Gold is showing an improving H2 recovery after breaking the descending trendline, but price is now testing its first important resistance.
The cleaner scenario is a pullback into 4,300–4,320 followed by confirmed bullish continuation, targeting 4,355–4,380, then 4,415–4,435, with 4,495–4,510 as the larger recovery objective.
Can buyers defend H2 demand before gold expands toward the major supply zone? Long 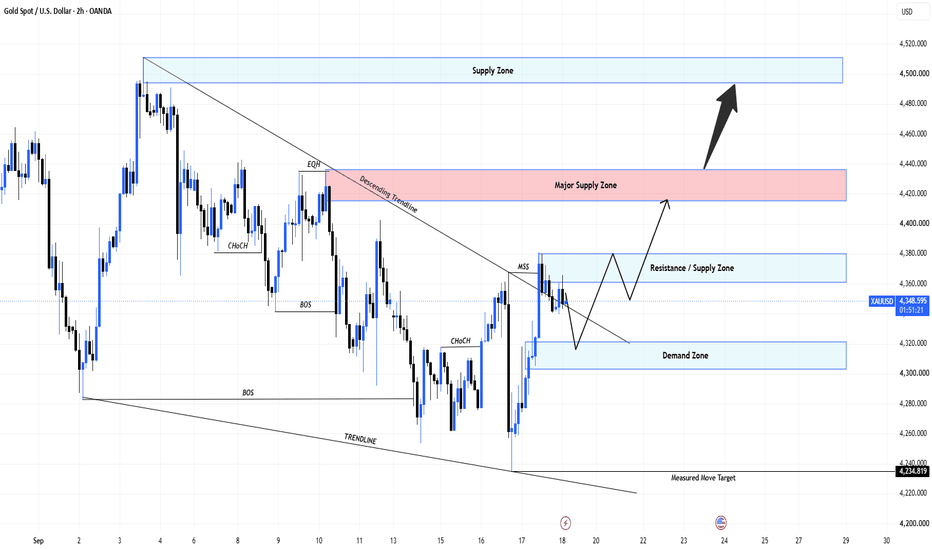
W.D. Gann Theory: When Price and Time MeetW.D. Gann’s approach was built around one simple idea: price and time should be studied together. Instead of asking only “Where could price react?”, Gann also asked “When could that reaction become important?”
1. Price Level
Start with a meaningful level: previous high or low, major support/resistance, or an important breakout area. A level by itself is not a trade, but it gives you a place to watch.
2. Time Window
Gann focused heavily on market cycles and timing. In practical trading, this can mean watching whether price reaches an important level during a period where volatility or structure is already changing.
The key idea is simple:
Price Level + Time Window = Higher-Quality Area to Watch
3. Wait for the Reaction
This is where many traders make the mistake. Gann theory should not mean predicting a reversal just because price and time line up.
I still want confirmation: rejection candles, a structure break, momentum shift, or a clean reclaim of the level.
A practical sequence is:
Key Level → Time Window → Price Reaction → Confirmation → Trade
How This Can Improve Trading
The benefit is not “knowing the future.” It is becoming more selective.
Instead of entering every support or resistance level, you wait for price, timing and confirmation to align. That can help reduce random trades, improve entry location and make invalidation clearer.
4. AURICVERSE Takeaway
Gann Theory becomes useful when it helps you stop treating every level the same.
''Price tells you where.
Time tells you when to pay attention.
Confirmation tells you whether to trade.'' Education 
Long 
XAUUSD — Post-Fed FVG Repricing Buy Setup
Gold is trading around $4,320 after a highly volatile post-FOMC session. The Fed raised rates by 25 bp to 3.75%–4.00% and signaled that additional tightening may still be needed, pushing the U.S. dollar to a seven-week high and lifting short-term Treasury yields. Despite that hawkish backdrop, Gold recovered more than 1% from the post-Fed low as traders reassessed positioning and oil prices eased from recent highs.
Brent crude has also pulled back toward $104, reducing some of the immediate energy-driven inflation pressure, although broader Middle East risks remain elevated.
SMC View
H1 price remains inside the broader descending channel, so the higher-timeframe structure is not fully bullish yet. However, the latest move swept buy-side liquidity near $4,350–$4,360, delivered a strong bearish displacement, and then reacted sharply from the lower portion of the channel.
The current rebound may represent bullish repricing after that liquidity event. The nearby FVG around $4,285–$4,305 is the key mitigation area to watch.
A controlled pullback into this imbalance, followed by a bullish MSS or CHOCH, could confirm that buyers are rebuilding short-term order flow toward the upper liquidity zones.
Main Trading Scenario
Buy Priority: $4,285–$4,305
Condition: Wait for Gold to retrace into the FVG / discount area and form bullish rejection, followed by a lower-timeframe bullish MSS or CHOCH.
Entry: $4,285–$4,305 after confirmation
SL: Below $4,260 and the reaction low
TP1: $4,345–$4,365
TP2: $4,390–$4,405
Key Zones to Watch
$4,401.403 — Premium Bearish OB
$4,345–$4,365 — Reclaimed buy-side liquidity / resistance
$4,285–$4,305 — Main FVG buy zone
$4,225–$4,245 — External SSL / Deep Discount Demand
$4,260 — Immediate bullish invalidation area
Descending channel resistance — Major structural barrier
Prime Gold View
The buy bias is focused on confirmed repricing from the FVG, not chasing the current recovery.
If buyers defend $4,285–$4,305 and produce a clean bullish structure shift, Gold could rotate back toward $4,350–$4,365, with the $4,400 Premium Bearish OB becoming the larger upside objective.
The broader channel remains bearish, so confirmation is essential before treating the recovery as sustainable.
No confirmation, no trade. Long 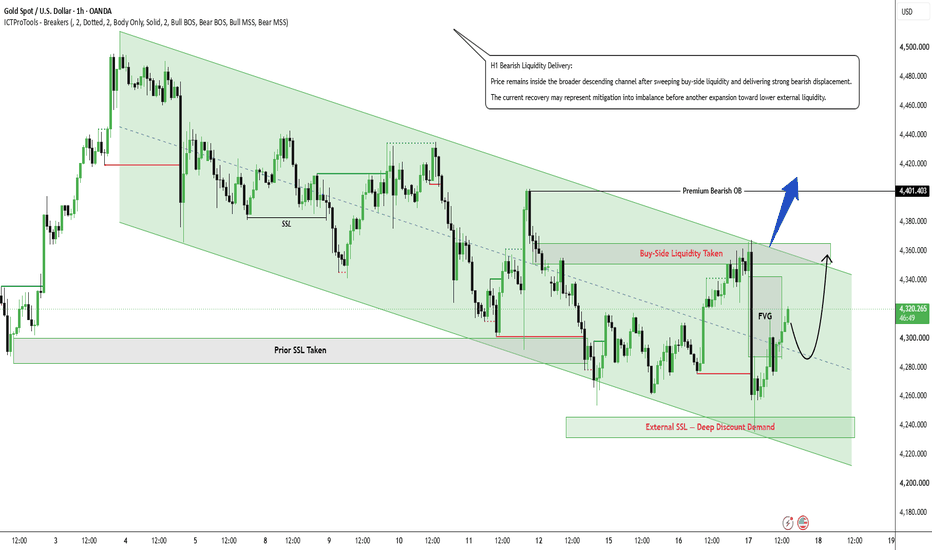
Liquidity Sweep & Bearish Pullback Setup | XAUUSD 18/09Gold is trading around 4,358, recovering strongly from the 4,250–4,260 Strong Demand zone after a period of H1 accumulation.
The latest bullish displacement reclaimed the 4,300 area and created a short-term bullish structure. However, price is now approaching the 4,365–4,380 Liquidity zone, where a reaction could determine the next intraday move.
My focus for today is not to chase the current bullish impulse. I am waiting for price to interact with Liquidity and confirm the next direction through lower-timeframe structure.
📊 H1 Market Structure
H1 accumulation developed above 4,250–4,260 Strong Demand.
Bullish displacement reclaimed the 4,300 area.
Price is approaching the 4,365–4,380 Liquidity zone.
The 4,390–4,402 H1 OB remains the next major resistance area.
The broader recovery remains bullish, but price is approaching a potential reaction zone.
📍 Key POI
Liquidity: 4,365–4,380
H1 OB: 4,390–4,402
FIBO Zone: 4,290–4,310
Secondary support: 4,275–4,285
Strong Demand: 4,250–4,260
🎯 TODAY'S TRADING PLAN
Primary Scenario — Bearish Pullback From Liquidity
My main intraday expectation is a potential rejection from the 4,365–4,380 Liquidity zone, followed by a retracement toward the FIBO Zone.
Entry area: 4,365–4,380
Confirmation required:
Price sweeps or rejects the Liquidity zone.
M5/M10 bearish MSS develops.
Clear bearish displacement confirms the rejection.
A retest of the displaced area provides the potential entry.
Stop Loss: Above 4,385, or above the confirmed rejection high.
Take Profit 1: 4,340
Take Profit 2: 4,310
Take Profit 3: 4,290
The main objective is the 4,290–4,310 FIBO Zone. If price reaches TP1, risk management should be reassessed rather than assuming the full move will continue.
Important: No entry if price reaches Liquidity without bearish confirmation.
📈 Alternative Scenario — Bullish Breakout
If H1 price accepts above 4,380 and confirms the breakout through a retest, the bearish pullback scenario becomes less relevant.
Potential entry: 4,380–4,385 after confirmed breakout and retest.
Stop Loss: Below the retest low.
Take Profit 1: 4,390
Take Profit 2: 4,402
Take Profit 3: 4,420
The 4,390–4,402 H1 OB is the first major upside reaction area. A breakout alone is not enough; I want to see acceptance above Liquidity.
⚠️ INVALIDATION
A sustained H1 acceptance below 4,250–4,260 Strong Demand would invalidate the current bullish recovery structure.
For the intraday bearish pullback scenario, a strong bullish breakout and acceptance above 4,380 would invalidate the rejection idea.
🧠 MY BIAS FOR TODAY
Bullish recovery on H1, but I expect price to test the 4,365–4,380 Liquidity zone before the next major directional move.
My preferred intraday scenario is a confirmed bearish reaction from Liquidity, followed by a pullback toward 4,310 and potentially 4,290.
If price breaks and accepts above 4,380, I will reassess the structure for continuation toward the 4,390–4,402 H1 OB.
No entry without confirmation. The levels are chart-based scenarios, not guaranteed outcomes. Short 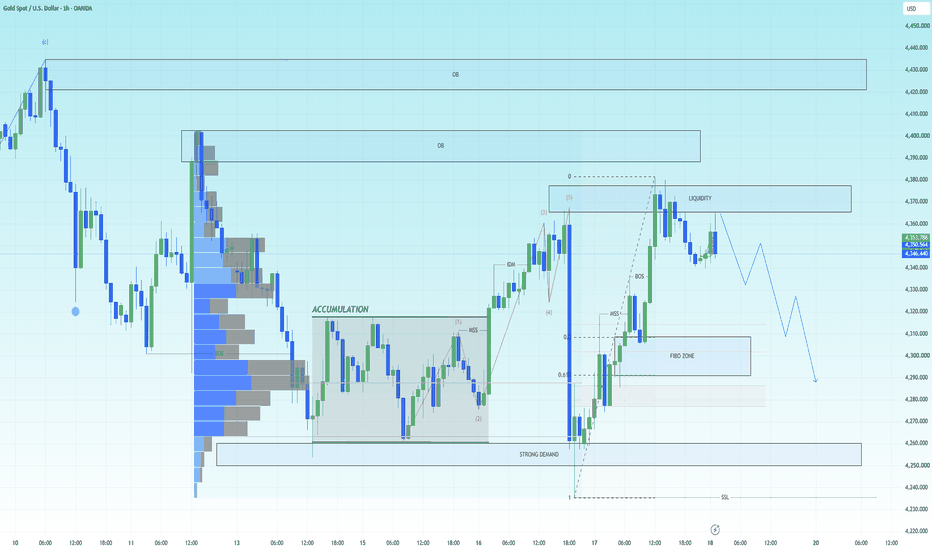
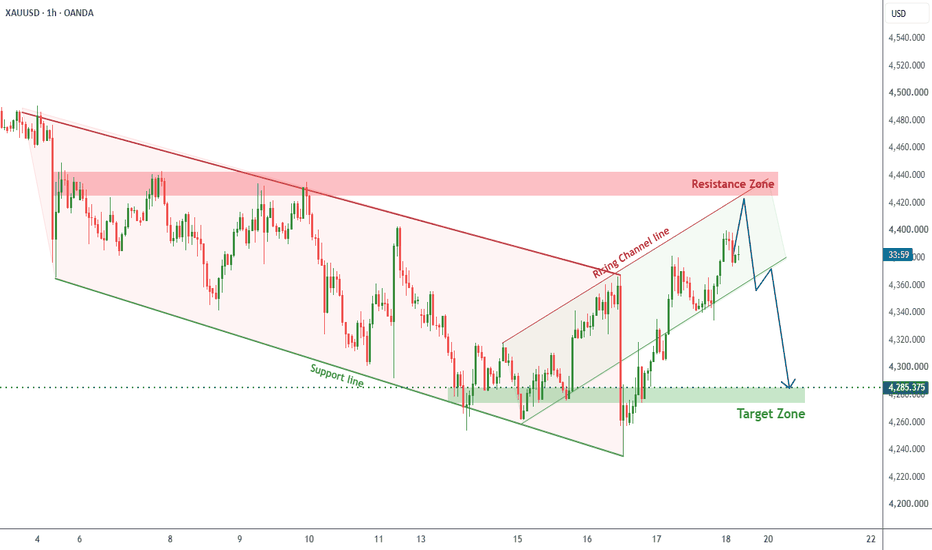
DeGRAM | XAUUSD — Retest of 4,440. Sellers may target 4,285📊 Technical Analysis
● XAUUSD is recovering inside the broader descending structure, but price is still approaching a major 4,425–4,440 resistance zone. The rising local channel can support another push higher, yet the overall structure remains vulnerable while price stays below this resistance.
● If buyers fail to break and consolidate above 4,440, a rejection from the resistance zone could send price back toward the 4,275–4,290 target zone. A sustained breakout above resistance would weaken the bearish scenario.
💡 Fundamental Analysis
● Gold has extended its rebound to a one-week high as easing oil prices reduced inflation pressure and geopolitical risks continued to support safe-haven demand. At the same time, the Fed’s latest 25 bp rate hike to 3.75%–4.00% and expectations of further tightening remain an important headwind for gold, keeping today’s recovery vulnerable to renewed dollar and yield strength.
✨ Summary
● Bearish reversal scenario remains valid below 4,425–4,440; rejection from this resistance area would favor a move toward 4,275–4,290. A confirmed breakout above resistance would invalidate the immediate downside setup.
Share your opinion in the comments and support the idea with a like. Thanks for your support! Short