Bullish bounce in play?Gold (XAU/USD) has bounced off the pivot and could potentially rise toward the 1st resistance.
Pivot: 4,290.41
1st Support: 4,210.80
1st Resistance: 4,391.74
Disclaimer:
The opinions given above constitute general market commentary and do not constitute the opinion or advice of IC Markets or any form of personal or investment advice.
Any opinions, news, research, analyses, prices, other information, or links to third-party sites contained on this website are provided on an "as-is" basis, are intended to be informative only, and are not advice, a recommendation, research, a record of our trading prices, an offer of, or solicitation for, a transaction in any financial instrument and thus should not be treated as such. The information provided does not involve any specific investment objectives, financial situation, or needs of any specific person who may receive it. Please be aware that past performance is not a reliable indicator of future performance and/or results. Past performance or forward-looking scenarios based upon the reasonable beliefs of the third-party provider are not a guarantee of future performance. Actual results may differ materially from those anticipated in forward-looking or past performance statements. IC Markets makes no representation or warranty and assumes no liability as to the accuracy or completeness of the information provided, nor any loss arising from any investment based on a recommendation, forecast, or any information supplied by any third party.  Long
Long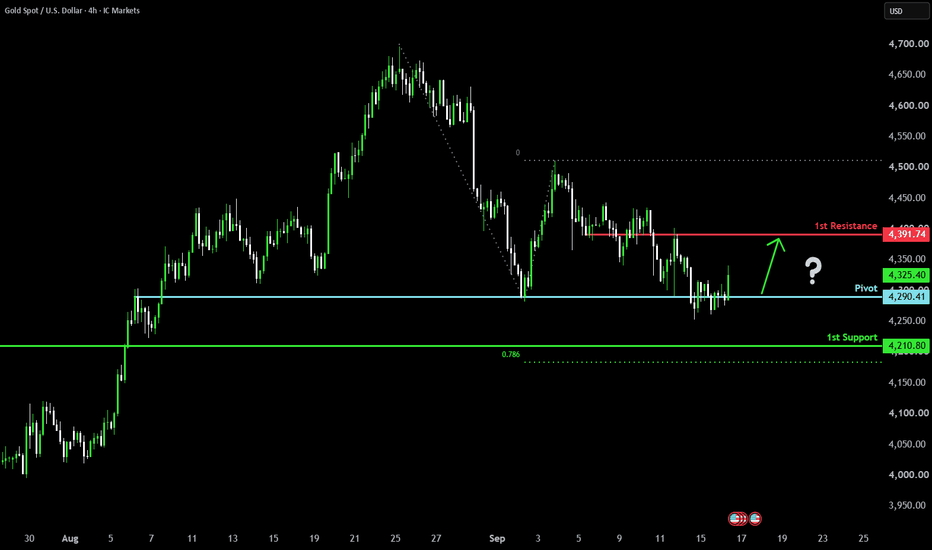
Nasdaq 100 (NQ) Analysis, Key-Zones, Setup for Wed (Sep 16)Bias: December Nasdaq-100 futures settled Tuesday at 29,246.75 after a 287.75 point session between 29,495.25 and 29,207.50, closing just 39.25 points off the low and inside the lower 14 percent of the day's range. The cash index fell about 0.65 percent against about 0.45 percent for the broad market, and that gap is the entire story. Benchmark 10-year Treasury yields topped 5 percent for the first time since 2007 while crude rose about 4 percent to trade above 105 dollars, and an index whose earnings sit far out on the duration curve is the most exposed asset available to a rising long-end discount rate. Supporting stress was visible across assets, with crude volatility up about 4 percent and bitcoin rejecting 82,000 to fall about 3 percent. The structural picture is heavy but not yet broken. Price sits below the 5-day average at 29,416.75, the 20-day at 29,621.54, the 50-day at 29,577.59 and the 100-day at 29,721.96, while holding far above the 200-day at 27,824.07, so this reads as a correction inside a longer advance rather than a completed trend change. The 14-day directional index at 14.17 with the negative directional indicator at 23.15 above the positive at 15.07 describes downward pressure without trend conviction, which is the environment where computed pivots and dealer-positioning levels govern price. The multi-indicator composite reads 64 percent sell. Dealer positioning in the exchange-traded proxy is the sharpest input: the fund closed at 705.38, beneath both its modeled gamma-flip level of 718 and its modeled volatility threshold of 712, with estimated gamma notional at negative 927 million dollars and put volume running near 1.56 times call volume. Below a modeled flip level, hedging flows tend to extend moves rather than contain them. Positioning data through September 8 showed elevated non-dealer length in Nasdaq futures with about 7.1 billion dollars net sold between September 1 and September 8, so a crowded long is being reduced into the event rather than after it. Bias is lower while beneath 29,545, with rallies into the 29,421 to 29,473 confluence the preferred area to sell, though a 25 basis point increase is already roughly 92 percent priced and the 02:00 PM ET projections, not the rate number, will write Wednesday's reaction.
Resistance:
- 29,713 Pivot R3, the outer boundary of the computed ladder and the practical ceiling for any advance that does not involve a policy surprise
- 29,604 Pivot R2, reinforced by the 20-day average at 29,621.54 and the 9-day and 18-day average crossings near 29,632, so a close above this band is the first real evidence the corrective sequence has ended
- 29,588 primary call side ceiling equivalent, translating the cash-index call-side concentration at 29,275 into futures terms at this session's measured 312.75 point basis, where dealer hedging of that concentration tends to supply into strength
- 29,541 the 40-day average crossing, the structural reference that must be reclaimed before the average stack can be read constructively again
- 29,493 2 Standard Deviation Resistance, a statistical extension boundary rather than a structural level, so a tag without a close above is a fade candidate
- 29,473 modeled volatility threshold equivalent, a modeled underlying-price level published against the cash index at 29,160 rather than an option strike, and one the cash index closed beneath
- 29,421 the primary confluence, where Pivot R1 at 29,425.50, 1 Standard Deviation Resistance at 29,420.68 and the 5-day average at 29,416.75 stack inside 9 points, the tightest overhead grouping on the board
- 29,316 Pivot Point, sitting essentially on the primary put side support base equivalent at 29,313 and forming the first meaningful shelf directly above the settle
Support:
- 29,207 Tuesday's session low, the confirmation line for continuation and only 39.25 points beneath the settle, which is what makes the weak close actionable
- 29,179 computed downside objective from the same level set that produces the pivot ladder, the first measured stop on any break
- 29,148 modeled gamma-flip equivalent, translating the cash-index modeled flip at 28,835, the threshold beneath which proxy hedging turns most destabilizing
- 29,138 Pivot S1, sitting within 11 points of the modeled flip equivalent above it, which makes 29,138 to 29,148 the single most important support decision band on the chart
- 29,107 the one-month low and the structural base of the recent monthly distribution, whose loss opens the deeper standard deviation supports at 29,072.82 and 29,000.78
- 29,029 Pivot S2, reinforced immediately below by 2 Standard Deviation Support at 29,000.78 and the 3-10 day average crossover reference at 29,001.61, making the 29,000 area a dense shelf
- 28,850 Pivot S3, the outer boundary of the computed ladder, with 3 Standard Deviation Support at 28,945.50 and the 38.2 percent retracement from the 13-week low at 28,937.99 as intermediate stops
Primary Setup: SHORT NQ from the 29,421 to 29,473 zone on a rally into the Pivot R1, one standard deviation and 5-day average confluence, with the modeled volatility threshold equivalent capping the upper edge. Stop 29,545, placed above the 40-day average crossing at 29,541.14 and the two standard deviation band at 29,492.72 so that a stop-out requires reclaiming structure rather than merely tagging an extension. Targets at 29,316 first, where the Pivot Point and the primary put side support base equivalent overlap, 29,207 second at Tuesday's session low, and 29,138 third at Pivot S1 where the modeled gamma-flip equivalent sits 10 points higher, taken only if momentum extends through the second target on expanding volume. From a 29,447 entry midpoint that is 98 points of risk against 131, 240 and 309 points of reward, roughly 1.3 to 1, 2.4 to 1 and 3.2 to 1. Half size is appropriate given the interest rate decision, the rate statement and the Summary of Economic Projections all land at 02:00 PM ET with the press conference at 02:30 PM ET, and retail sales at 08:30 AM ET is forecast at 0.8 percent against a negative 0.6 percent prior. Pricing is likely to be disorderly between 02:00 PM and 02:45 PM ET, a volatility-index expiration at 09:30 AM ET can distort early pricing, and the cash open at 09:30 AM ET sets the session's first directional test. A sustained move above 29,545, and in particular an hourly close above 29,604, negates the short thesis and opens 29,713. The mirror risk is a projection set implying a pause after this increase, which is the condition for a relief advance back through 29,473 toward 29,588.
Wednesday is a decision session rather than a trend session, and the distinction matters for how it should be traded. A market carrying compressed realized volatility at 12.40 percent on the 14-day, unspent range after a 287.75 point Tuesday against a 14-day average daily range of 351.59, and dealer positioning beneath its modeled flip level is a market configured to expand rather than to drift, and the expansion is scheduled for 02:00 PM ET.
 Short
Short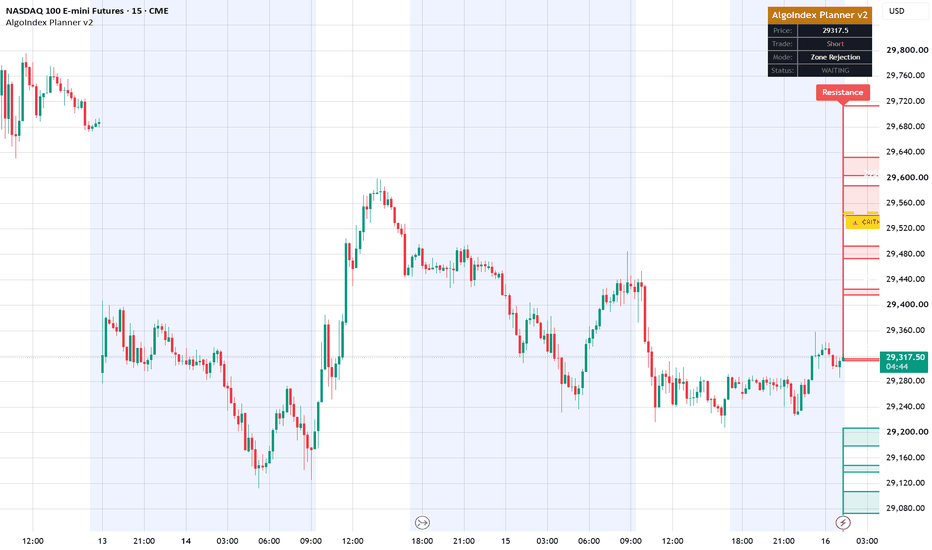
S&P 500 (ES) Analysis, Key-Zones, Setup for Wed (Sep 16)Bias: December S&P 500 futures settled Tuesday at 7,656.00 after a narrow 57.50 point session between 7,701.00 and 7,643.50, closing in the lower 22 percent of the range. The low is the fact that matters, because 7,643.50 is also the one-month low, so the contract printed a fresh monthly extreme and then failed to recover into the settle. The cash index closed at 7,586, down about 0.45 percent. The driver was the rates and energy complex rather than anything equity-specific: benchmark 10-year Treasury yields topped 5 percent for the first time since 2007 while crude rose about 4 percent to trade above 105 dollars. The broad index absorbed that better than the Nasdaq did, which is the expected ordering when the shock runs through the discount rate, and it shows in the relative structure, since this contract still holds above its 100-day average at 7,626.08 while its technology counterpart has already lost that reference. Positioning is the destabilizing input. The contract settled 47.35 points beneath the modeled gamma-flip level published for it at 7,703.35, and beneath that threshold dealer hedging extends moves rather than absorbing them. The zero-dated positive gamma pocket that stabilized Tuesday afternoon expired at the close, so that cushion is gone. Estimated gamma notional on the exchange-traded fund is negative 1.715 billion dollars with a gamma tilt of 0.607, and the fund closed at 758.05, beneath its own modeled flip level of 765 and beneath its primary put side support base of 760. Against all of that sits a genuinely stretched oscillator set, with the 14-day stochastic percent K at 12.51 and the 20-day at 11.35, readings from which relief rallies typically begin. The multi-indicator composite is only 16 percent sell, far less committed than the Nasdaq's, so this is a market that is stretched rather than trending. Bias is lower while beneath 7,727, with a retest of the 7,700 to 7,705 band the preferred area to sell, since Tuesday's high at 7,701.00 and the modeled flip at 7,703.35 sit within 2.35 points of each other. A 25 basis point increase is already roughly 92 percent priced, so the 02:00 PM ET projections and guidance, not the rate number, will write Wednesday's direction.
Resistance:
- 7,747.67 (SPX 7,678) Pivot R3, the outer boundary of the computed ladder and the practical ceiling for any session that does not involve a policy surprise
- 7,725.35 (SPX 7,655) modeled volatility threshold, a modeled underlying-price level published by the positioning source as of Tuesday's close rather than an option strike, sitting almost exactly on the second pivot
- 7,724.33 (SPX 7,654) Pivot R2, reinforced by the 40-day average crossing at 7,724.40 and the 9-day crossing at 7,726.06, which makes 7,724 to 7,726 the firmest overhead shelf
- 7,706.66 (SPX 7,637) 3 Standard Deviation Resistance, a statistical extension boundary where a tag without a close above is a fade candidate
- 7,703.35 (SPX 7,633) modeled gamma-flip level, the threshold above which dealer hedging stabilizes and below which it amplifies, sitting just 2.35 points above Tuesday's session high and forming the decisive line for Wednesday
- 7,690.17 (SPX 7,620) Pivot R1, with 1 Standard Deviation Resistance at 7,685.25 just beneath it, making 7,685 to 7,690 the first real supply band above the settle
- 7,681.15 (SPX 7,611) the 5-day average, the nearest overhead average and the first test any recovery attempt faces
- 7,666.83 (SPX 7,597) Pivot Point, only 10.83 points above the settle, so the session opens essentially at its pivot
Support:
- 7,650.78 (SPX 7,581) computed downside objective from the same level set that produces the pivot ladder
- 7,645.50 (SPX 7,576) the 50 percent retracement of the 13-week span, two points above Tuesday's low and the upper edge of the pivotal shelf
- 7,643.50 (SPX 7,574) Tuesday's session low and the one-month low, the most important level on the board, and its cash equivalent lands on the implied one-day move low that held through Tuesday's session
- 7,632.67 (SPX 7,563) Pivot S1, the first computed level beneath the monthly low
- 7,626.75 (SPX 7,557) 1 Standard Deviation Support carrying the 100-day average at 7,626.08, the structural line whose sustained loss would mark this as more than a pullback
- 7,614.63 (SPX 7,545) 2 Standard Deviation Support, reinforced by the 40-day average stall reference at 7,613.50
- 7,609.33 (SPX 7,539) Pivot S2, with 3 Standard Deviation Support at 7,605.34 immediately beneath it
- 7,575.17 (SPX 7,505) Pivot S3, effectively coincident with the primary put side support base published at 7,570.35, making 7,570 to 7,575 the deepest structural objective in view
Primary Setup: SHORT ES from the 7,700 to 7,705 zone on a retest of Tuesday's session high, where the modeled gamma-flip level at 7,703.35 sits 2.35 points above that high and gives an unusually precise place to define risk. Stop 7,727, above both Pivot R2 at 7,724.33 and the modeled volatility threshold at 7,725.35, so that a stop-out requires reclaiming the stabilizing side of the positioning structure rather than merely tagging it. Targets at 7,666.83 first, the computed Pivot Point, 7,643.50 second at Tuesday's session low and one-month low, and 7,626.75 third where 1 Standard Deviation Support carries the 100-day average at 7,626.08, taken only if momentum extends through the second target on expanding volume. From a 7,702.50 entry midpoint that is 24.50 points of risk against 35.67, 59.00 and 75.75 points of reward, roughly 1.5 to 1, 2.4 to 1 and 3.1 to 1. Half size is appropriate given that the interest rate decision, the rate statement and the Summary of Economic Projections all land at 02:00 PM ET with the press conference at 02:30 PM ET, and retail sales at 08:30 AM ET is forecast at 0.8 percent against a negative 0.6 percent prior. Pricing is likely to be disorderly between 02:00 PM and 02:45 PM ET, a volatility-index expiration at 09:30 AM ET can distort early pricing, and the cash open at 09:30 AM ET sets the session's first directional test. A sustained move above 7,727, and in particular an hourly close above the 7,741 to 7,748 band where the 20-day average and Pivot R3 sit, negates the thesis. The standing counter-argument is the oscillator set, since a 14-day stochastic percent K of 12.51 at a one-month low is the configuration from which relief rallies start, which is why this is defined at a specific confluence rather than sold into weakness.
Wednesday is a decision session rather than a trend session. At-the-money implied volatility on the cash index for Wednesday is 19.0 percent, implying roughly 119 basis points of movement, about 90 points on the cash index at Tuesday's close, which is materially wider than the 14-day average true range of 66.49 points. That is the options market stating plainly that it expects an outsized session, and the expansion is scheduled for 02:00 PM ET.
 Short
Short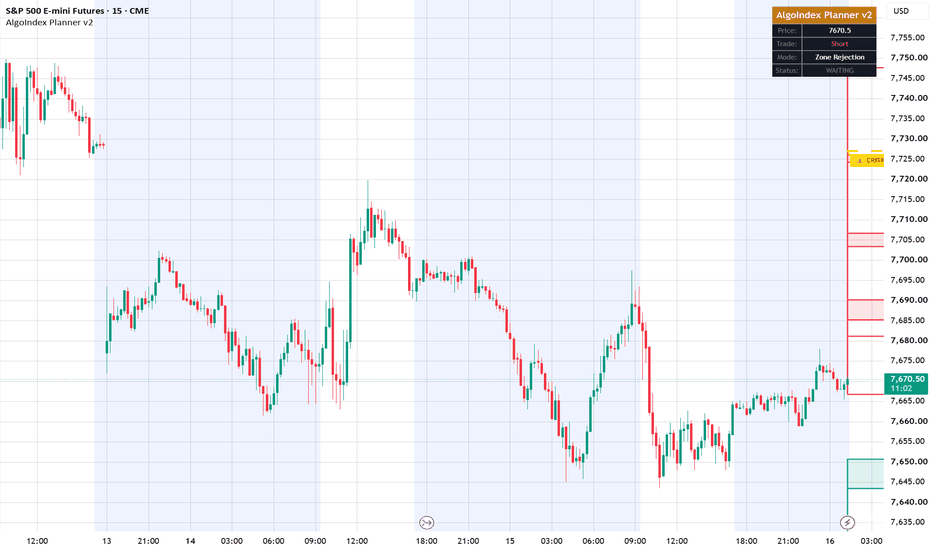
Gold Attempts to Rise; Bearish Bias Remains IntactGold prices (XAU/USD) OANDA:XAUUSD rebounded from daily support near the US$4,275 level, attracting minor buying interest ("buying the dip") during the Asian trading session on Wednesday, September 16, 2026. The precious metal's rebound was triggered by the US Dollar (USD) pausing after hitting a two-week high.
However, the market is trading within a compressed range ahead of tonight's Federal Reserve (Fed) interest rate announcement, amidst a surge in US bond yields past the psychological 5% threshold and the threat of a military counter-attack by the Saudi-led coalition in the Gulf.
--------------------------------------------------------------------------------------------------------------
✅ US Monetary Policy & Bond Records: Tonight's FOMC Meeting (+25 bps) & US 10-Year Yield Breaks 5%
Global fund managers are focusing intently on tonight's interest rate announcement from Washington:
- ⚡Fed Interest Rate Announcement Tonight (+25 bps): The Federal Open Market Committee (FOMC) is scheduled to announce its interest rate policy decision early Thursday (WIB). The market has priced in a consensus for a 25-basis-point (bps) hike in the benchmark interest rate.
- ⚡US 10-Year Bond Yield Surpasses 5% (2007 Record): A surge in public and corporate borrowing, combined with risks of energy-driven inflation, has pushed the US 10-year government bond yield above the 5% threshold for the first time since 2023, reaching its highest level since 2007.
--------------------------------------------------------------------------------------------------------------
✅ Price Action Analysis (H4 Timeframe)
The current H4 structure indicates a phase of Bearish Consolidation / Double Bottom Rebound. The decline from the "Lower High" peak at the 4,510.994 green line swept liquidity below the gray box's floor, touching a low of 4,253.635, before a buyer-driven rebound pushed the price back above the 4,282.582 green line.
At the 4,322.165 price level, the most recent H4 candle shows strong bullish momentum—characterized by a large-bodied green candle (bullish engulfing)—bouncing sharply from the 4,280.000 range. This buying pressure has pushed the price toward the lower boundary of the local "Supply Zone" (gray box) in the 4,360.000–4,400.000 range.
--------------------------------------------------------------------------------------------------------------
✅ Key Zones:
- ⚡Resistance / Supply Zone (SBR): The range around the 4,436.704 green line (upper boundary of the gray box / nearest SBR & HVN area) and the 4,510.994 green line ("Lower High" peak / Major Supply Zone).
- ⚡Support / Demand Zone: The range around the 4,282.582 green line (nearest local support floor where the rebound occurred) and the 4,176.692 green line (lowest Major Demand Zone level).
--------------------------------------------------------------------------------------------------------------
✅ Elliott Wave Analysis
Mapping wave cycle movements on the H4 timeframe:
- ⚡Wave Structure:
The sharp decline from the 4,695.642 peak to the 4,282.000 area is calculated as Sub-Wave A (or Wave 1). The upward bounce that stalled at the 4,510.994 green line is identified as the formation of Sub-Wave B (a micro zigzag correction).
- ⚡Current Status:
The decline from 4,510.994, which swept below the 4,253.635 low, is calculated as part of the completion of the Sub-Wave C leg (or micro Wave 3). The impulsive green rebound from 4,282.582 to 4,322.165 currently represents the initial formation of a relief rally or upward correction (micro Sub-Wave 4 or a new Wave B).
- ⚡Projection:
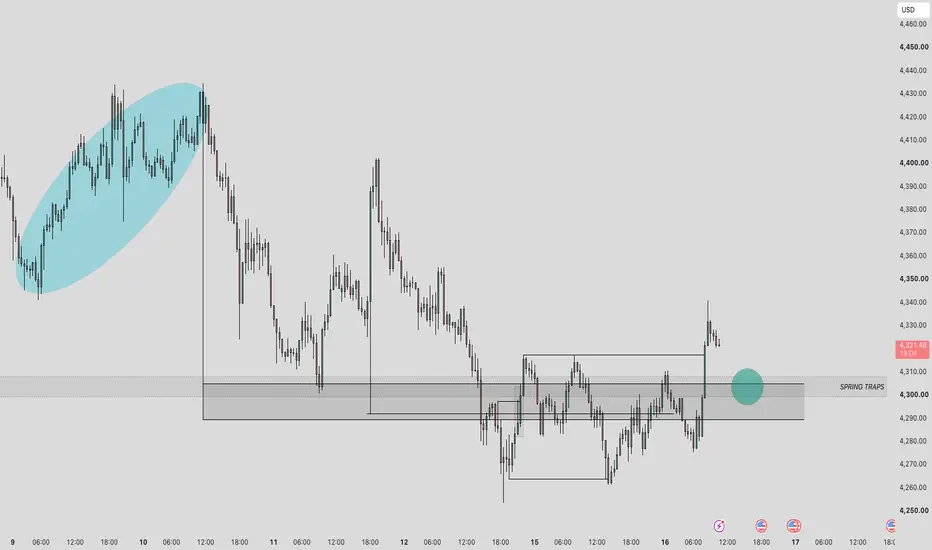
Price action is projected to complete this impulsive rebound by testing the SBR/HVN area within the 4,390.000 – 4,436.704 range, before potentially triggering a bearish rejection for the subsequent downward wave. Gold Breaks Higher After Spring Trap Reaction on 30MGold Breaks Above Consolidation After Spring Trap Reaction
Gold has produced a strong bullish expansion from the 4,280–4,290 region, breaking above the recent consolidation and reclaiming the important 4,290–4,305 Spring Trap zone. The sharp displacement toward 4,330 shows a clear change in short-term momentum after several sessions of sideways movement around the lows.
The broader structure had remained bearish following the decline from the 4,430 region, but repeated reactions around 4,260–4,290 showed sellers struggling to sustain continuation. The latest breakout above 4,305–4,315 is therefore an important structural development.
Speculative Outlook
The main focus is now on whether Gold can hold the 4,290–4,305 Spring Trap area as support if price retraces. A controlled pullback followed by renewed bullish confirmation could keep the recovery active, initially bringing 4,340–4,350 into focus.
If bullish momentum continues beyond that region, the recovery could gradually extend toward the previous structural areas around 4,360–4,400.
However, a strong return below 4,290 would weaken the breakout and bring the recent range lows back into consideration.
For now, the Spring Trap reaction followed by bullish displacement is the key development—the next test is whether buyers can protect the reclaimed structure. Long 
XAUUSD — Mitigation Sell Before FOMC
Market Context
Gold is trading near $4,293 after extending deeper into the lower half of the H1 descending channel. Price continues to print lower highs beneath HTF dynamic supply, keeping short-term order flow bearish despite the latest corrective rebounds.
Macro conditions remain restrictive for Gold ahead of the September 15–16 FOMC meeting. Markets are heavily positioned for a 25 bp Fed hike, while the U.S. dollar is near a two-week high and the 10-year Treasury yield has moved above 5%. At the same time, renewed Middle East tensions have pushed Brent crude above $106, reinforcing inflation concerns and supporting higher-rate expectations.
SMC View
H1 structure remains bearish inside the descending delivery channel. Price has repeatedly failed to sustain recovery above the internal structure, while the latest MSS keeps lower sell-side liquidity exposed.
The immediate $4,308–$4,325 Mitigation POI is the most important decision area. A corrective retracement into this zone could rebalance the latest downside displacement before sellers attempt another continuation lower.
The current price is already close to discount, so chasing shorts near $4,290 offers weaker positioning. The cleaner setup is a mitigation rally followed by fresh bearish confirmation.
Main Trading Scenario
Sell Priority: $4,308–$4,325
Condition: Wait for price to retrace into the Mitigation POI and show bearish rejection, failed acceptance above the zone, or a lower-timeframe bearish MSS/CHOCH.
Entry: $4,308–$4,325 after confirmation
SL: Above $4,340 and the rejection structure
TP1: $4,270–$4,280
TP2: $4,250–$4,260
TP3: $4,220–$4,235
Key Zones to Watch
$4,400.899 — Premium Bearish OB
$4,308–$4,325 — Main Mitigation POI
$4,255–$4,270 — Discount POI
$4,220–$4,235 — Deep SSL Objective
$4,280 area — Nearby sell-side liquidity
Above $4,340 — Immediate bearish setup weakens
Prime Gold View
The sell bias remains favored while XAUUSD stays beneath the Mitigation POI and continues respecting the H1 descending channel.
A confirmed rejection from $4,308–$4,325 could reopen delivery toward the Discount POI and eventually the $4,220–$4,235 Deep SSL Objective. With the Fed decision approaching and rate-hike expectations already elevated, volatility may increase sharply, so confirmation remains more important than anticipating the move.
No confirmation, no trade. Short 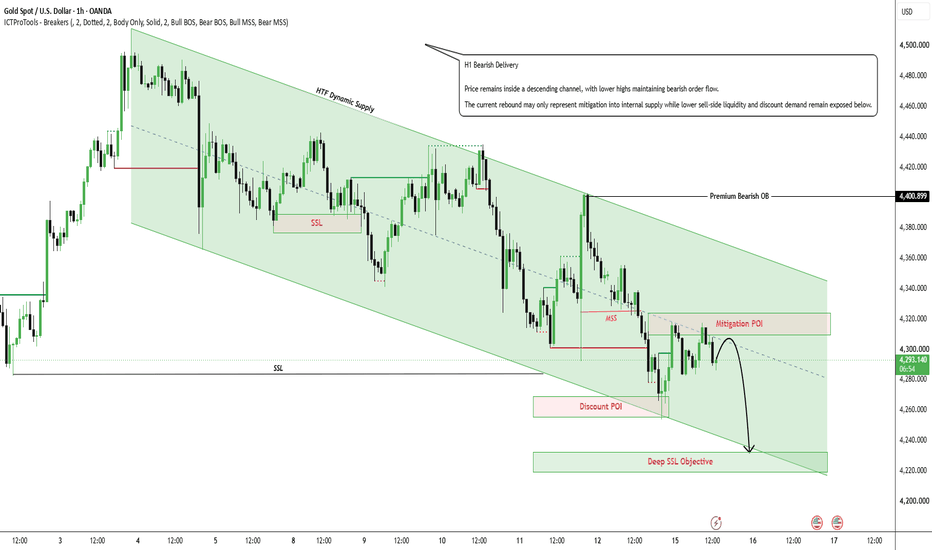
Market Imbalances | Educational AnalysisUnderstanding Market Imbalances | Educational Analysis
Market imbalances are an important concept in technical analysis because they help explain how price can move rapidly through a particular range and leave behind an inefficient area in the market structure
An imbalance can develop when aggressive buying or selling creates a fast directional movement with relatively limited trading activity between certain price levels The resulting gap or inefficient zone can later become an area of interest as price returns to test or rebalance that structure
This chart presents a visual framework for understanding how market imbalances can appear in different conditions The examples include upward and downward imbalances and demonstrate the relationship between an impulsive price movement, the formation of an imbalance, a possible revisit, and potential continuation
One important point is that an imbalance should not automatically be interpreted as an entry signal The presence of an imbalance alone does not determine what price will do next Price may revisit the zone, partially fill it, move completely through it, or continue without returning to it
The first part of the chart compares balanced and imbalanced market conditions In a balanced environment, price generally moves with more interaction between buyers and sellers During an aggressive move, however, price can travel quickly through a range and leave an inefficient structure behind
The chart also separates upward and downward imbalances An upward imbalance can develop during strong bullish movement, while a downward imbalance can develop during strong bearish movement These structures can be useful for studying how price behaves after periods of aggressive directional expansion
Another important aspect is understanding why imbalances form Fast price movement, liquidity being taken, limited trading activity, and aggressive order execution can contribute to inefficient price movement These factors do not guarantee that an imbalance will later be filled, but they can help explain why certain zones become relevant during subsequent price action
The revisit process is particularly important from an analytical perspective After an imbalance has formed, traders can observe whether price eventually returns toward the zone and how the market reacts when it reaches that region The reaction can provide additional information about the current structure and momentum
Common examples of imbalance-related structures include Fair Value Gaps, liquidity gaps, breakaway gaps, and session gaps Each structure can develop under different market conditions, so they should not be treated as identical formations Context, timeframe, volatility, and surrounding price structure should always be considered when studying them
A useful analytical approach is to first identify the imbalance, then observe the broader market structure, wait for price to interact with the relevant zone, and evaluate the reaction rather than assuming the outcome in advance This keeps the analysis focused on market behavior instead of relying on a single pattern
The key lesson from this chart is that an imbalance is best viewed as a zone of interest within market structure, not as a guaranteed destination or automatic trading opportunity The market can rebalance an inefficient area and continue its previous direction, but it can also invalidate the expected reaction
Risk management is equally important when applying technical analysis No chart pattern or market structure provides certainty, and unexpected volatility can cause price to behave differently from the initial analysis Any trading decision should therefore consider appropriate risk control, position sizing, timeframe, and overall market conditions
This publication is intended strictly for educational and analytical purposes It is not investment advice, a solicitation, or a recommendation to buy or sell any financial instrument The purpose is to explain the concept of market imbalances and encourage structured observation of price behavior
Study the structure, understand the imbalance, observe the reaction, and let the market provide confirmation rather than assuming the outcome in advance Education 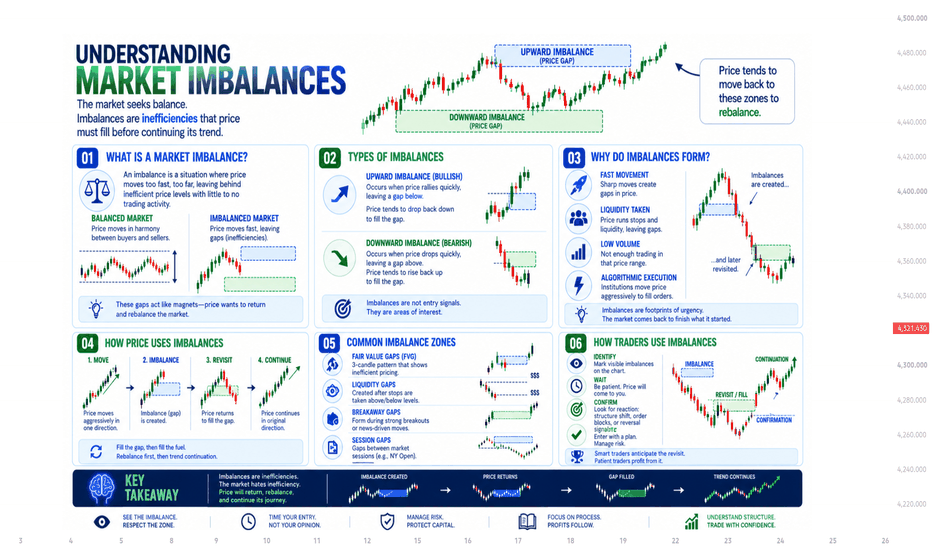
Long 
Silver 4H: a window that opened and shut in two daysEleven bars ago this layer opened a zone on silver. It is already closed.
This is silver on the four-hour with our accumulation layer on it. The panel reads NO ACCUMULATION and the counter says eleven bars - so the mark that printed on the thirteenth opened a window, price went back above the reference, and the window shut. Two days, start to finish.
What the mark means. Accumulate does not mark a bottom. It prints when price drops below the layer's reference line, and it says one thing: you have entered an area where a structural low is being built. While price trades under the reference, the window is open. When the panel reads NO ACCUMULATION, it has shut - price has been accepted above the line again.
Compare that with July, on this same chart. Three marks between the eighth and the twenty-seventh, from around fifty-eight down to fifty-five. The shaded area under the reference shows what the layer was describing for most of a month: price below its own line, the second mark lower than the first, the third higher again. That zone stayed open for weeks. What followed it was a move to the low seventies - which is the part everybody screenshots, and the least useful part of the chart.
This one is different in the only way that matters: it is short. A zone that opens and shuts inside two days is not a smaller version of July. It is the layer saying the condition appeared and then stopped being true, quickly. Whether that means the pullback is finished or merely paused is not something this layer answers.
Where we are now. Price is at 64.55, the reference at 63.39 and rising. The window is shut, so as of this bar the layer has no opinion on silver. If price is accepted below the line again, a new mark prints and the window reopens - and the panel will say so without being asked.
What it does not tell you. Whether 63.39 holds. Whether the eleven-bar zone was the low or an interruption. And nothing about the volume reading, which is low - worth knowing, not a signal by itself.
One caveat, always. The July zone here was followed by a strong move. We show it because it makes the contrast legible - a month-long window against a two-day one - not because either outcome is typical. Zones are followed by nothing often enough that one chart proves the mechanism and nothing else.
Educational market commentary - not financial advice. GOLD: Gold Price Forecast for September 15📰 Fundamental News and Gold Price Action
The USD and US Treasury yields are rising, putting pressure on Gold.
US CPI data continues to indicate persistent inflation, leading the market to expect the Fed to maintain a cautious monetary policy stance.
The FOMC meeting on September 16 is the most important upcoming event and could trigger significant volatility in XAUUSD.
Although geopolitical tensions continue to support safe-haven demand, pressure from the USD and Treasury yields remains dominant for now.
=> Short-term fundamental outlook: Bearish bias on Gold.
---
📊 H1 Chart Analysis – Key Levels and EMAs
🔴 Key SELL Zone: 4,350–4,365
I consider this the most attractive Sell zone on the current chart because:
* This is a supply zone that has triggered multiple price reactions.
* The EMA34, EMA50, and bearish market structure are converging around this area.
* Price continues to form Lower Highs on the chart.
If price retraces to 4,350–4,365 but fails to break above this zone, it is highly likely to be just a pullback before another bearish move.
Notably, this zone is also consistent with the 4,350–4,368 supply area that several recent H1 analyses are monitoring.
=> This remains my preferred SELL zone.
🔴 Closer SELL Zone: 4,325–4,335
Price is currently trading around 4,306, just below this zone. The problem is that the distance is relatively small.
If price retraces toward:
4,325 → 4,335
and an H1 or M15 rejection candle forms, this could present an opportunity for a short-term Sell trade.
However, I consider this zone less attractive than 4,350–4,365 because:
* The entry is close to the current price, increasing the risk of being stopped out by a liquidity sweep.
* The risk-to-reward ratio may not be favorable if the stop-loss is placed above 4,350.
Some market analyses also identify 4,325–4,335 as an important short-term support/resistance zone.
⚪ Zone: 4,265–4,250
This zone is currently not safe for an immediate Buy or Sell entry.
Reason:
Price has already made a strong bearish move into this area before bouncing.
If price continues to decline toward this zone, we should not immediately BUY simply because price reaches the level.
It would be better to wait for:
* A liquidity sweep of the lows;
* A strong rejection wick;
* A bullish engulfing candle;
* Or an M15/H1 market structure shift toward a **Higher Low**.
If confirmation appears, a Buy scalp could be considered.
If an H1 candle closes below 4,255–4,260, this gray zone would be invalidated, potentially opening the door to a deeper bearish move.
---
📝 Summary
The H1 structure remains Bearish, characterized by Lower Highs and Lower Lows.
The upward move from 4,260–4,280 currently appears to be a technical retracement rather than a confirmed trend reversal.
The preferred strategy is to wait for price to retrace into resistance before looking for SELL entries, rather than chasing Sell positions at the lows.
BUY setups should only be considered if price breaks through key resistance levels and forms a Higher High + Higher Low structure.
=> H1 Bias: Bearish — Prefer SELL on pullbacks.
Short 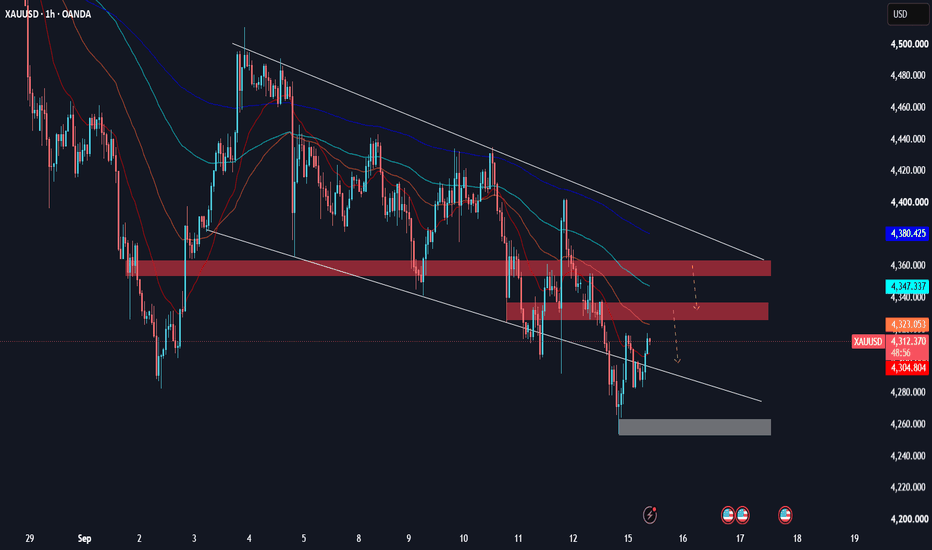
XAU/USD (GOLD) — DETAILED SMC ANALYSIS | SELL BIAS🔷 MARKET OVERVIEW
Gold has been in a clear bearish structure over the past few sessions, dropping sharply from the highs near 4,400 down toward the 4,260 region, before staging a sharp bullish reaction into a key premium zone. This move appears to be a liquidity engineering play rather than a genuine trend reversal — price is being drawn up into supply before a potential continuation lower.
🟢 1. BUY SIDE LIQUIDITY (Upper Level – ~4,400)
The highest liquidity pool sits above the initial swing high near 4,400. This is where resting buy stops and breakout orders accumulated after the initial impulsive rally. Price has not returned to tap this level yet, meaning it remains a magnet for future upside wicks, but it's not the immediate zone of interest for this setup.
🟢 2. BUY SIDE LIQUIDITY (Lower Level – ~4,360)
A secondary, more relevant liquidity pool formed just below the first major pullback high. This zone was swept more recently as price pushed up into the BPR, confirming that smart money used this liquidity to fund the reversal down.
🟫 3. BPR (BALANCE PRICE RANGE) — ~4,320–4,340
This is the most critical zone on the chart. The BPR represents a fair-value/imbalance overlap where two opposing order flow deliveries intersect, creating a "balanced" price region. Price has just tapped into the lower boundary of this BPR, and it's acting as a strong resistance/rejection zone. A rejection from here would confirm institutional selling interest.
🔺 4. MARKET STRUCTURE SHIFT (MSS)
A clean bullish MSS occurred on the internal structure around the 4,300–4,320 region, breaking the prior lower-high. This shift signaled the temporary change in short-term order flow from bearish to bullish — fueling the sharp rally into premium. However, this MSS is viewed as a corrective/liquidity-grab move within a larger bearish context, not a full trend reversal.
🟠 5. PREMIUM ZONE
Marked directly above the current price action (~4,320–4,345), the Premium Zone represents the "expensive" area of the current dealing range — where price is statistically overextended relative to equilibrium. This is the ideal zone for institutional sellers to step in, aligning perfectly with the BPR and the recent liquidity sweep.
🟢 6. DISCOUNT ZONE
Located below equilibrium (~4,280–4,300), the Discount Zone marks the "cheap" area of the range where buyers previously stepped in. This is the primary draw on liquidity for this bearish setup — price is expected to travel from premium back down into this discount region.
⬛ 7. ORDER BLOCK (Demand OB – ~4,260–4,280)
A well-defined bullish order block sits near the sell-side liquidity sweep low. This is the origin of the last major bullish leg and represents unmitigated institutional buying interest. If price reaches this deep, it's the strongest zone for potential long-term demand.
⬛ 8. IMPULSION OB (~4,280–4,295)
A smaller, more recent order block formed just before the impulsive rally into premium. This "impulsion" block is significant because it's the last footprint of aggressive buying before the breakout move — making it a high-probability intermediate target/reaction zone on the way down.
🔴 9. SELL SIDE LIQUIDITY (~4,260)
Resting sell stops accumulated below the recent swing low. This pool was already swept once, fueling the bullish impulse move. It remains a key reference level — if price breaks back below the Order Block, this liquidity could be revisited/extended further downside.
🎯 TRADE THESIS
Price has swept lower-level buy-side liquidity and tapped directly into the BPR/Premium Zone confluence — a textbook institutional sell zone. Expecting rejection from here, targeting a return through the Discount Zone and into the Impulsion OB / Order Block region.
📍 Entry: 4334.30
🛑 SL: 4345.50
🎯 TP1: 4325 | TP2: 4317 | TP3: 4308.50 | TP4 (Final): 4300
⚠️ Idea shared for educational/analytical purposes only. Not financial advice — trade at your own risk and manage position sizing accordingly. Short 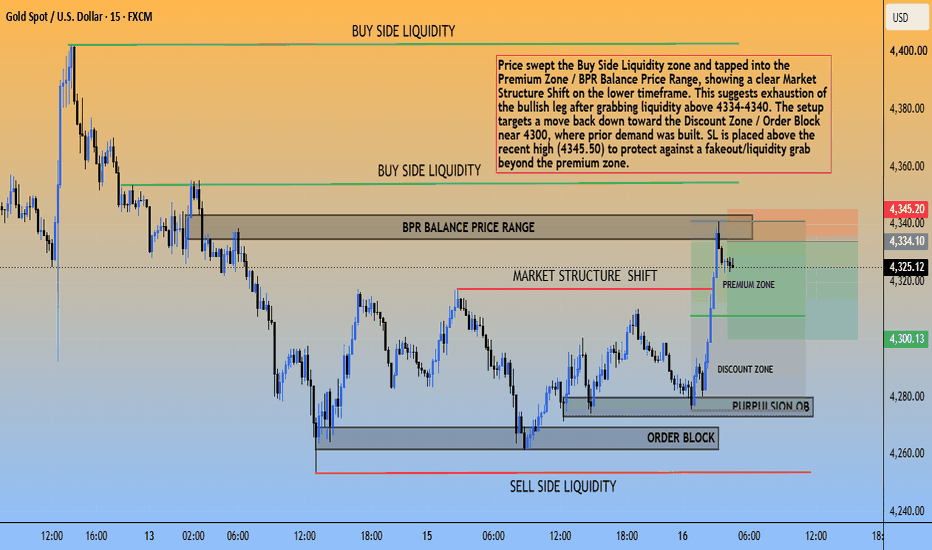
Gold 4H: back at the line July left behindThree marks in July, a sixteen percent move away from them, and this week price came all the way back to the line they left behind.
This is gold on the four-hour with our accumulation layer on it. The layer printed three times in July - once in the first week, twice more in the last ten days of the month - each time just above four thousand. Between those marks the shaded area shows what the layer was describing: price sitting under its reference, going nowhere in particular, for most of a month.
What the mark means. Accumulate does not mark a bottom. It prints when price drops below the layer's reference line, and it says one thing: you have entered an area where a structural low is being built. While price trades under the reference, the window is open. When the panel reads NO ACCUMULATION, it has shut.
It shut in early August. Price accepted above the reference and left - and over the following three weeks gold ran to the high four-six-hundreds. That is roughly sixteen percent from where the marks printed, and it is also the least interesting part of this chart, because every screenshot on the internet ends there.
What happened next is the part worth having. From the August high, gold has spent a month coming back down. This week it reached 4,256.89 - the reference line, now rising, exactly where the layer left it - and so far has held above, trading at 4,324.
That is a test, not a verdict. The reference is not support. The layer draws it to define where the zone was; it does not defend it. What a return to the reference actually means is narrower and more useful: the question the layer asked in July is back on the table. If price accepts below this line again, a new window opens and the panel will say so. If it does not, the layer stays quiet - as it has for 197 bars.
What it will not tell you. Whether 4,256 holds. Whether a new mark is coming. And not what happens on the release either way - the volume reading on the panel is low, which is worth knowing and is not a signal of anything by itself.
One caveat, always. This chart is one where the zone was followed by a strong move. We show it because it is a clean illustration of how a zone opens, shuts and gets revisited - not because that outcome is typical. Zones are followed by nothing at all often enough that any single chart proves the mechanism and nothing more.
Educational market commentary - not financial advice. XAUUSD 1H: Gold Recovers From SupportGold is trading around 4,327 on the 1-hour chart after showing a recovery from the lower price area.
The chart highlights two important levels:
- Support: 4,261.360
- Resistance: 4,403.030
Market Structure
Price has recently moved upward from the support region, creating a short-term recovery. However, the broader market remains between the marked support and resistance levels.
If buying interest continues, price may retest the resistance area. A rejection could lead to another pullback, while a sustained move above resistance would require confirmation from subsequent price action.
Key Points
Support: 4,261.360
Resistance: 4,403.030
Timeframe: 1H
This analysis is based on the displayed chart structure and is for educational purposes only. It is not financial advice. Market conditions can change, and no price movement is guaranteed. Long 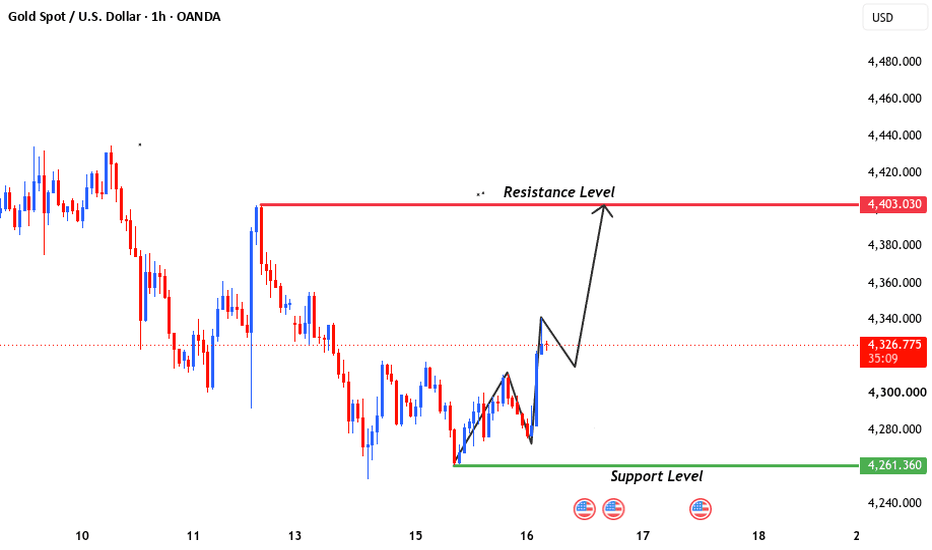
SilentEntry GOLD Daily Outlook - 16 September 2026 | XAUUSD | H1Gold has produced a strong H1 recovery from the 4260–4280 Major Support / Defence region, pushing back through 4290–4310 First Support and into our 4310–4328 Decision Area.
At the time of analysis, Gold is trading around 4324.
The immediate H1 momentum has improved significantly, but the broader D1/H4 structure remains corrective. Price is now approaching an important cluster of overhead resistance, meaning this is not an ideal location to chase the bullish move.
📊 Market Structure
D1: 🔴 Bearish / Corrective
H4: 🟠 Bearish / Recovery
H1: 🟢 Bullish Recovery / Resistance Test
The key question now is whether the current move can establish acceptance above 4328–4340, or whether sellers return as Gold enters resistance.
🗺️ Daily Mapper
Major Resistance: 4340–4355
Near Resistance: 4328–4340
Decision Area: 4310–4328
First Support: 4290–4310
Major Support / Defence: 4260–4280
Bullish Recovery Invalidation: Below 4260
Deeper Bearish Target: 4230–4250
🟢 Bullish Scenario
Gold has already recovered strongly from 4260–4280.
For continuation, we want to see the 4310–4328 Decision Area hold, followed by H1 acceptance through 4328–4340.
If confirmed:
🎯 TP1: 4340–4355
🎯 TP2: 4380–4400
🎯 TP3: 4415–4430
A clean H1 break above 4340, followed by a successful retest, would strengthen the bullish continuation case.
Acceptance above 4355 would represent a more meaningful improvement in the H1/H4 recovery structure.
🔴 Bearish Scenario
The 4328–4355 region is our main area to watch for fresh sellers.
If Gold enters this area but fails to establish acceptance and subsequently loses 4310, the morning rally could begin looking more like a liquidity run into supply.
Potential downside path:
🎯 TP1: 4290–4310
🎯 TP2: 4260–4280
🎯 TP3: 4230–4250
If 4230 eventually breaks with H1 acceptance, deeper downside toward approximately 4190–4215 could become exposed.
The cleaner bearish confirmation would therefore be:
4328–4355 rejection → lose 4310 → lose 4290.
💧 Liquidity Watch
The morning rally has taken liquidity above several of yesterday's H1 highs around 4310–4320.
Now we need to determine whether that liquidity grab produces continuation or rejection.
Break 4340 + hold/retest above 4328
→ 🟢 Bullish acceptance.
Sweep 4340–4355 + fall back below 4328/4310
→ 🔴 Potential buy-side liquidity sweep.
Likewise, any pullback into 4290–4310 should be watched closely. If buyers defend it, the zone could become the foundation for another attempt at resistance.
🟡 CURRENT CALL — WAIT
Gold has already made a sharp recovery from the 4270s into the 4320s.
We are now approaching resistance after the move, rather than sitting at an attractive support entry.
Do not chase the green candles.
Let price show us what happens around:
4328–4355.
Above 4355 → 🟢 recovery strengthens
Hold 4290–4310 → 🟢 buyers remain active
Below 4290 → 🟠 recovery weakens
Below 4260 → 🔴 recovery invalidated
With major U.S. monetary-policy risk later in the session, false breakouts and liquidity sweeps remain possible.
🥷 SilentEntry — Precision Entries, Smart Risk
⚠️ Educational analysis only. Market levels and targets are not guaranteed. Wait for confirmation and always manage risk. XAUUSD — 4H Bearish Structure | Bullish Pullback Into 4H PoiFOREXCOM:XAUUSD is currently presenting an interesting multi-timeframe setup where the 4H structure remains bearish, while the 15M has shifted bullish.
At first glance, seeing bullish price action on the 15M could make the market appear bullish. However, in this setup, I am treating the 15M bullish movement as the pullback phase within the broader 4H bearish structure. The 4H has already established bearish structure, and the current objective remains to the downside.
What I am now watching is whether the bullish 15M movement can continue higher into the marked 4H POI.
The market is already showing signs of a Bullish Retracement on the lower timeframe. The 15M has established bullish structure, which gives me a reason to expect the pullback to continue rather than assuming price must immediately resume the 4H downside. This bullish movement is important because I want price to retrace into the 4H POI before looking for the next bearish continuation.
The POI represents the area where I expect price to potentially interact with the higher-timeframe bearish structure. So I am not looking to sell simply because the 4H is bearish.
I want price to first complete the pullback into the appropriate 4H area of interest.
Another important component of this setup is LIQUIDITY.
As price approaches the 4H POI, I am expecting the market to potentially take liquidity around the highs before reversing. This is why the path drawn on the chart shows a bullish movement into the upper area rather than an immediate drop.
The idea is:
Bullish pullback → reach 4H POI → take liquidity → bearish reaction → continuation lower.
The liquidity sweep itself would not be enough for execution. I would still want to see the appropriate bearish confirmation after price reaches the POI.
That distinction is important.
🎯 Downside Objective
If price reaches the 4H POI, takes the relevant liquidity, and then produces bearish confirmation, the expectation is for the 4H bearish structure to continue. The marked 4H Sell-Side Liquidity below becomes an important downside objective.
Therefore, the setup is not simply:
“Gold is going up.”
The bullish movement is being viewed as a pullback with a purpose. The broader narrative remains bearish until the 4H structure proves otherwise.
🧠 DAIFX TIMEFRAME HIERARCHY
This setup is another good example of why different timeframes can tell different stories at the same time.
4H
Bearish structure.
This establishes the broader directional context and downside objective.
15M
Bullish structure
This represents the current pullback and gives us information about the path price may take toward the 4H POI.
4H POI
Area of interest
This is where I want price to reach before looking for the next bearish move.
Liquidity
Potential confirmation area
Price may take liquidity around the highs before the bearish continuation.
Execution
Wait for bearish confirmation
I don't sell simply because price reaches the POI. I want the market to demonstrate that sellers are actually taking control.
🎓 DAIFX MARKET LESSON
A bullish lower timeframe does not automatically mean the higher timeframe has turned bullish. The 15M can be bullish while the 4H remains bearish.
In this case, the 15M bullish structure is helping price complete a 4H pullback.
This is why timeframe hierarchy matters.
4H gives the broader structure.
15M shows the current movement.
The POI gives the location.
Liquidity provides context.
Confirmation gives the entry.
So instead of asking: “Is Gold bullish or bearish?”
I ask: “Which timeframe is bullish, which timeframe is bearish, and what is each timeframe trying to accomplish?”
Right now, the answer is: The 15M is bullish because price is pulling back. The 4H remains bearish because the broader structure is still pointing lower.
Don't confuse the pullback with the reversal. Long 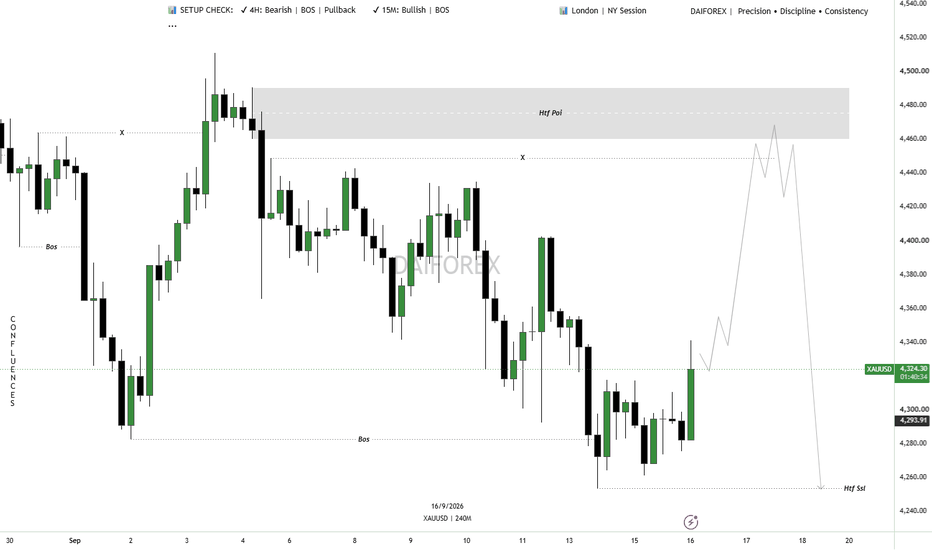
Short 
 Long
Long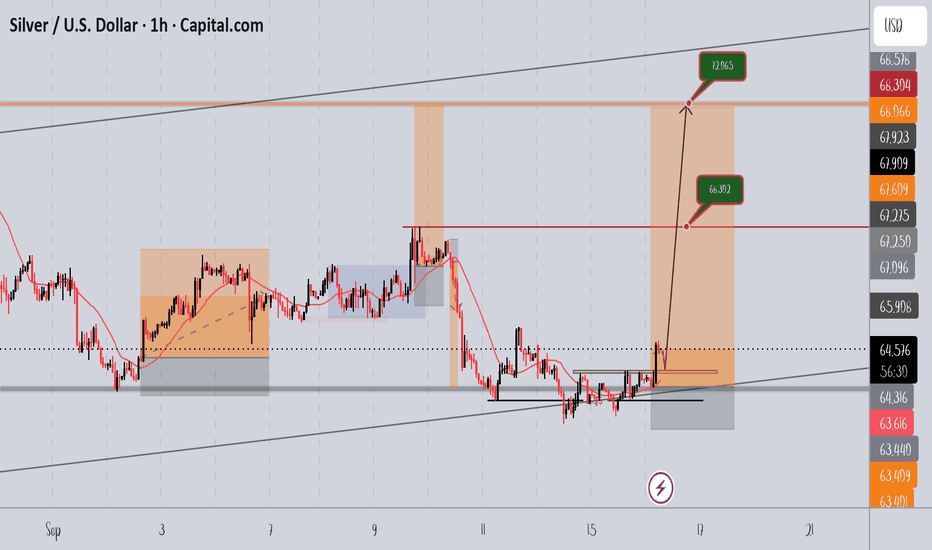
XAUUSD — 4,257 Hold or 4,214 Sweep?
Gold is trading around 4,273 after extending the M30 decline below yesterday’s reaction support.
Price remains under the descending trendline, while the latest recovery attempt failed to create a meaningful structure shift.
Macro pressure is also still heavy ahead of the Fed decision, with elevated yields, a firm dollar and higher oil prices keeping Gold under pressure.
But price is now moving closer to the lower reaction zones.
And this is where chasing the sell becomes less attractive.
The reaction is the signal.
The simple read
M30 structure remains bearish below the descending trendline.
The latest bounce reached the 4,31x area but failed below the major resistance zone around 4,319.
Price has now moved back below the 0.618 Fibonacci level near 4,277 and is approaching the 0.786 area around 4,267.
The first important support sits around 4,253–4,257.
This area combines the previous swing low, Fib completion and visible reaction demand.
A clean buyer response here could create a temporary recovery.
But support is not an automatic buy.
If 4,257 fails, the chart leaves room for a deeper liquidity sweep toward 4,214.
That lower zone aligns closely with the 1.618 Fibonacci extension and is the stronger downside reaction area on this M30 structure.
On the upside, 4,285 is the first small recovery test.
The bigger level is still 4,319.
This area combines resistance with the descending trendline and remains the key seller decision zone.
Key price zones
Current price area: 4,273
Immediate Fibonacci reaction: 4,267–4,277
Main support / buy reaction zone: 4,253–4,257
Deeper liquidity zone: around 4,214
First recovery resistance: around 4,285
Main resistance + trendline: around 4,319
Major upper supply: around 4,398
Trading plan
Buy reaction scenario
If Gold reaches 4,253–4,257:
I will watch for sellers to lose momentum and buyers to show a clear reaction.
A confirmed recovery can first reopen 4,277–4,285.
If price then breaks the descending trendline, 4,319 becomes the next important test.
But I will not buy simply because price touches support.
Sell reaction scenario
If Gold recovers toward 4,285 or especially 4,319 and rejects:
The bearish M30 structure can remain intact.
A failed recovery may send price back toward 4,257.
Breakout scenario
If Gold breaks the trendline and can hold above 4,319:
The short-term structure changes significantly.
That would improve the recovery case and shift attention toward the higher resistance zones.
Breakdown scenario
If 4,257 cannot hold:
I would watch for the deeper liquidity move rather than chase the breakdown.
The next major reaction zone becomes 4,214.
A sweep into that area followed by a strong reclaim could create a much cleaner recovery structure.
The trend is still bearish.
But price is getting closer to support.
4,257 is the first buyer test.
4,214 is the deeper liquidity test.
4,319 is the real recovery confirmation level. Long 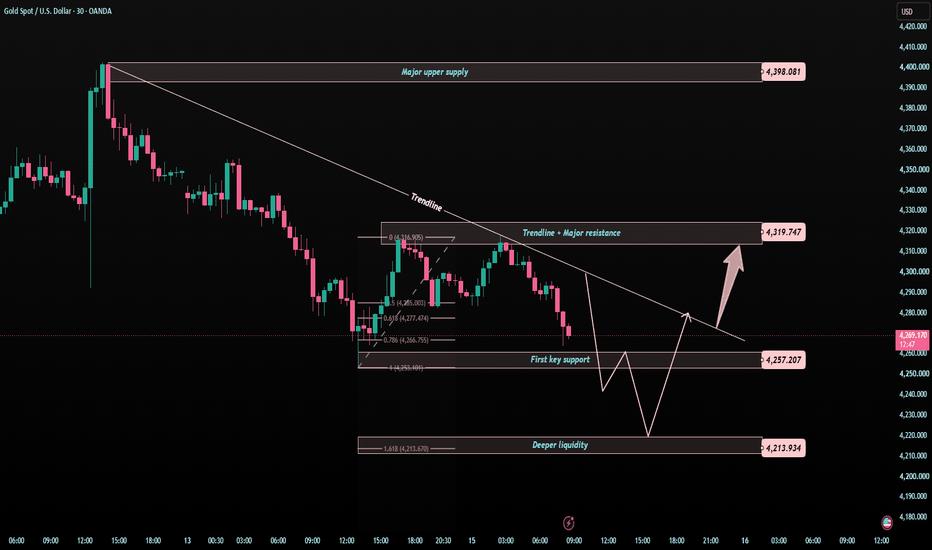
XAUUSD - Bullish Continuation Setup and Further Upside Expansion🔍 Market Overview
Gold continues to maintain a positive bullish structure on the daily timeframe after recovering strongly from the 4,120–4,198 support zone. The previous rally pushed price toward higher levels, while the current correction has not yet broken the broader bullish structure.
As long as buyers continue to defend the marked support zone and the higher-low structure remains intact, the overall trend continues to favor further upside expansion in XAUUSD.
📈 Market Structure Analysis
Market Trend: Bullish
Momentum: Corrective / Consolidating
Current Phase: Bullish Continuation
The price structure shows that Gold broke away from the lower consolidation area with strong bullish momentum. The recent decline is bringing price lower, but for now, it still appears to be a pullback within the broader uptrend rather than a confirmed bearish reversal.
Price remaining comfortably above the main support zone suggests that buyers still have the advantage. A clear bullish reaction from the current structure could trigger the next upside expansion.
🚀 Trading Scenario
✅ Bullish Scenario
Main trend conditions:
Price continues to hold above the 4,120–4,198 support zone.
The higher-low structure remains intact.
Selling pressure begins to weaken during the correction.
Price regains bullish momentum after the pullback.
Trading Plan:
Look for buying opportunities after a confirmed bullish reaction rather than chasing price while the correction is still developing. A recovery of the short-term bullish structure would provide stronger confirmation for trend continuation.
🎯 Target 1: 4,612
🎯 Target 2: 4,755
❌ Bullish Invalidation Conditions
Price decisively breaks below the main support zone.
A daily candle closes strongly below 4,120.
Market structure begins forming lower lows.
The correction develops into a strong bearish expansion.
A confirmed breakdown below the support zone would significantly weaken the current bullish setup and could open the door for a deeper correction.
🎯 Key Support Zone: 4,120–4,198
📍 Key Levels to Watch
🟢 Nearest Resistance: 4,612
🟢 Main Target: 4,755
🔴 Nearest Support: 4,198
🔴 Key Support: 4,120
⚠️ Trading View
The overall structure remains bullish while XAUUSD holds above the key demand zone. The current decline may simply represent a corrective and reaccumulation phase before buyers attempt to regain control.
If price stabilizes and bullish momentum returns, 4,612 becomes the first upside target. A convincing breakout above this area could extend the move toward 4,755.
However, losing the 4,120–4,198 support zone would materially change the structure and require a reassessment of the bullish scenario.
🧠 Expert View
The current setup is supported by:
Strong recovery from the main support zone.
The higher-timeframe bullish structure remains intact.
Price has not returned below the previous breakout area.
The current decline still has the characteristics of a pullback.
The potential for another higher low remains intact.
Clear upside targets at 4,612 and 4,755.
Preferred approach: Avoid trying to catch the exact bottom and avoid chasing price. Wait for the market to show that buyers are genuinely returning before considering positions in the direction of the broader trend.
🛡️ Risk Management
Risk only 1–2% of trading capital per position.
Define the invalidation level before entering.
Place stop losses according to the relevant support structure.
Do not increase position size simply because price continues to correct.
Wait for price-action confirmation rather than relying purely on prediction.
If the support structure fails, respect the market signal and reassess the bias.
Disclaimer: This analysis is provided for educational purposes and to share a market perspective only. It should not be considered financial or investment advice. Long 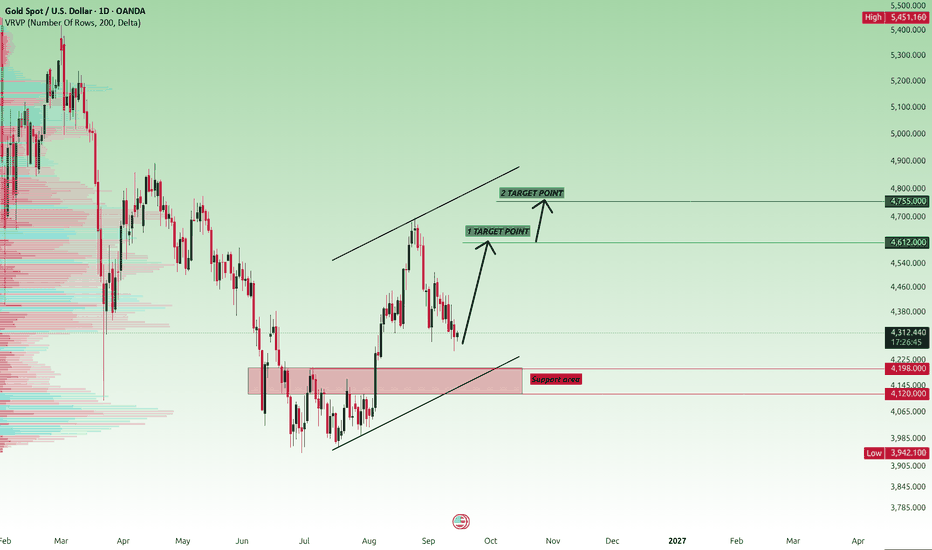
GOLD XAUUSD — Bullish Reversal Setup | Key Resistance Breakout XAUUSD is showing a potential bullish reversal after defending the 4,270–4,290 support zone. Price has reclaimed the 4,300 area, with momentum now approaching the 4,340–4,360 resistance zone.
Bullish confirmation: sustained breakout above 4,340–4,360, followed by a break of 4,380–4,400.
Key upside areas: 4,420 and potentially 4,470.
Invalidation/weakness: loss of 4,270 support.
⚠️ Levels are based on the structure visible in this chart and should be confirmed with price action and risk management. Long 
Short 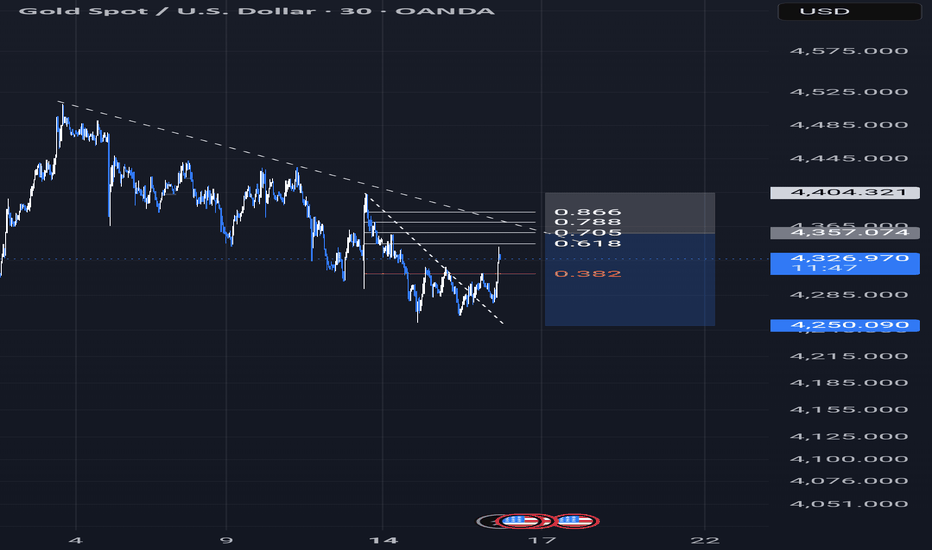
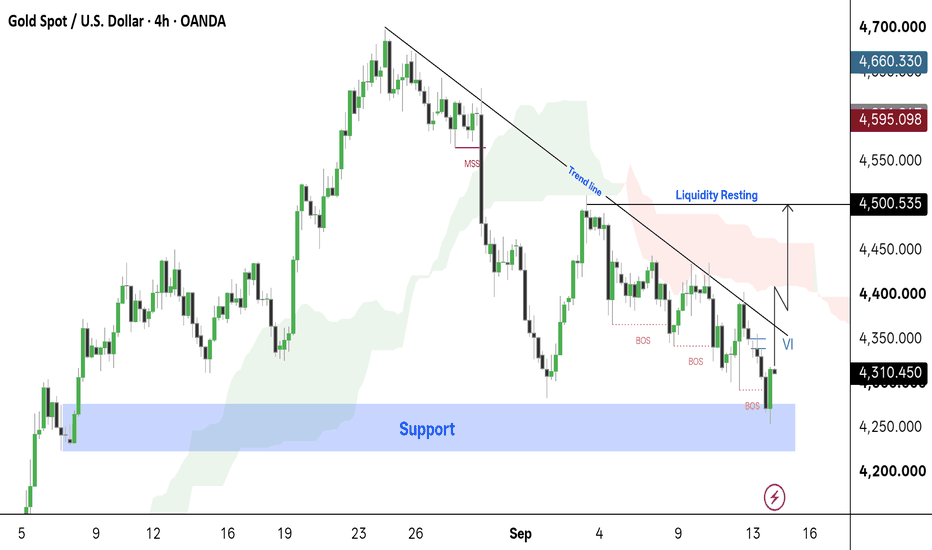
Gold 4H — Support & Liquidity SetupGold is currently trading near a strong support zone around 4,200–4,250. Price remains below the descending trend line, showing short-term bearish pressure.
A BOS (Break of Structure) has occurred, while liquidity is resting around 4,500. If price holds the support and breaks above the trend line, we could see a move toward the 4,500 liquidity area.
Key levels:
• Support: 4,200–4,250
• Liquidity: ~4,500
• Trend-line breakout = potential bullish move
• Below support = further downside risk Long