Long
Long
Crude Oil SMC Analysis | Demand Zones & Market StructureWTI Crude Oil (USOIL) 4H — SMC & Price Action Analysis
WTI is currently trading around 103.25, with the chart showing a strong bullish structure from the 80.70 demand area toward the recent 106.55 weak high.
🔹 Market Structure
Price established a sequence of higher highs and higher lows, supported by multiple BOS (Break of Structure) confirmations. The bullish displacement from the lower demand zones shows strong buying interest.
The latest move pushed price toward 106.55, which is marked as a Weak High / Buy-Side Liquidity area. The recent reaction from this level suggests that a short-term retracement is possible, but confirmation is required before assuming a reversal.
🔻 Potential Retracement
If sellers gain control after a rejection from 106.55, the marked levels become important downside reference points:
106.55 → 100.55 → 95.48 → 91.07
These are potential support/liquidity areas shown on the chart, not guaranteed targets.
🟦 Key Demand Zones
100.55: Immediate support / demand area
91.07: Higher-timeframe demand
80.70: Major demand and structural support
75.00: Lower higher-timeframe demand
72.00: Strong Low / major liquidity reference
📌 Candle Confirmation
The candles near 106.55 should be monitored for rejection, displacement, MSS or ChoCH. A single bearish candle is not enough confirmation for a reversal.
If price instead breaks and holds above 106.55, the bearish retracement scenario becomes less relevant and traders should reassess the structure using the new highs and retests.
⚠️ Trading Plan
Wait for liquidity + market-structure confirmation + candle close before entering. Define stop-loss and risk in advance, and avoid chasing extended moves.
Educational analysis only — not financial advice. Trade with proper risk management.  Short
Short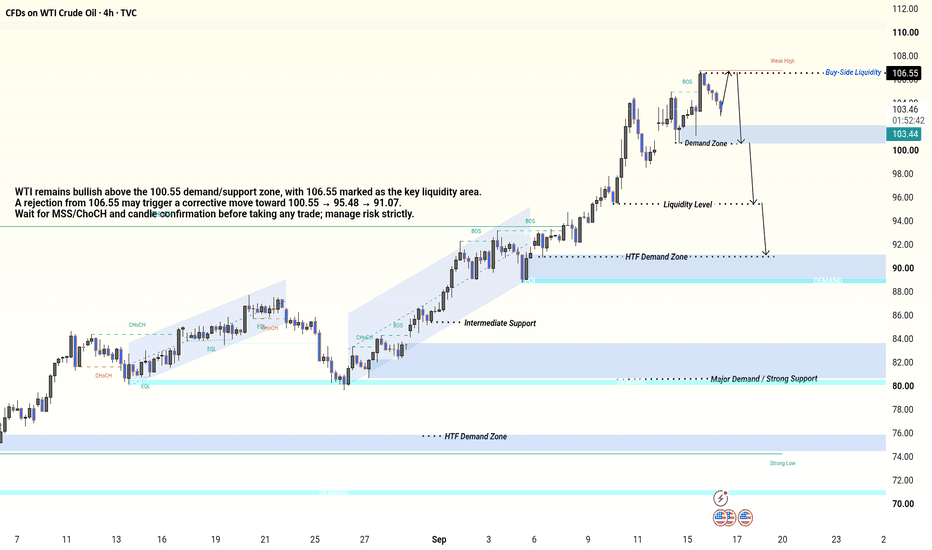
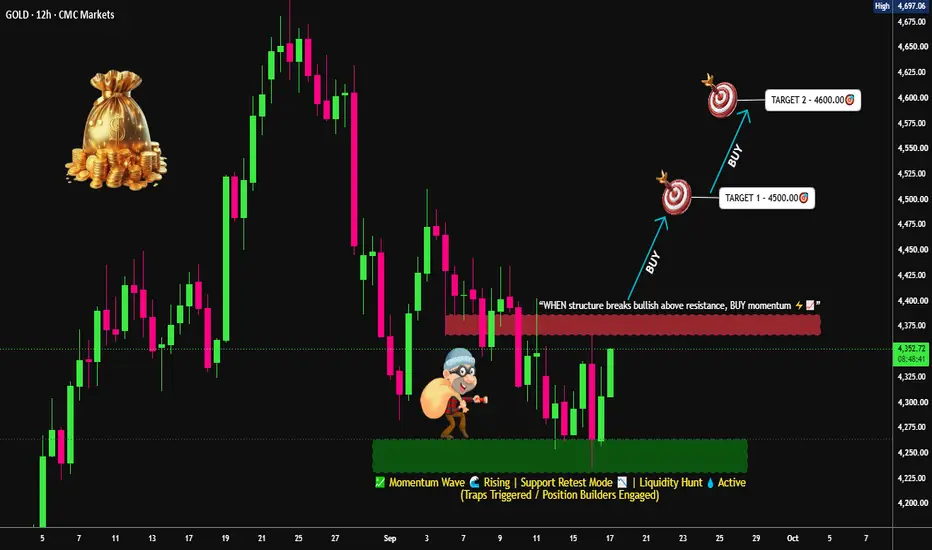
GOLD: 4,375 Breakout vs Rejection — Levels Traders Are Watching🎯 XAU/USD “THE GOLD” — Metals Market Trade Opportunity Guide 🏆
Day / Swing Trade Blueprint · Thief OG’s Edition
📌 TITLE: XAU/USD Gold — Thief Plan: EMA 50 Confirm + Breakout Setup 🚀
━━━━━━━━━━━━━━━━━━━━━━━━━━━━━━
👋 Dear Ladies & Gentlemen (Thief OG’s),
Let’s break this down clean. My analysis here is built on structure, momentum, and market behavior — not hopium. The gold market is moving through a sensitive zone after the Fed’s hawkish surprise, and I want to walk you through MY market bias and the levels I am watching.
━━━━━━━━━━━━━━━━━━━━━━━━━━━━━━
📊 MY ANALYSIS — XAU/USD Daily Structure
Gold is currently trading near the $4,285–$4,300 region after a sharp Fed-driven selloff that briefly flushed price down toward the $4,230 zone. The recovery off that wick tells me buyers are not dead — they are defending. My analysis focuses on the EMA 50 on the daily timeframe as the directional filter. As long as price holds below the EMA 50 and the $4,375 resistance zone, the daily structure remains capped. A confirmed breakout ABOVE $4,375.00 would flip my bias bullish and open the door to the targets below.
🔍 MY MARKET BIAS: Bullish ONLY above $4,375 breakout confirmation. Below that, I stay patient and neutral.
━━━━━━━━━━━━━━━━━━━━━━━━━━━━━━
🎯 POSSIBLE SCENARIO — The Thief Plan 🥷
This is the plan IF the breakout confirms:
💰 Thief Entry: AFTER the resistance breakout @ $4,375.00
✅ Thief Target 1 @ $4,500.00
✅ Thief Target 2 @ $4,600.00
🧠 Why $4,600? Because the moving average acts as a strong resistance overhead. When you combine that with overbought conditions, a potential trap, and reversal pressure in that zone — that’s where I escape with profits. Take the bag and run.
🛑 Thief Stop Loss @ $4,300.00
⚠️ Note: Dear Ladies & Gentlemen (Thief OG’s) — I’m NOT recommending you set only my SL or only my TP. It’s your own choice. You can make money then take money at your own risk. Manage YOUR position, YOUR way.
━━━━━━━━━━━━━━━━━━━━━━━━━━━━━━
📚 EDUCATIONAL BREAKDOWN — Why This Matters
The EMA 50 on the daily acts as a trend filter. When price is below it, rallies are suspect. When price breaks and HOLDS above it, the game changes.
🔑 Breakout + Retest = Higher Probability. Don’t chase the first candle. Wait for the retest. That’s where the real edge lives.
🔑 Liquidity Sweeps: Watch for a quick fakeout above $4,350–$4,375 that traps breakout buyers before reversing. That’s the “trap” I mentioned.
🔑 Volume Confirmation: A breakout without volume is a trap waiting to happen.
━━━━━━━━━━━━━━━━━━━━━━━━━━━━━━
💱 RELATED PAIRS TO WATCH — Correlation Map
🪙 $XAG/USD (Silver): Silver mirrors gold closely. Currently trading around $63+ area. If silver leads higher, gold follows. Divergence = warning sign.
💵 TVC:DXY (US Dollar Index): The DIRECT inverse correlation to gold. DXY pushed back above 100 after the Fed hike. If DXY cools off, gold gets room to breathe. If DXY rips higher, gold stays pressured.
📉 TVC:US10Y (US 10-Year Treasury Yield): Yields above 5% are a headwind for gold. Higher yields = stronger dollar = pressure on metals. Watch this.
🛢️ TVC:USOIL (Crude Oil): Energy prices feed into inflation expectations. Higher oil = inflation stays hot = Fed stays hawkish = pressure on gold. Oil easing = potential relief for gold.
━━━━━━━━━━━━━━━━━━━━━━━━━━━━━━
🌍 LIVE MARKET UPDATE — Fundamentals Driving Gold Right Now
🚨 THE BIG ONE: The Federal Reserve raised rates by 25bps to 3.75%–4.00% on September 16 — the FIRST hike since 2023. This is the Kevin Warsh era. The dot plot shows 16 of 18 officials expect AT LEAST ONE MORE hike before year-end.
💵 Dollar Strength: DXY back above 100. 10Y yields back above 5%. Both are headwinds for gold.
📈 Gold’s Reaction: Spot gold dipped to the $4,230 zone post-Fed, then bounced back to $4,285–$4,310 range. Buyers are stepping in at demand, but the bounce lacks conviction so far.
📊 Today’s Data (Sept 17): US Initial Jobless Claims came in at 206.5K vs 206K forecast. Philadelphia Fed Index dropped to 32.1 vs 47.4 prior — a big miss. Housing starts beat at 1.32M. Mixed data = choppy price action.
📅 UPCOMING CATALYSTS:
🔹 Bank of Japan decision — Sept 18: Expected to hike. Global tightening = pressure on gold.
🔹 Bank of England decision — Sept 17: Held at 3.75%. Vote split 6-3. Watch for hawkish signals.
🔹 Fed Speakers next week: Markets will hang on every word for rate path clues.
🔹 Geopolitical: US-Iran tensions ongoing. Any escalation = safe-haven bid for gold.
━━━━━━━━━━━━━━━━━━━━━━━━━━━━━━
🥷 THIEF TRADER STYLE WISHES & MOTIVATION
“The market doesn’t care about your feelings. It cares about your preparation.”
— Thief OG Wisdom
“Patience is not passive. It’s the sniper waiting for the shot.”
“Take the setup, not the emotion. The chart gives, the chart takes. Respect it.”
“Profit is made when you exit, not when you enter. Know your escape route.”
“Stay sharp, Thief OG’s. The gold game rewards the disciplined, not the desperate.”
━━━━━━━━━━━━━━━━━━━━━━━━━━━━━━
📌 FINAL VERDICT
My market bias: Cautiously bullish ONLY above $4,375 breakout. Below = patience mode.
The Fed is hawkish. The dollar is firm. Gold is in a delicate spot.
Trade the plan. Manage the risk. Take the bag.
Stay stealthy, Thief OG’s. XAU/USD | Current targetsAfter last week's CPI, Gold went as low as 4292 before going back up and reaching 4402 level and then dropped once more, currently being traded at around 4328 level.
I expect Gold to drop at first and sweep the minor sellside liquidity below the 4292 level and then sweep the liquidity below the 4282 level, which means it'll drop inside the Inversion Fair Value Gap (IFVG). I then expect Gold to reach the Bullish OB and bounce back up. However, it is not out of the question for Gold to sweep the SSL and bounce back up from there, meaning it'll not touch the IFVG Consequent Encroachment and bounces back up from there.
Targets: 4340, 4355, 4370, 4385 and 4400
However, if Gold fails to bounce back up from either the IFVG C.E. or the Bullish OB, further drop towards the 4223 level can happen, to sweep the sellside liquidity that is there. Long 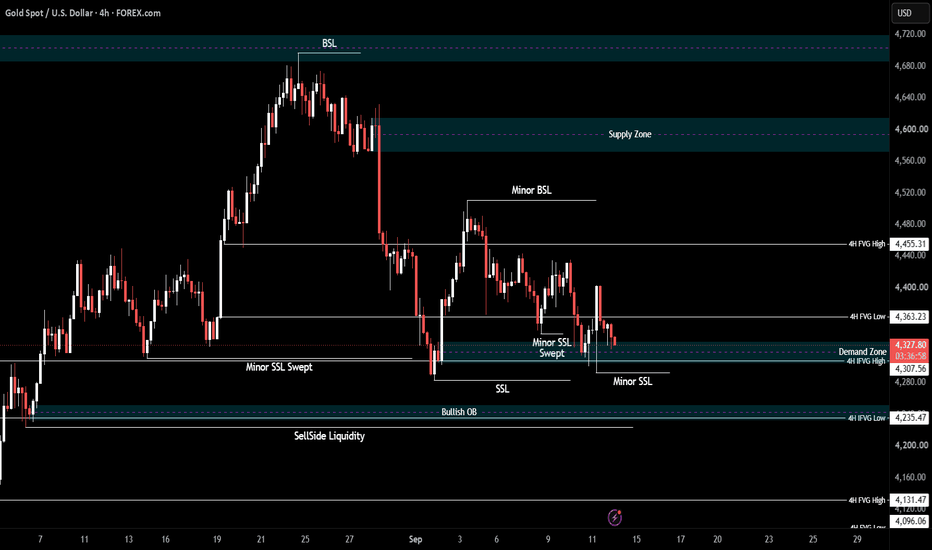
BRIAN XAUUSD – GOLD HOLDS VALUE BEFORE NEXT MOVE BRIAN XAUUSD – GOLD HOLDS VALUE BEFORE NEXT MOVE
Gold is still trading inside a sensitive value area after the recent recovery attempt from the lower structure.
The macro background remains mixed. Gold recently received support from weaker oil prices and softer US Treasury yields, which reduced some upside pressure on the US dollar. However, the Fed’s September policy stance remains restrictive, and that keeps the market careful. When gold is supported by weaker yields but still capped by Fed uncertainty, price often moves inside value before choosing the next clean direction.
That is exactly what the chart is showing now.
Gold is not breaking strongly higher yet, but sellers have also not managed to push price back into a deeper bearish continuation. The current structure is a decision zone.
Technical structure
On the H3 chart, gold is trading around 4,390 - 4,400 after recovering from the recent downside channel.
The first important zone is the POC / Value Support – Key Acceptance Zone around 4,350 - 4,370. This area has acted as the main base where price started to stabilize again. As long as gold remains above this zone, buyers still have a chance to build another recovery leg.
Above the current price, the nearest reaction area is around 4,433 - 4,450. This is the upper value / HVN area and also the first important level where price may face short-term selling pressure. If gold breaks and accepts above this area, the next upside path can open toward the larger sell zone at 4,594 - 4,628.
That 4,594 - 4,628 zone is the major resistance on this chart. It sits below the highest price area of the week and represents a potential seller interest zone if gold rallies too aggressively without strong acceptance.
On the downside, if gold loses the 4,350 - 4,370 value support, the structure becomes weaker again. In that case, the market may rotate lower before buyers can create another meaningful reaction.
Important zones
Current price area: 4,390 - 4,400
Gold is recovering but still below the first upper value resistance.
POC / Value Support: 4,350 - 4,370
Main buyer defense zone and key acceptance area.
Upper Value / HVN: 4,433 - 4,450
First resistance and short-term reaction area.
Buyside liquidity: 4,350 - 4,380
Liquidity zone where price may retest before any stronger move.
Sell zone: 4,594 - 4,628
Major upper resistance and potential seller interest area.
Weekly high area: 4,650+
The highest price area of the week and the larger liquidity reference.
Trading scenario
Priority view: buy reaction if 4,350 - 4,370 holds
Entry:
Look for buy positions only if gold holds above the POC / Value Support around 4,350 - 4,370 and shows clear bullish rejection.
Stop Loss:
Below the local sweep low or below the value support zone.
Take Profit:
TP1: 4,433 - 4,450
TP2: 4,594 - 4,628
TP3: Trail higher only if gold breaks and accepts above the sell zone
This setup follows the current value-support reaction. Buyers are not fully dominant yet, but the structure still allows a recovery if the POC base holds.
Alternative sell scenario
If gold reaches 4,594 - 4,628 and shows strong rejection, sellers may try to rotate price lower again.
Entry:
Look for sell positions only if gold rejects clearly from the 4,594 - 4,628 zone.
Stop Loss:
Above the rejection high or above the weekly liquidity area.
Take Profit:
TP1: 4,450
TP2: 4,370
TP3: 4,350 if downside pressure expands
A sell setup from the upper zone is only cleaner if price reaches resistance first. Selling directly in the middle of value is not ideal.
Final view
Gold is currently holding value after a difficult corrective phase.
The short-term structure is trying to recover, but the market still needs confirmation above 4,433 - 4,450 before buyers can regain stronger control. If that zone breaks, the next larger target becomes 4,594 - 4,628.
For now, my map is simple:
Hold 4,350 - 4,370 = buyers still defend value.
Break 4,450 = recovery momentum improves.
Reach 4,594 - 4,628 = major resistance test.
Reject 4,594 - 4,628 = sellers may return.
Lose 4,350 = gold may rotate lower again.
Gold is not a clean chase market right now. It is still a value-confirmation market.
The key is whether buyers can keep price above the POC support and force acceptance above the upper value area. If they can, gold may continue toward the major sell zone. If not, the market may stay trapped inside value before the next bigger move.
Will gold reclaim the upper value zone, or will sellers defend 4,594 - 4,628 again?
Long 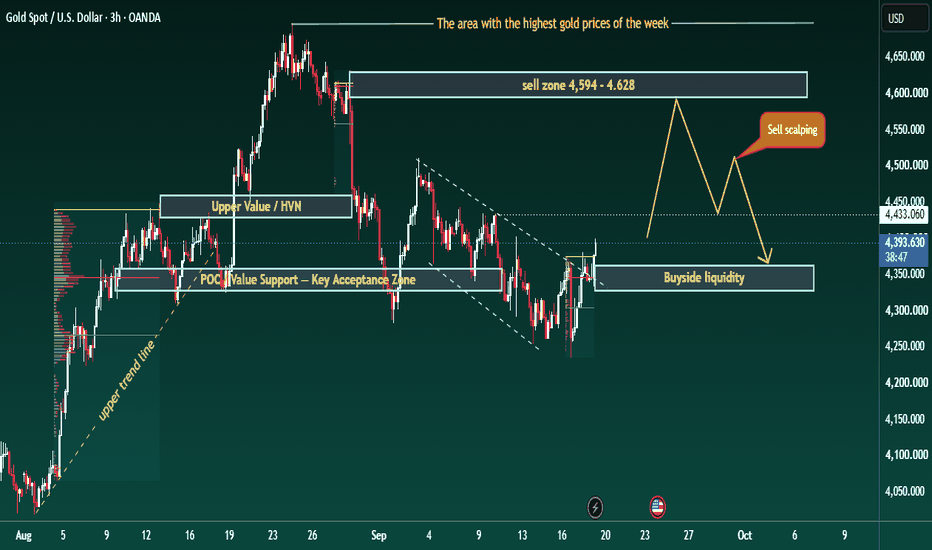
GOLD RALLIES AGAINST THE FED — FOMO OR A LIQUIDITY TRAP?Gold is showing a strong technical rebound despite the bearish macro backdrop, recovering from the 4,250–4,280 area and pushing back toward 4,390–4,400. However, the broader H4 structure has not yet changed: price remains inside the descending channel and is approaching the upper trendline. This makes the current rally an important test rather than a confirmed bullish reversal.
The interesting part is the divergence between macro narrative and short-term price flow. The Fed delivered a 25bp rate hike and maintained a relatively hawkish stance, while the latest U.S. jobless claims also showed a resilient labor market. Normally, this combination should create pressure on Gold. However, Treasury yields subsequently pulled back, the USD weakened, and oil prices eased as concerns over supply disruptions diminished. These moves helped Gold rebound more than 2% on Thursday.
From the institutional-flow perspective, this is exactly why FOMO should be avoided. Gold is rising, but the rally is occurring into a major technical resistance area while the broader H4 structure remains bearish. If price reaches 4,400–4,420 and fails to break the descending trendline, this rebound could become another liquidity trap before sellers return.
Bearish Scenario — Preferred Bias
If Gold is rejected around 4,390–4,420 and fails to break the descending trendline, sellers could regain control and push price back toward 4,330–4,350, followed by the 4,260–4,280 Supply zone.
The ideal setup is therefore not to chase the current rally, but to wait for rejection and confirmation before following the bearish flow.
Bullish Scenario
If buyers can produce a clean H4 close above the descending trendline and hold above 4,420, the bearish structure would begin to weaken. In that case, Gold could extend toward 4,450–4,480.
For now, the market is giving us an important message: Gold can rally even when the headline macro narrative looks bearish if USD and yields reverse lower. Therefore, the next move should be judged by the interaction between price and the trendline, rather than simply assuming that the Fed hike must immediately push Gold lower.
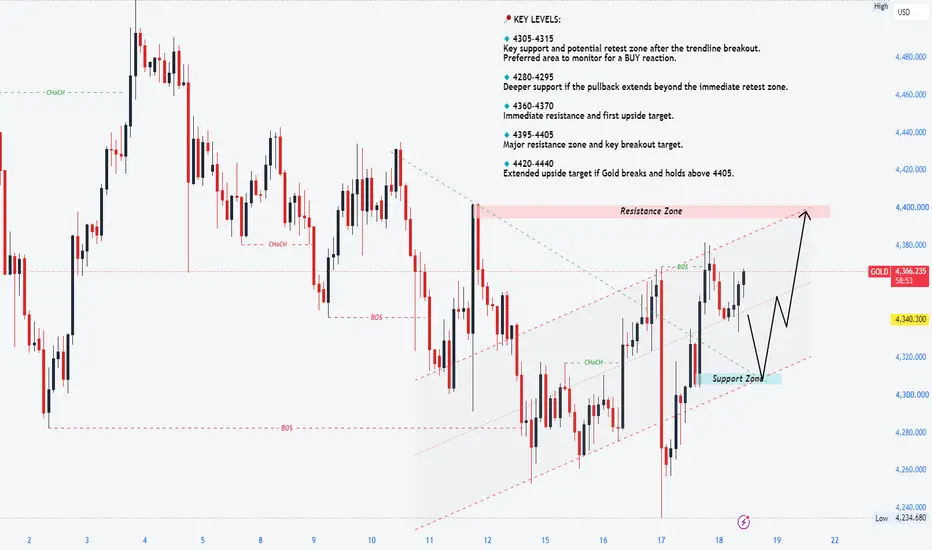
KEY LEVELS:
🔴 4,390–4,420 — Descending trendline / key resistance
🔴 4,450–4,480 — Major recovery zone
🟢 4,330–4,350 — Near-term support
🟢 4,260–4,280 — Major Supply / downside target
BIAS: BEARISH — NO FOMO. WAIT FOR REJECTION AT THE TRENDLINE OR A CONFIRMED BREAKOUT.
The question now is not “Gold is going up, should we buy?” — but “Is this a genuine structural breakout, or liquidity being built before the next sell-off?” Short 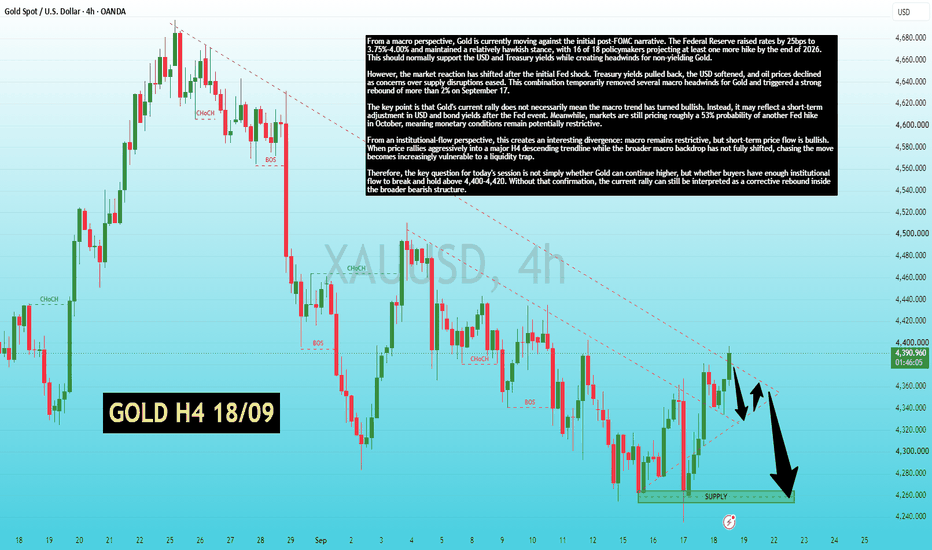
4400-4420 — Gold’s Real Battle After FOMCAfter FOMC, Gold has absorbed almost the entire selling pressure and bounced strongly from 4,234. Buyers have now regained most of their previous position, while M15 & H1 have formed bullish structures.
🔴 Key Decision Zone: 4,400–4,420
This is the final line of defense for sellers.
Rejection: Watch the reaction closely and look for a potential Sell scalp.
Break & Hold: Shift focus to Buy on pullbacks, with potential targets at 4,460 → 4,480 → 4,500 → 4,580 → 4,600.
🟢 Support Levels:
4,340 → 4,305 → 4,260
📌 Today’s Bias:
Prioritize Buy the dip. Sell scalps can still be considered around resistance, but stop looking for Sell setups if price breaks and holds above 4,420.
Market Psychology:
Sellers made a strong effort to keep the bearish move alive after FOMC, but they have not been able to maintain the downside momentum. The key question now is no longer “Can Gold continue lower?” but:
“Can sellers defend 4,400–4,420?”
4,420 is the line that matters. A clean break could mark the beginning of a new bullish wave. Long 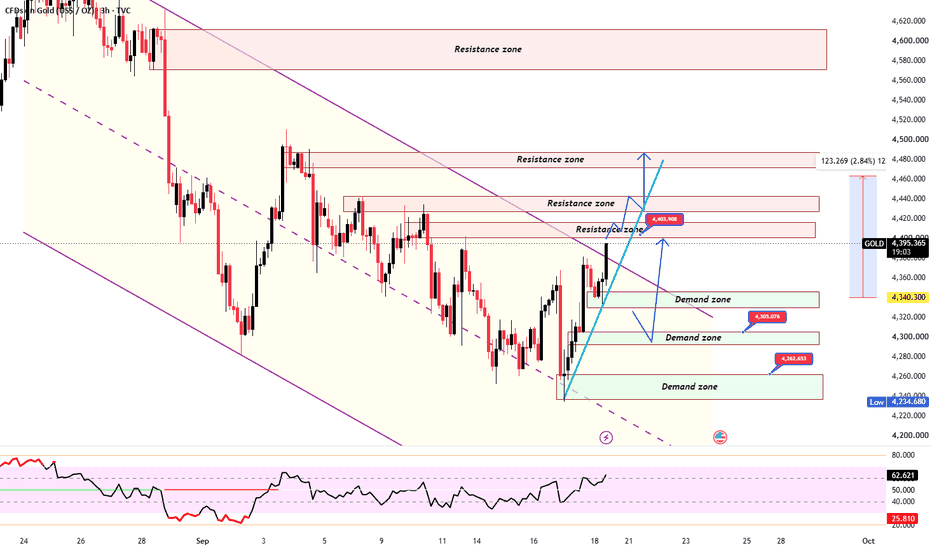
Education 
Long 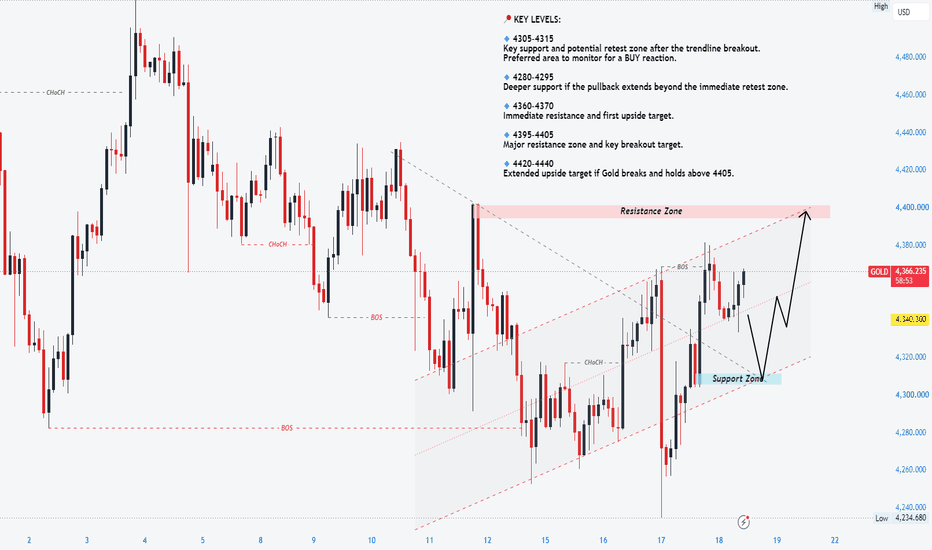
Long 
GOLD: Gold H1 Analysis – September 18📰 Gold Market News & Developments
Gold is staging a strong recovery following the sharp drop during the FOMC session. The Fed raised interest rates by 25 bps to the 3.75%–4.00% range and maintained a relatively hawkish stance, exerting pressure on Gold. However, on September 17, the USD and Treasury yields cooled off, and oil prices fell; this helped XAU/USD surge over 2% and return to the 4,350–4,360 range.
Currently, the market is in a tug-of-war: falling yields and a weaker USD are supporting Gold, while the Fed's hawkish outlook is capping the upside momentum.
📊 H1 Timeframe Analysis
After a sharp decline to the 4,240–4,260 zone, Gold has formed a series of higher lows and climbed back above 4,300.
However, the price has not yet broken through the 4,375–4,385 level, so a full bullish reversal cannot yet be confirmed.
→ Here are some trading zones to consider:
🔴 SELL zone: 4,370–4,385
- This is the immediate resistance zone where the price has reacted multiple times.
→ If the price reaches this zone but fails to break out, a correction may occur. We can look to Sell in this area if such a correction develops.
- Above this lies the 4,430–4,445 range, representing a stronger SELL zone on the chart.
🟢 BUY zone: 4,310–4,300
A key demand zone situated near the longer-term EMA.
→ If the price pulls back to this level and shows a bullish reaction, it becomes a notable area for BUY positions.
🟢 Lower BUY zone: 4,265–4,255
This is a stronger support zone that previously served as a bottom from which the price staged a significant rebound.
📈 EMA:
The price is currently trading above the cluster of short- and medium-term EMAs, indicating improved H1 momentum.
The EMAs around the 4,330–4,350 level are currently acting as dynamic support.
If XAUUSD holds above this EMA cluster, the recovery structure remains intact. Gold Delivers On Wave 5 Target, Now Retesting Fresh SupportFollowing up on the completed 5-wave structure — gold didn't just tap the target, it went the extra mile straight into the Premium Zone.
On the 1H XAUUSD chart, after that dramatic wave (4) liquidity sweep below 4,240, gold rocketed through wave (5) and kept climbing beyond the earlier Zone Sell, marked directly on the chart as "DONE" near the PREMIUM ZONE around 4,390–4,400. That's a strong confirmation that the liquidity grab at wave (4) really was the fuel for the entire final leg — exactly the kind of scenario Smart Money Concepts traders look for.
Since tapping that premium high, price has pulled back and is now sitting at 4,367.940, right at a fresh Zone Buy that formed during the impulsive rally, spanning roughly 4,335 to 4,360. This zone is essentially a byproduct of the strength of the move — when price rallies that fast, it often leaves behind a clean support shelf that becomes the next area of interest on a pullback.
This is a textbook "buy the dip after a completed structure" setup. The prior Zone Buy near 4,254–4,280 did its job perfectly, and now the market has created a fresh, higher version of the same concept following through on the trend.
If this new Zone Buy holds, the projected path anticipates a stepped recovery, with price working back up through minor pullbacks toward fresh highs beyond the recent Premium Zone peak.
The key level to watch is straightforward: a clean hold above 4,335 keeps the bullish continuation alive, while a break below would suggest this pullback needs to dig deeper before resuming.
Gold delivered on the last call — now the question is whether the fresh support holds for the next leg.
Do you think this new Zone Buy holds and gold pushes to fresh highs, or does it need a deeper retracement first? Long 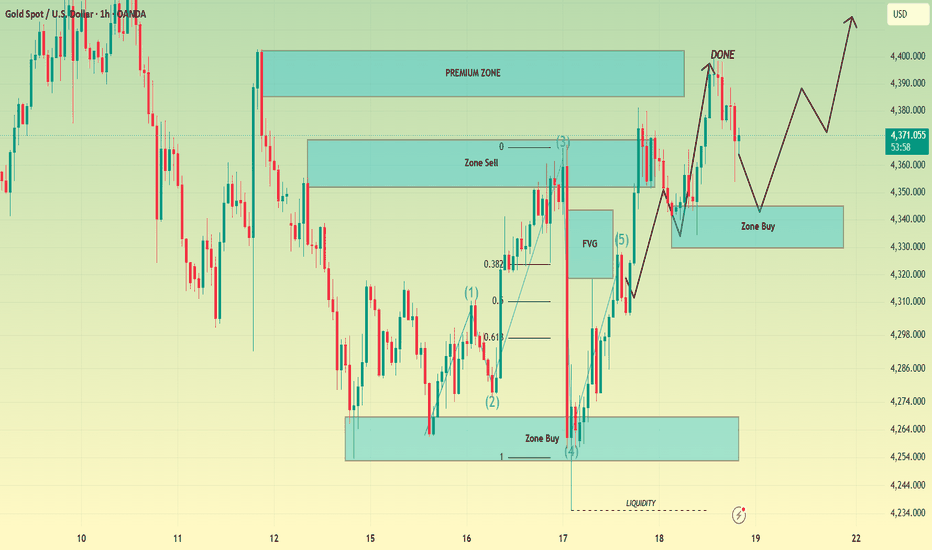
XAUUSD H1: Gold Has Two Floors, but Only One Can Save ItGold just gave us one of those moves that can easily fool both sides.
Price rallied from the 4,260 area, climbed all the way toward 4,365, and then lost almost the entire move in a single aggressive sell-off.
Now Gold is sitting around 4,290.
So what happened?
Buyers proved they can push.
Sellers proved they can hit harder.
And that leaves price in a very interesting place.
Instead of predicting the next candle, I am dividing today's chart into three floors.
4,260 → the defense
4,324 → the checkpoint
4,365 → the control level
Whichever side starts taking these floors will tell us much more than the current candle ever could.
Floor #1 is already under attack
The most obvious area on the chart is the H1 Order Block around 4,258–4,272.
This is where the latest collapse found buyers.
But I do not want to BUY simply because price returns there.
There is a difference between touching support and proving support works.
If Gold revisits 4,258–4,272, I want sellers to attack the zone first.
Then I want buyers to take it back.
In practical terms, a dip into the Order Block followed by an H1 recovery above approximately 4,275 gives me the confirmation I need.
BUY — SECOND DEFENSE
Entry: 4,272–4,280 after H1 reclaim
SL: 4,250
TP1: 4,305
TP2: 4,324
TP3: 4,350
TP4: 4,365
Notice where TP2 sits.
That is not a random target.
4,324 is where today's chart changes character.
4,324 is not resistance. It is a checkpoint.
Gold is currently below 4,324, and the short-term EMAs are also sitting overhead.
That means a bounce from 4,260 is only a bounce until proven otherwise.
For buyers to earn something more, I want an H1 candle to close above 4,324, followed by a retest that remains above approximately 4,315–4,324.
If that happens, I would stop treating every rally as something to sell.
BUY — CHECKPOINT RECLAIM
Entry: 4,320–4,327 after bullish retest
SL: 4,298
TP1: 4,350
TP2: 4,365
TP3: 4,385
TP4: 4,400
This is the cleaner BUY for traders who do not want to catch the bottom.
You sacrifice a cheaper entry.
In return, you get more information.
That is often a good trade.
But there is unfinished business at 4,365
Look at what happened during the previous rally.
Gold reached approximately 4,360–4,365, met the falling EMA200, and was immediately rejected.
That reaction matters.
It tells us sellers are still defending the upper part of the H1 structure.
And above it sits the larger 4,380–4,400 resistance zone.
So if Gold recovers again, I will not automatically become bullish.
I will watch 4,355–4,370 very carefully.
A second rejection there, especially an H1 candle that trades above 4,355 but closes back below 4,350, would give sellers another opportunity.
SELL — SECOND REJECTION
Entry: 4,348–4,358 after rejection confirmation
SL: 4,375
TP1: 4,324
TP2: 4,300
TP3: 4,275
TP4: 4,260
This trade has a simple idea behind it:
If buyers receive a second opportunity to reclaim the EMA200 and fail again, I do not want to argue with the rejection.
I want to trade it.
What if the Order Block breaks?
This is where the chart becomes much easier.
If Gold produces an H1 close below 4,255, I no longer consider 4,260–4,270 a valid buying area.
Support has had its chance.
It failed.
I would then wait for price to bounce back toward 4,255–4,265 from underneath.
If that retest is rejected:
SELL — FLOOR REMOVED
Entry: 4,255–4,263 after bearish retest
SL: 4,280
TP1: 4,235
TP2: 4,215
TP3: 4,190
The key here is patience.
I do not want to sell a huge red candle below 4,255.
Let the breakdown happen.
Let price come back.
Then see whether former support becomes resistance.
That gives the trade structure instead of emotion.
And 4,400?
That is where I stop looking for reasons to be bearish.
The chart still has a major resistance band around 4,380–4,400, so even a recovery above 4,365 does not automatically mean Gold is free.
For me, an H1 close above 4,400 followed by a successful hold of 4,385–4,400 would be the real structural upgrade.
At that point:
BUY — SELLERS LOSE THE ROOF
Entry: 4,392–4,402 after retest holds
SL: 4,370
TP1: 4,425
TP2: 4,440
TP3: 4,465
TP4: 4,485
Until that happens, 4,400 remains the ceiling.
Above it, the chart becomes a different market.
My map for today is deliberately simple
Forget trying to predict every H1 candle.
Watch who owns the floors.
Below 4,255: sellers have removed the foundation.
4,260–4,275: buyers get their defensive opportunity.
Above 4,324: the recovery starts earning credibility.
Around 4,365: buyers face the EMA200 test again.
Above 4,400: I stop treating this as merely another rebound.
Gold is currently around 4,290, which is almost exactly where I do not want to force a position.
The better trades are sitting at the edges of the map.
4,260 asks whether buyers can defend.
4,324 asks whether they can advance.
4,365 asks whether they can survive resistance.
4,400 asks whether they can finally take control.
Which level do you think gets taken first — 4,260 or 4,324? Long 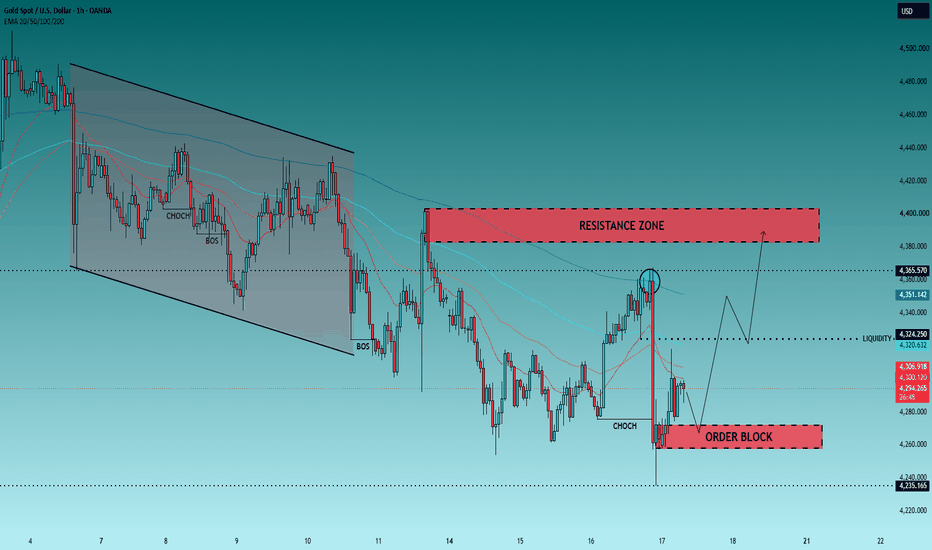
 Long
Long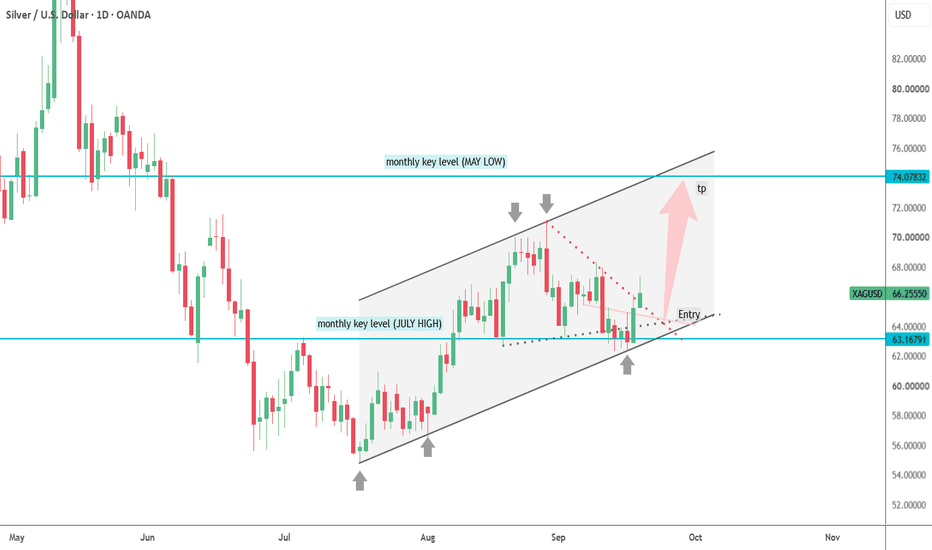
XAGUSD: Massive Descending-Triangle-Formation Completes.Hello Community,
welcome to my new analysis of XAGUSD on the daily timeframe perspective. In the recent times, I have spotted some interesting signs in XAGUSD having the potential to lead to a great trading opportunity in the next times. Therefore, I have identified all of the factors necessary to consider now.
When looking at my chart, we can see how XAGUSD has several supports in the trading structure. The most important support cluster comes from the ascending support trendline, which matches the 300-EMA support. XAGUSD trades above these support levels.
The most important formation of this whole structure is this gigantic descending triangle formation. Within this formation, XAGUSD has already completed the wave count. With the recent breakout, it is now completing this formation and has already activated the target zones, as seen in my chart. Once the first target zone has been reached and the momentum holds, the next target zone is also likely to be reached.
In this manner, thank you a lot for watching!
The support is highly appreciated.
VP PALLADIUM Bull Cycle rally to $3800.Last time we took a look at Palladium (XPDUSD) on May 01 (see chart below), we gave a strong Sell Signal at the top of its 2026 Channel Down, which as it got rejected on the 1D MA50, it hit our $1200 Target and shortly after it rebounded:
This time we move on to the larger time-frames in order to identify the true underlying market trend. And what the 1M chart shows is that the recent June low was made on the 1M MA200 (orange trend-line), which historically is the strongest market Support, holding on the January 2016 bottom and only breaking once in November 2023.
In addition, the current price action since the March 2022 High resembles the post January 2001 pattern. Based on that we could be on a similar Higher Low as July 2005, which initiated the first true Bull Cycle rally that peaked just below the 1.786 Fibonacci extension.
This time we have to also consider that 0.618 - 0.786 Fibonacci range, which has been the macro Resistance Zone of the 23-year Channel Up that only broke once.
As a result, our long-term Target now is $3800, which falls under the 1.786 Fib ext and exactly on the 0.618 Channel Fib.
---
** Please LIKE 👍, FOLLOW ✅, SHARE 🙌 and COMMENT ✍ if you enjoy this idea! Also share your ideas and charts in the comments section below! This is best way to keep it relevant, support us, keep the content here free and allow the idea to reach as many people as possible. **
---
💸💸💸💸💸💸
👇 👇 👇 👇 👇 👇  Long
Long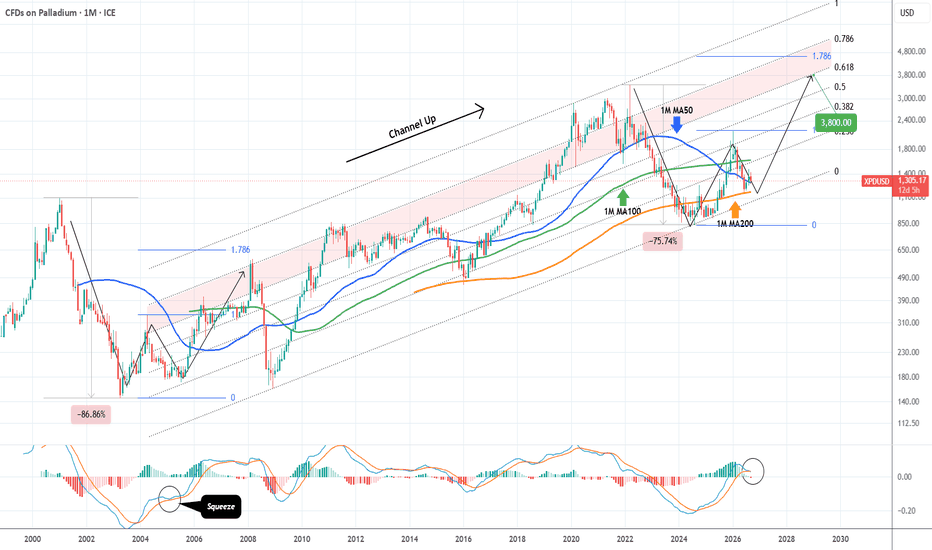
XAUUSD — Bullish Retest Toward 4,410Fundamental Analysis
Gold finishes the week on firmer footing as easing crude oil prices reduce near-term inflation pressure, helping XAUUSD recover despite the U.S. dollar remaining near a seven-week high. Gold posted its first weekly gain in four weeks, while markets now price roughly a 55% probability of another Fed hike in October after this week’s 25 bp increase.
Treasury yields have also eased from their post-Fed highs, although the U.S. 10-year remains close to the important 5% area. Next week, traders will focus on U.S. PMI data, Fed communication and whether lower energy prices can continue moderating inflation expectations.
Technical Analysis
On H1, XAUUSD is trading near 4,378 after successfully reacting from the previous 4,355–4,367 buy zone and reaching the 4,389–4,395 resistance area.
Price has printed a BOS above 4,377, while the rising support trendline continues to protect the recovery structure.
The preferred continuation area remains 4,355–4,367, where Fibonacci 0.618, previous structure and the marked buy zone converge.
If buyers defend this area again, gold may retest 4,389, followed by the key 4,410 liquidity high.
A deeper correction could reach 4,342, with the H1 FVG around 4,323–4,342 acting as secondary support.
Important Key Levels
4,410 — Main liquidity target
4,389–4,395 — Immediate resistance
4,377 — BOS / short-term pivot
4,355–4,367 — Main buy zone
4,342 — Fibonacci support
4,323–4,342 — H1 FVG
Below 4,338 — Bullish invalidation
Trading Scenario
Main Buy Setup
Entry: 4,355–4,367
Stop Loss: 4,338
Take Profit 1: 4,389
Take Profit 2: 4,400
Take Profit 3: 4,410
Buy Condition
Wait for a controlled retracement into 4,355–4,367 and bullish confirmation. A liquidity sweep, long lower wick, bullish engulfing candle or H1 reclaim above 4,367 may signal renewed buyer pressure.
A sustained H1 break below 4,338–4,342 would weaken the continuation setup.
Overall View
The H1 structure remains constructively bullish while price holds above the rising support structure. Since gold is currently near the 4,377–4,390 resistance area, chasing fresh longs offers less attractive positioning.
The preferred plan is to wait for another retracement into 4,355–4,367. If buyers defend the zone, XAUUSD could retest 4,389–4,400 and potentially attack the 4,410 liquidity high.
Will gold defend 4,355–4,367 again before breaking 4,410? Long 
Why Price Returns to Certain LevelsWhy Price Returns to Certain Levels
“Price doesn't always return because it has to. Sometimes it returns because something remains unfinished.”
A strong move can take price far away from where it started.
Then, after moving aggressively in one direction, price turns around and comes back to that same area.
Many traders see this simply as a retracement.
But sometimes the return has a deeper purpose.
The Origin of the Move Matters
Look at where the strong move began.
Was there a clear displacement?
Did price leave the area decisively?
Was there a meaningful change in order flow?
When price leaves an area with strength, that origin can remain important even after price has travelled a long distance.
The market may return to it later.
This Is Mitigation
Mitigation is essentially the market returning to an area that was involved in the previous move.
Price comes back into the zone and interacts with it again.
Sometimes the reaction is immediate.
Sometimes price moves deeper into the area.
Sometimes the level fails completely.
That is why simply marking an old level is not enough.
Liquidity Can Explain the Return
Price doesn't move between levels randomly.
Liquidity can exist around previous highs, lows, equal highs, equal lows, and other obvious areas.
A retracement may therefore serve more than one purpose.
Price can return toward a previous zone while also seeking liquidity.
For example:
Strong move
→ liquidity develops
→ price retraces
→ liquidity is taken
→ previous zone is mitigated
→ price reacts
The sequence can vary.
The important thing is to understand the relationship between structure, liquidity, and the level.
Not Every Old Level Matters
This is where many traders make a mistake.
They mark every previous reaction and assume price must respect it again.
But a level becomes meaningful because of the context in which it was created.
Ask:
• How strongly did price leave the area?
• What structure existed around it?
• Has the zone already been mitigated?
• Where is the nearby liquidity?
• What has happened since the level was created?
An old price level is not automatically a valid trading level.
The Return Is Information
When price comes back to an important area, don't immediately think:
“Price must reverse here.”
Instead, observe what the return is doing.
Is price approaching aggressively?
Is liquidity being taken?
Is the original zone being mitigated?
Is the market showing acceptance beyond the level?
Or is price reacting immediately?
The return itself gives information about the current state of the market.
Context Comes Before the Level
A common mistake is to trade the level first and understand the context later.
It should be the opposite.
First understand the structure.
Then identify the important move.
Then locate where that move originated.
Then examine the liquidity around it.
Only after that should the level become part of your execution plan.
A Level Is Not a Trade
This is perhaps the most important distinction.
A zone can be technically valid and still produce no trade.
Price may return and continue straight through it.
Price may partially mitigate it and continue.
Price may react and then reverse again.
The level gives you a location.
Price action decides what happens there.
Don't trade a level because price was there before.
Understand why price may return, what remains around that area, and what the market does when it gets there.
📘 Shared by @ChartIsMirror
When price returns to a previous level, what do you look at first: the structure, the liquidity, the strength of the return, or the reaction at the level? Education 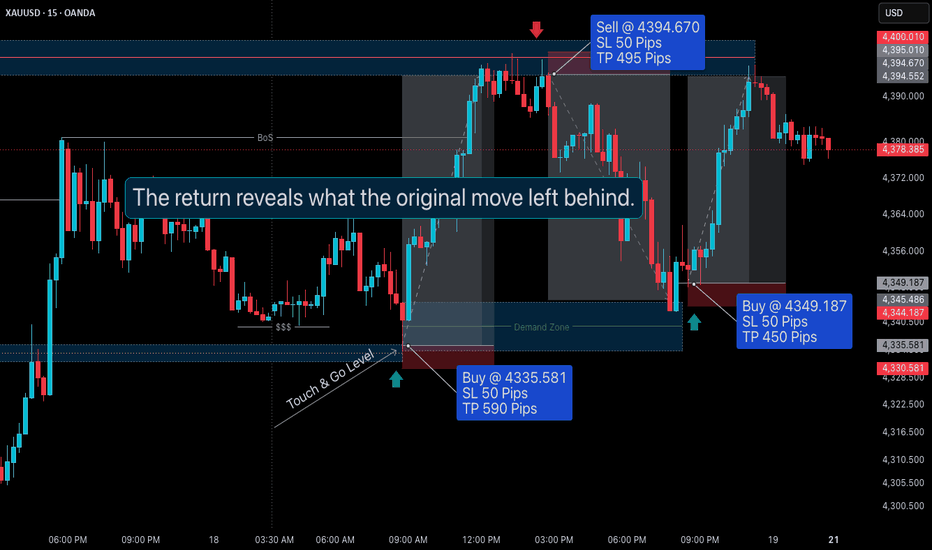
Gold Sweeps the Lows, Breaks Structure — Now the FVG DecidesXAUUSD · Sep 19, 2026 · Price: 4,389.58
Gold spent most of the month bleeding lower from the 4,500 high on the 4th, printing a textbook sequence of bearish BOS levels along the way. The descending trendline held cleanly for two weeks. Nothing controversial about that leg — sellers were in control and every rally got sold into the trendline.
The shift happened on the 17th. That deep wick down to 4,240 wasn't real selling, it was a liquidity raid. It took out the SSL resting under the 15th–16th consolidation and ran the external liquidity pool around 4,285 in the same move. Price immediately reversed and closed back inside the range — classic stop hunt behavior. What followed was the important part: a sharp impulsive rally that sliced through the descending trendline and printed a bullish BOS on the 18th. That's the market structure shift.
Now the setup. That impulse left an unfilled FVG around 4,368, and price is currently hovering just above it. The bullish thesis is straightforward: price retraces into the imbalance, finds demand, and continues toward the unmitigated bearish OB sitting at 4,463–4,480 — the origin of the whole down move and the only real supply left overhead.
The numbers:
Entry zone: 4,368 (FVG fill)
Invalidation: below 4,341
Target: 4,463, with the OB extending to 4,480
That's roughly 27 points of risk against 95 to target. Call it 3.5R. The math is what makes this setup worth taking, not the bias.
What would kill this idea: a clean close below 4,341. If price loses the FVG and the demand block beneath it, the bullish BOS becomes a failed break and we're right back to the sellers' game — 4,285 comes into play fast. Also worth watching: a rally that skips the retrace entirely and goes straight to the OB. Chasing that would mean taking a far worse entry with the same invalidation, which turns a 3.5R idea into something closer to 1R. Not worth it.
Patience is the trade here. The structure has shifted, but the entry hasn't come to you yet. Let the FVG do its job.
This is technical analysis shared for educational purposes only — not financial advice. Trade your own plan and manage your own risk. Long 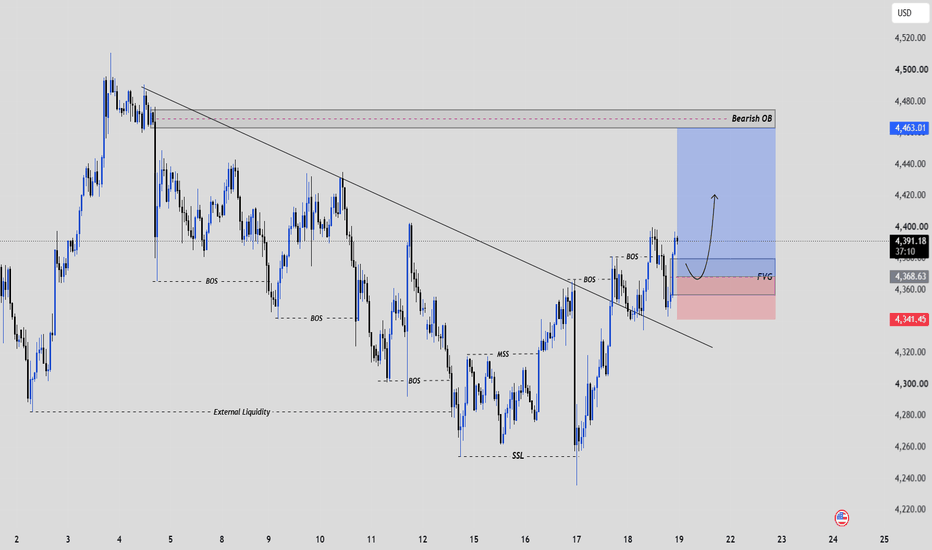
Nasdaq, NVDA Lag Behind the S&P 500 It seemed the reaction in equities a day after the rate hike was well received across markets, with many analysts sounding very bullish given how well stocks performed even as the Fed highlighted another hike by the end of the year.
And while there does remain a bullish setup in the S&P 500, with a bull flag in order, there are other items of possible concern, chief of which is how the Nasdaq which has very much led the way higher from the 2022 lows with the AI trade driving global markets, has started to lag.
The index put in a fresh ATH just a day before Kevin Warsh's first rate decision atop the Fed, and since then, it's been lower-highs. This isn't necessarily a doomsday item yet, but the fact that NVDA hasn't set a fresh high since March - even after a strong quarterly earnings report - along with this built-in lag in the Nasdaq, are items worth keeping attention on.
That said, this chart can possibly be argued as bullish - provided that buyers make a quick return and take out the resitsance trendline, which currently helps to define an inverse head and shoulders pattern.
But if this hawkish twist at the Fed weighs and appetite for chasing NVDA and other semi stocks continues to sour, we could be on the cusp of a larger turn ahead. - JS