Long
Long
XAU/USD: Market Analysis and Strategy for September 16Looking ahead at the gold price trend over the next 15 days, the key factor for short-term movement is not merely whether the Federal Reserve raises interest rates this time, but whether the post-meeting resolution alters market expectations regarding future interest rates. If the Fed continues to emphasize that high interest rates will be maintained for a longer period, gold and silver will remain under pressure; conversely, if the Fed adopts a cautious stance regarding inflation driven by oil prices, safe-haven capital might provide some support to gold and silver prices.
From a technical perspective, gold exhibited a classic "shakeout" pattern of range-bound volatility yesterday. After surging to the 4317 level during the Asian session, the price retreated rapidly due to resistance from a trend line, subsequently finding support and rebounding near this week's lows. The daily chart closed with a "Doji" star, while the hourly and four-hour charts maintain a sideways range-bound pattern—fluctuating between 4250/4260 and 4310/4320—with frequent shifts between bullish and bearish momentum. The main event is today's Federal Reserve interest rate decision; while market expectations remain largely unchanged, the focus should be on the actual data and policy commentary following the announcement.
My recommendations:
SELL: Near 4320
SELL: Near 4335  Short
Short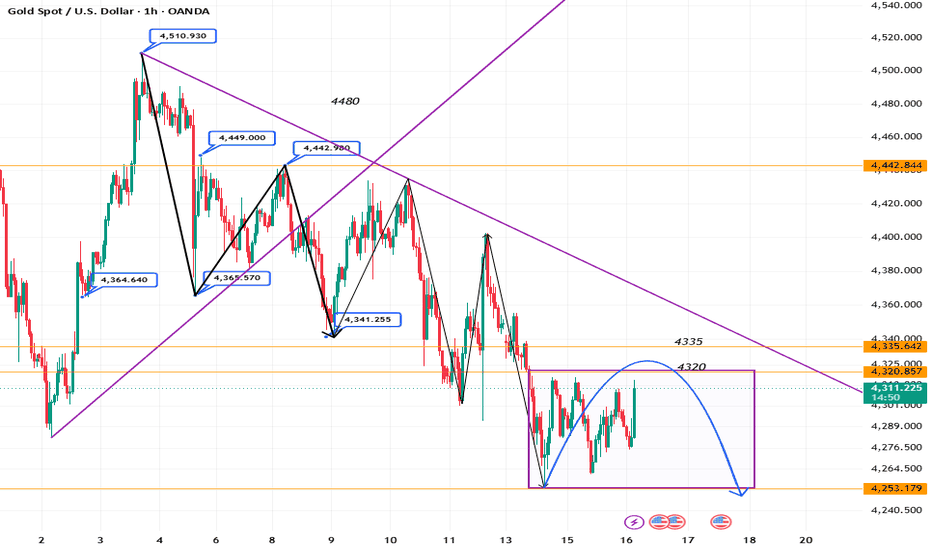
H4 Recovery From Lower Structural Support
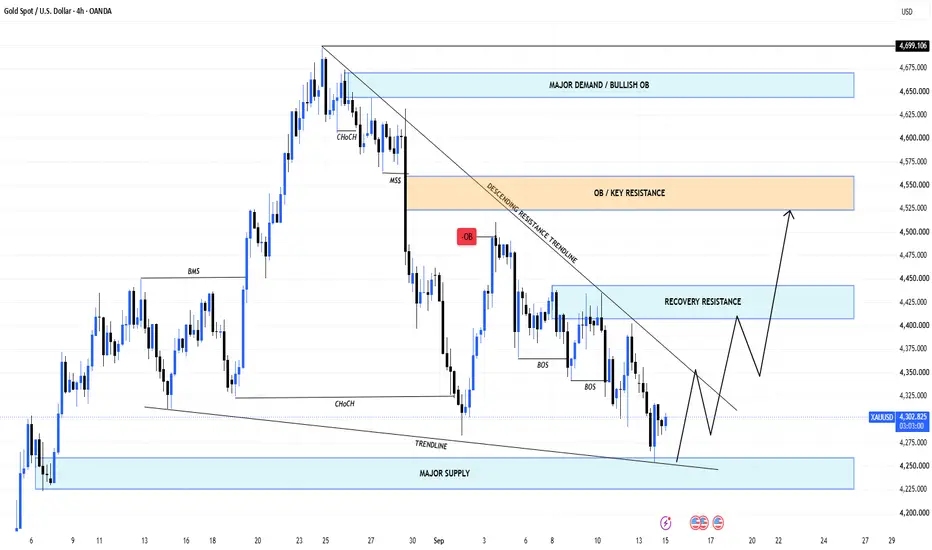
XAUUSD is trading around 4,297 after extending the bearish H4 sequence into the lower part of the current structure. Price remains below the descending resistance trendline, so the broader bias is still defensive, but the market is approaching an area where a corrective recovery may develop.
The macro environment remains difficult for gold. The Fed begins its September meeting today, with a 25 bp hike widely expected after hotter inflation data. Gold has fallen to a fresh one-month low, while Brent has surged above $108 and the U.S. 10-year Treasury yield has traded around 5%, reinforcing inflation and higher-rate pressure on non-yielding gold.
Technical View
The H4 structure remains bearish after consecutive BOS signals and continued rejection beneath the descending resistance trendline.
Price is now trading close to the lower structural area around 4,225–4,260. Although the chart labels this lower box differently, technically it is the main reaction/support area for the projected recovery path.
A liquidity sweep into this region followed by bullish rejection, H4 reclaim or MSS confirmation could trigger a corrective rebound.
The first meaningful upside objective is the 4,405–4,440 Recovery Resistance zone.
If buyers regain acceptance above this structure, the next recovery target sits at 4,525–4,560 OB / Key Resistance.
The higher 4,640–4,665 area remains a larger HTF objective, but it should not be assumed reachable while the broader descending structure remains intact.
Key Zones
Current Price: 4,297
Lower Structural Support: 4,225–4,260
Recovery Resistance: 4,405–4,440
OB / Key Resistance: 4,525–4,560
Upper HTF Zone: 4,640–4,665
Major Swing High: 4,699.106
Trading Plan
Buy Priority: 4,225–4,260
Condition: wait for an H4 liquidity sweep followed by bullish rejection, reclaim, MSS or clear higher-low confirmation.
TP1: 4,405–4,440
TP2: 4,525–4,560
Invalidation: sustained H4 acceptance below 4,225 would weaken the recovery setup.
Buy/Sell View
This is a counter-trend recovery plan, not confirmation that the H4 downtrend has ended.
With the Fed decision approaching and rate-hike expectations extremely elevated, buying blindly around current price offers poor confirmation. The cleaner setup is to let price test lower structural support and show that sellers are losing control first.
If 4,225–4,260 fails, the bullish recovery thesis should be reassessed rather than forcing a long position.
Final View
Gold remains under strong macro and technical pressure ahead of the Fed, but H4 is approaching an important lower reaction area after an extended decline.
The main scenario is a liquidity sweep into 4,225–4,260 followed by confirmed recovery, targeting 4,405–4,440 first and 4,525–4,560 if momentum strengthens.
The Fed decision and guidance will likely determine whether this lower H4 structure can produce a genuine recovery or simply another temporary bounce. Long 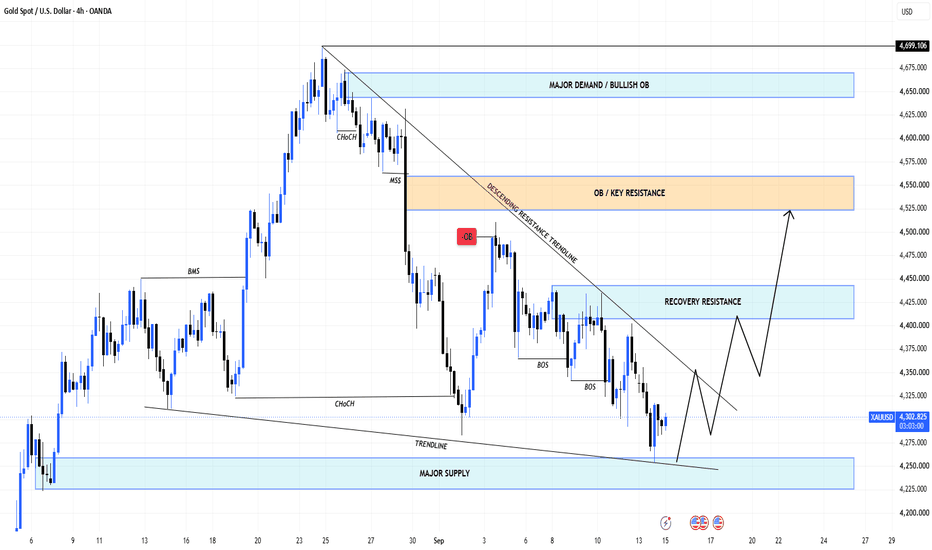
Dollar Index (DXY) Double Three Rally Likely to Break LowerThe short‑term Elliott Wave view in the Dollar Index (DXY) indicates that the Index is correcting the cycle from the June 24, 2026 high within a double three structure. From the August 20, 2026 low, wave ((w)) concluded at 99.86. The subsequent pullback in wave ((x)) unfolded as a zigzag formation, where wave (a) terminated at 98.83 and wave (b) ended at 99.39. A final decline in wave (c) reached 98.58, completing wave ((x)) at a higher degree. Following this, the Index turned upward in wave ((y)), which is developing internally as another zigzag structure.
From wave ((x)), wave (a) advanced to 99.36, while the corrective pullback in wave (b) settled at 98.96. The Index has since resumed its upward trajectory, and as long as price remains above 98.58, the near‑term outlook favors further strength. The projected target aligns with the 100%–161.8% Fibonacci extension measured from the August 20 low. This extension defines a zone between 99.9 and 100.7, which serves as a potential area where sellers may emerge. Within this region, the Index could produce a three‑wave pullback or initiate a broader corrective phase to the downside.
Overall, the structure highlights a corrective sequence that remains constructive above 98.58. The unfolding zigzag in wave ((y)) suggests that buyers retain control in the short term, though the identified resistance zone should be monitored closely for signs of exhaustion.  Long
Long
Bearish Continuation Plan, Small OB Retest | XAUUSD 15/09Gold is currently trading around 4,300 after a strong bearish displacement from the 4,430–4,437 OB.
The H1 structure remains bearish, with price continuing to form lower highs and lower lows. The recent recovery from the 4,270 area has not yet produced a meaningful bullish structural shift.
For today, my main expectation is a corrective recovery into the Small OB, followed by another potential bearish continuation if price fails to reclaim the zone.
🔍 H1 Market Structure
Price rejected the 4,430–4,437 OB and continued lower.
The 4,390–4,400 OB remains a major resistance area.
The recent displacement broke below the 4,300 region, showing strong downside pressure.
Current price action is consolidating around 4,290–4,305.
No confirmed H1 bullish MSS has appeared yet.
💧 Key POI & Liquidity
📍 Small OB: 4,307–4,318
📍 Major H1 OB: 4,390–4,400
📍 Bearish OB: 4,420–4,437
📍 Current price: Around 4,300
📍 Intraday support: 4,280–4,290
📍 Major Bullish OB: 4,235–4,245
🎯 Today's Main Scenario — Bearish Continuation
The preferred scenario is a corrective recovery into the Small OB around 4,307–4,318.
I am waiting for price to return to this zone and show bearish rejection, followed by a lower-timeframe MSS or displacement.
The idea is to use the recovery as a potential continuation opportunity rather than chasing the current bearish move.
📌 Trade Plan
Entry Zone: 4,307–4,315
Confirmation: M5/M15 bearish MSS or rejection from the Small OB.
Stop Loss: 4,325
TP1: 4,292
TP2: 4,280
TP3: 4,250
Final POI: 4,235–4,245 Bullish OB.
Risk Management:
Risk per setup: 0.5–1% maximum.
After TP1, consider reducing risk and protecting the position.
No entry if price does not return to the planned zone.
No chasing after a strong bearish displacement.
🔄 Alternative Scenario — Bullish Recovery
If price reclaims 4,318 with strong displacement and holds above the Small OB, the immediate bearish continuation setup becomes invalid.
In that case, the next recovery area to monitor is the 4,390–4,400 OB.
A sustained H1 reclaim above 4,400 would weaken the current bearish structure and suggest that a deeper recovery may be developing.
🧠 My Bias & Today's Direction
Bearish bias for today.
My expected path:
4,300 → corrective recovery toward 4,307–4,318 → bearish rejection → 4,292 → 4,280 → 4,250.
The key condition is whether price can hold below the Small OB after a retest.
If the zone rejects price, downside continuation remains the preferred scenario. If price reclaims and holds above it, I will reassess the bearish thesis instead of forcing the setup. Short 
Long 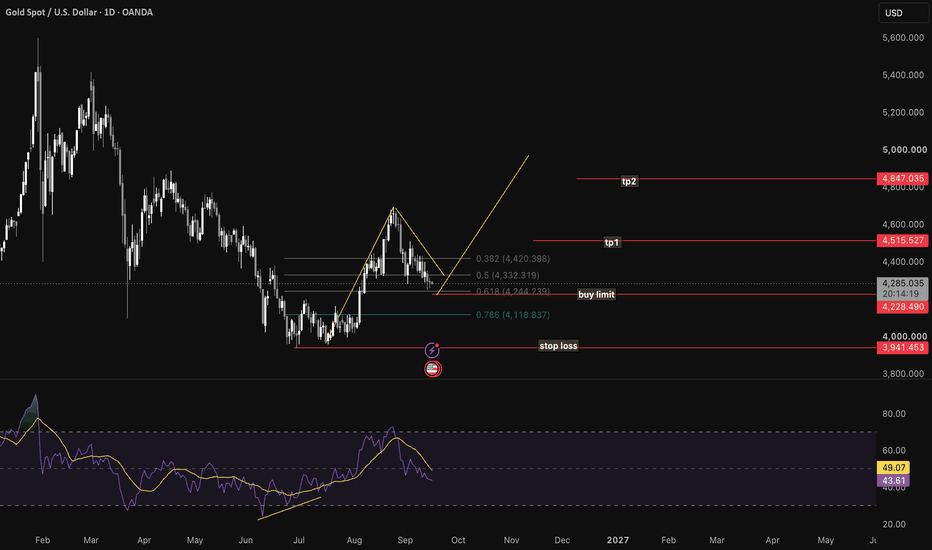
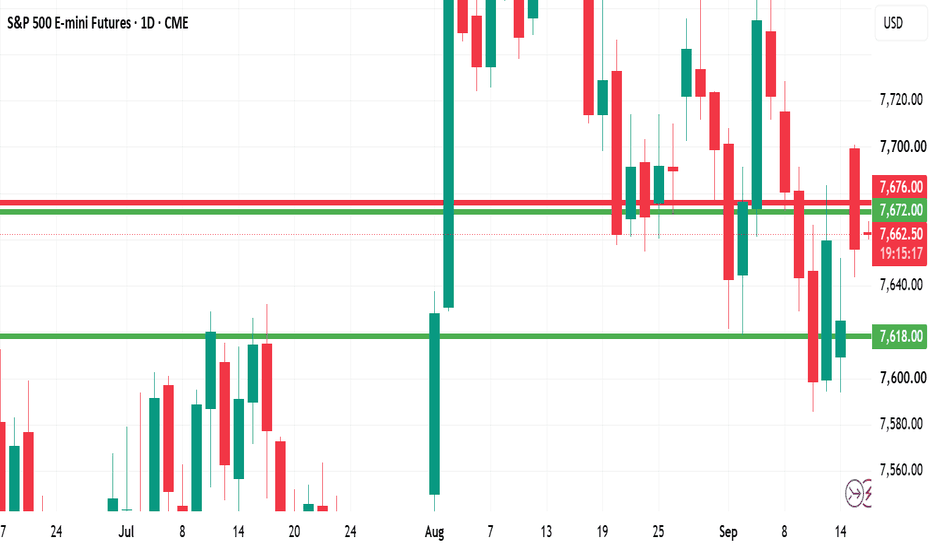
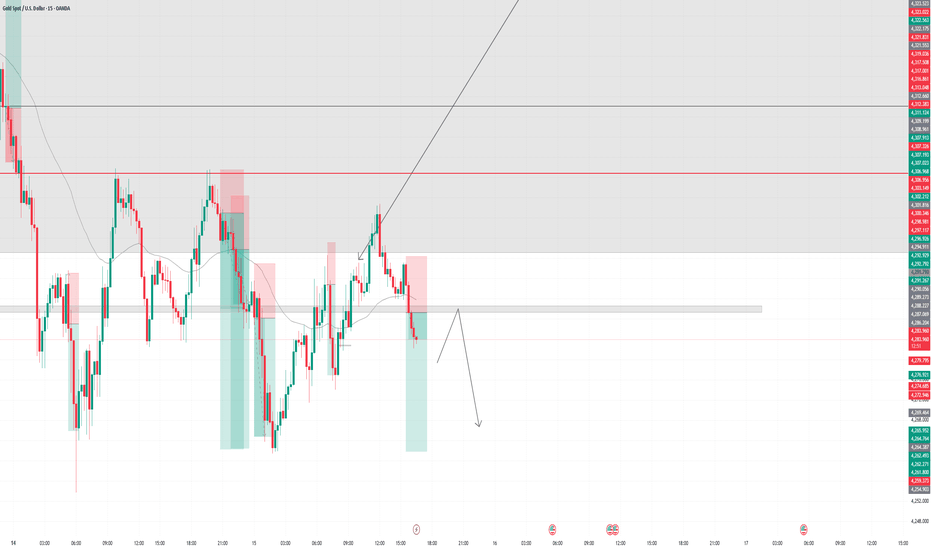
Daily Analysis and Reaction Locations [2026-09-16]Rollover's complete, next contract active — fresh analysis from here.
Bias: short, as long as the sub high holds — shifts to long once it breaks.
Sitting out the NY session today given the interest rate decision; pre-market focus only.
Zone Colors:
• Gray marks reaction zones (conditional trades, targets)
• Red marks trade locations
Key Levels:
• Swing High: Confirmed Trend Shift
• Sub High: Early Trend Invalidation
• Swing Low: Trend Continuation
Trade Idea
Short inside the identified trade location around the sub high supply zone, targeting the swing low, with the sub high as risk reference. The idea is invalidated if either the swing low or the sub high breaks.
Price is close to the market pullback zone — a possible early sign the swing structure is shifting. I'm waiting for the directional-shift confirmation once price approaches the market pullback zone rather than treating a swing low break in isolation as a clean continuation signal, given how close the two levels already are. Three potential price zones sit inside the pullback zone, visible on zoom out.
Grab the chart or zoom out on the preview to see all zones.
The reasoning, if you want it.
Swing structure broke with a same-day pullback, and the current swing low got violated but not yet broken. The volume profile anchored to the last confirmed swing high has its POC distributing right toward that violated level — that combination is what's creating the early signal that direction might be shifting from down to up. It's exactly why price approaching the market pullback target while that signal is already building changes how I'd read a swing low break here: confirmation of continuation, technically, but not something to chase in isolation this close to a level with its own reversal potential.
Shared for educational and analytical purposes only — not financial advice or a trade recommendation. Entries, stops, and targets are shown for study, not signals to copy.
Short 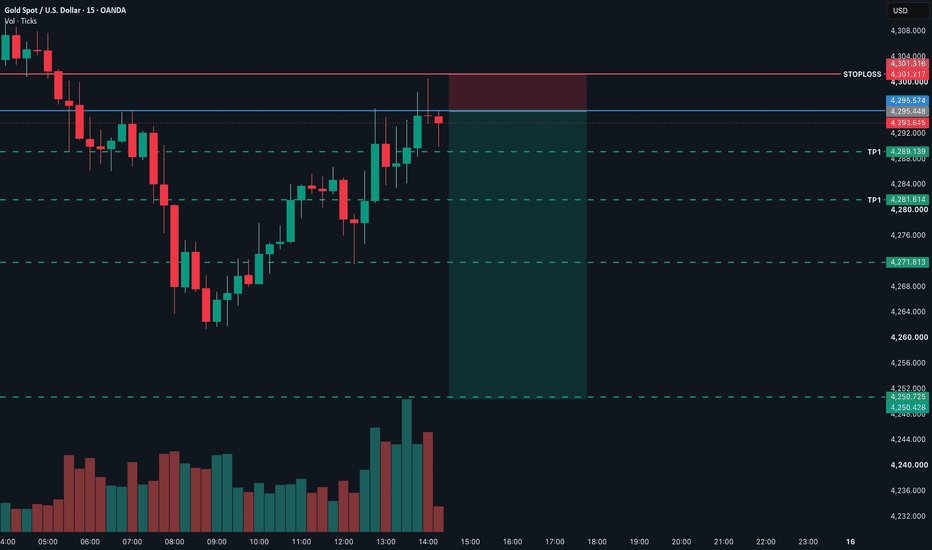
XAUUSD 1D SELL ViewGOLD MARKET OUTLOOK — 16 SEPTEMBER
Gold is trading today between $4,260 and $4,318.
✍️Technical View
• Daily: The correction from $4,697 remains active. Gold is still well below its 200-day moving-average area around $4,530–$4,543, keeping the wider structure bearish.
• H4: Sellers remain in control after Monday’s recovery was rejected at $4,356. Today’s lower high near $4,318 confirms that upside momentum is still weak.
• H1: Gold has returned close to its session low. $4,284–$4,297 is the immediate Fibonacci recovery zone, while $4,264–$4,253 is the main support and decision area.
✍️How to read the price action?
— Most likely scenario: While gold remains below $4,284–$4,297, pressure stays tilted toward $4,264–$4,253. An H1 close below $4,253, followed by failure to reclaim it, could expose $4,230–$4,223, then $4,203–$4,200. Recovery above $4,297 would weaken this path.
— Alternative scenario: An H1 close above $4,297 that holds on a retest could support a rebound toward today’s $4,318 high. Acceptance above $4,318 would bring $4,335–$4,356 into focus. A return below $4,284 would weaken the recovery.
The dollar index has strengthened toward 99.63, while the US 10 year Treasury yield reached 5.0266%, its highest since 2007. Brent oil is holding near $107. Higher oil supports gold through geopolitical risk, but its inflation impact is currently strengthening the dollar, yields and expectations of tighter Fed policy. Markets price roughly a 93% probability of a quarter-point Fed increase.
✍️Economic News
The Fed’s two day meeting begins today. Wednesday’s decision is due at 7:00 PM London time, followed by the press conference at 7:30 PM. Volatility may remain uneven as traders position ahead of the announcement. Short 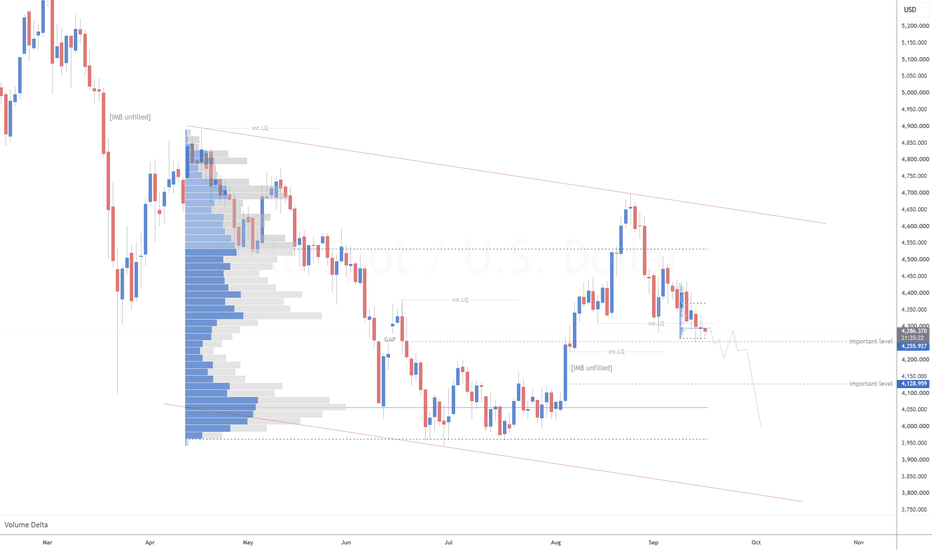
GOLD - Structure Before FOMC Decision Tomorrow This may be gold's last chance for the bulls to reclaim this trend and shoot for a new higher high. Tomorrow is a big day for gold due to the FOMC decision. Let me break down why this matters so much, from both a technical and fundamental perspective.
The Technical Setup
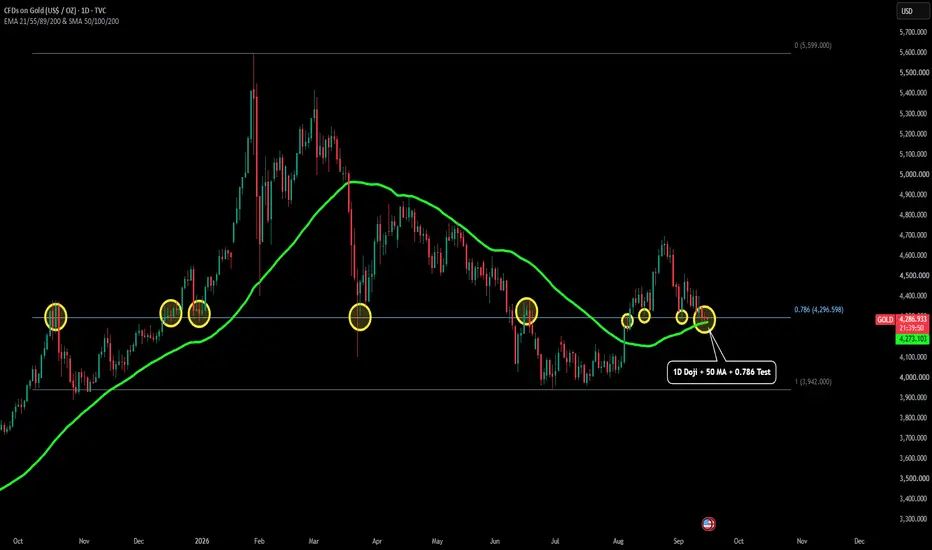
From a technical perspective, gold is currently sitting at a critical level where it looks poised to bounce. Price is trading around a key liquidity level I have outlined as the 0.786 Fibonacci from the range high in January to the recent range low in June. I have also extended this back to October 2025 to show many of the key tests gold has seen at this level (yellow circles). Price continues to respect this level with daily candle closes.
Price also printed a daily doji today, showing that within this downtrend, indecision is building and a reversal could be forming. In addition to that, bulls have been steadily defending the 50 moving average (green MA), with both yesterday's and today's lows holding above it. Because of all this, there are a number of technical signals beginning to suggest a low is forming here for gold, and another push to the upside could follow.
The Fundamental Setup
Tomorrow's FOMC decision carries the real weight. Markets are currently pricing in an 86% to 90% probability of a 25 basis point hike, raising the federal funds rate from 3.75% to 4%.
Traditionally, a rate hike is bearish for gold, since higher real yields raise the opportunity cost of holding a non-yielding asset. According to J.P. Morgan's own research, each single basis point increase in the 10-year real yield since late February 2026 has reduced gold prices by roughly $20 per ounce.
Major bank targets still sit above today's price regardless of tomorrow's outcome. Goldman Sachs holds a 2026 year end target of $4,900, JPMorgan sits at $4,500 for Q4, Bank of America's average target is $4,360, and HSBC's average sits at $4,560. These targets reflect a view that any near-term hike-driven weakness is more likely to be short-lived.
That said, if Warsh delivers a notably hawkish tone alongside the hike, real yields could move sharply higher and pressure gold meaningfully in the near term, which is the primary risk to be aware of heading into tomorrow.
However the outcome that would align with the technicals would come down to what is actually driving the move higher in yields right now. If tomorrow's inflation and yield backdrop is being driven primarily by rising inflation expectations, fueled by oil's recent breakout and hot CPI and PPI prints, rather than genuine strength in real growth, then real yields could stay flat or even fall even as the Fed hikes and the nominal 10-year holds above 5%. In that scenario, gold's traditional headwind from the rate decision itself would be far weaker than the headline hike suggests.
There is also a scenario where the hike itself is confirmed exactly as priced, but Warsh's tone during the press conference comes across as more balanced or data-dependent than markets expect. Since a hike at these odds is already almost fully priced in, the market's reaction is likely to hinge more on the forward guidance and press conference than the decision itself. A statement that leaves the door open to a pause afterward, paired with any acknowledgment that inflation risks are being driven by supply-side pressures like oil rather than demand overheating, could ease the pressure on real yields and give gold the room to rally on relief alone.
Others Factors
There are a couple of other things worth keeping in mind. First, gold is still in a bear market, so until proven otherwise, any push to the upside is still likely to fall short of the last high. I outlined this in my last gold post when price topped at $4,700. For more context, please review that idea here:
Once price is able to make a genuine higher high, it will be safer to start running through more bullish scenarios and what could come next for gold's trend from a momentum perspective.
Keep that in mind, but given the current structure forming, some form of bounce in line with tomorrow's FOMC decision looks likely. No matter what significant volatility is expected. XAUUSD H1: Bearish Continuation Toward Small OB After the FailedXAUUSD is currently trading around 4,292, showing limited recovery after a strong bearish displacement from the upper H1 structure.
The broader H1 market remains bearish, with multiple BOS confirming the downside structure. Price is trading below the EMA 20, 50, 100 and 200, while the descending trendline continues to act as overhead resistance.
Recent price action shows a weak recovery from the lower area around 4,260–4,275, where the marked Small OB is located. However, the current rebound has not yet reclaimed the nearby resistance structure, suggesting that bearish pressure remains present.
The next important area is the Small OB around 4,260–4,275. A break below this zone could expose further downside expansion. On the upside, the H1 OB around 4,380–4,400 remains the key recovery area, while the BSL Liquidity zone around 4,490–4,510 is a higher-timeframe liquidity reference.
The Bias: Short-Term Bearish Continuation / Potential Liquidity Sweep.
The Target Path: Price may first revisit the 4,260–4,275 Small OB. If this area fails to hold, further downside expansion could develop. A stronger recovery would require a reclaim of the 4,350–4,365 area, followed by a potential retest of the 4,380–4,400 OB.
Potential Setup: Observe price reaction around the current recovery structure and the 4,260–4,275 Small OB. A bearish displacement followed by a confirmed MSS/BOS could support a continuation scenario. Avoid assuming continuation without confirmation.
Confirmation: A clear break and acceptance below the Small OB, followed by a successful retest and bearish displacement, would strengthen the downside thesis. Alternatively, a bullish CHoCH and reclaim of nearby resistance would signal a possible recovery.
Alternative Scenario: If price holds the Small OB and develops strong bullish displacement, the short-term bearish structure may weaken. A reclaim above 4,350–4,365 could open a recovery toward the 4,380–4,400 OB.
Invalidation: Strong acceptance above the 4,380–4,400 H1 OB would weaken the immediate bearish continuation thesis and suggest that a deeper recovery may be developing.
Educational purposes only — Not financial advice. Short 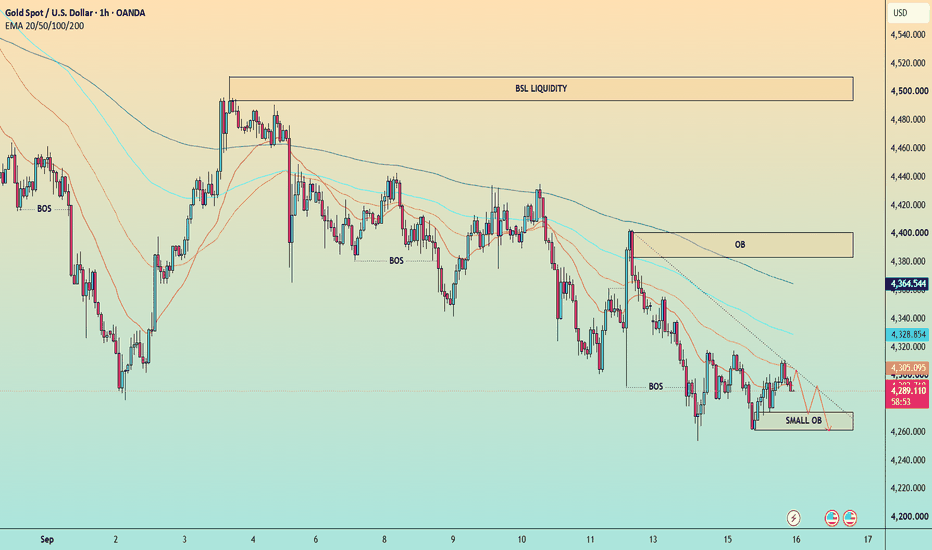
 Short
Short
Short 
XAUUSD — PROFESSIONAL TECHNICAL ANALYSIS📊 XAUUSD — PROFESSIONAL TECHNICAL ANALYSIS
Current Price: ~4,297
Structure: 🔄 Consolidation near resistance with an ascending trendline underneath.
🟢 BULLISH SCENARIO
Key breakout: 4,300.48
A confirmed candle close above 4,300.48 could open the way toward 4,308 → 4,316–4,320.
4,316–4,320 = Major Resistance Zone 🧱
Holding the rising trendline around 4,288–4,290 keeps the short-term bullish structure intact.
🔴 BEARISH SCENARIO
Failure to break 4,300.48 + rejection could bring price back toward 4,288–4,290.
A decisive break below the ascending trendline may expose 4,280 → 4,268–4,264.
4,264 = Major Support Zone 🛡️
🎯 KEY LEVELS
Resistance: 4,300.48 → 4,308 → 4,316–4,320
Support: 4,288–4,290 → 4,280 → 4,268–4,264
🧠 MARKET PLAN
Above 4,300.48: bullish continuation setup 📈
Below 4,288: bearish pressure increases 📉
Between 4,288–4,300: wait for confirmation ⚠️
TradingView-style note:
🔥 XAUUSD is testing key resistance while respecting the rising trendline. Wait for a confirmed breakout or breakdown before taking direction. No confirmation = no trade. BTC Futures: Two Simple Lines to Learn It AllBitcoin futures are trading at a decisive crossroads.
On the weekly CME Micro Bitcoin Futures chart, two long-term moving averages frame the entire market structure: the 260-week (5-year) SMA near $57,000 and the 104-week (2-year) SMA near $80,000. Between them lies the current battleground—and, arguably, the clearest high-level map for BTC traders.
The 260-week SMA is the five-year structural support line.
It has acted as a long-duration value anchor across several market regimes, absorbing prior selloffs and separating cyclical stress from a full-scale breakdown.
The area around $57,000 is therefore not merely a horizontal number; it is a macro support zone where longer-term demand may be expected to re-enter. A sustained weekly close below it would materially weaken the broader structure and put the market on thin ice.
Above price, the 104-week SMA near $80,000 is the key two-year resistance line.
BTC Futures are currently testing this zone from below after a rebound, but the market has not yet demonstrated acceptance above it. Until buyers can reclaim and hold the 104-week average on a weekly basis, rallies may remain vulnerable to supply returning into strength.
In market terms, the bulls need to take the lid off; otherwise, the $80,000 area can continue to function as a ceiling.
The RSI adds another layer.
Weekly RSI has rebounded from lower territory and is now moving toward the middle-to-upper part of its range. However, the longer-term descending RSI trajectory remains relevant. Momentum is improving, but it has not yet delivered an unmistakable breakout. A push above the declining RSI trendline would strengthen the case for a trend reversal; rejection near that line would suggest that the bounce is still corrective rather than impulsive.
The macro backdrop is not providing an easy tailwind.
Market pricing has recently shifted toward a higher probability of a Federal Reserve rate hike relative to either no change or easing. That matters because tighter financial conditions can pressure liquidity-sensitive assets, including crypto. Recent estimates put September hike odds around 60%, while rate-cut expectations have faded sharply.
The “Hormuz issue” also deserves attention.
Renewed disruption risks around the Strait of Hormuz have pushed Brent crude back above $90 per barrel, while U.S. diesel futures reportedly reached a 52-month high after rising roughly 51% over ten weeks. Higher energy prices can feed inflation expectations, complicate central-bank decisions, and keep risk assets facing a tougher macro tape.
Technically, the chart offers a straightforward playbook
Above $80,000 and holding: the path opens for a broader recovery and a challenge of higher resistance.
Between $57,000 and $80,000: expect a range-bound, headline-sensitive market with failed breakouts possible on both sides.
Below $57,000: the long-term support framework would be under pressure, increasing downside risk.
Summary Line
Two lines, one RSI, and one macro reality—BTC Futures remain trapped between long-term support and resistance, awaiting the catalyst that turns a range into a trend.
-
Best wishes,
Team @PandorraResearch
MASTER SUPPORT & RESISTANCE: 10 KEY MARKET CONCEPTSSupport and resistance are fundamental concepts in technical analysis and can help traders understand how price behaves around important market areas.
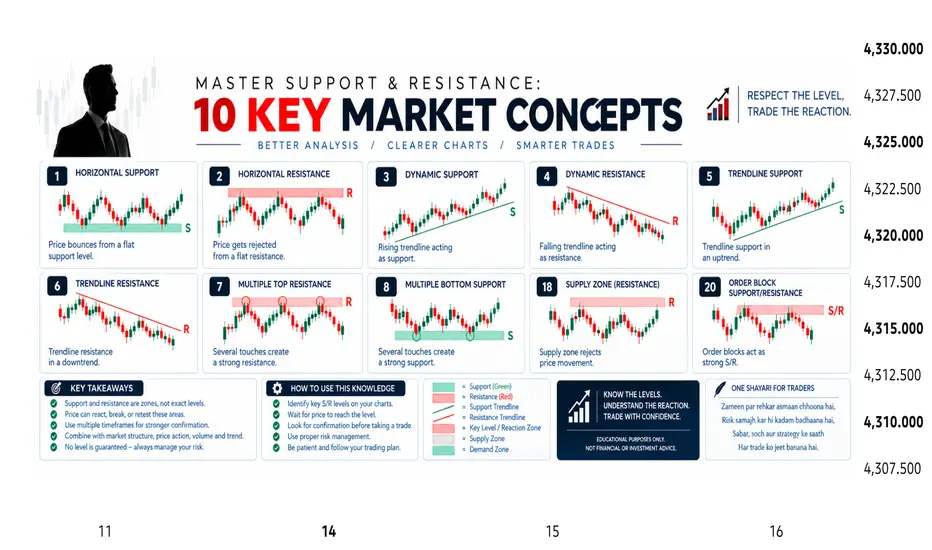
This educational chart presents 10 key support and resistance concepts, including horizontal support and resistance, dynamic levels, trendline support and resistance, multiple-top and multiple-bottom structures, supply zones, and order blocks.
A support level represents an area where buying interest may become stronger, while resistance represents an area where selling pressure may increase. However, these levels should not be viewed as guaranteed reversal points. Price can react, consolidate, break through, or retest an area depending on the broader market conditions.
One important principle is to treat support and resistance as zones rather than perfectly exact prices. Previous reactions, repeated tests, market structure, trend direction, and the timeframe being analyzed can all provide additional context.
Traders can also combine these concepts with price action and higher-timeframe analysis to better understand the market environment. A level that appears important on a lower timeframe may have less significance when viewed against the broader structure, while a well-established higher-timeframe area may deserve greater attention.
The purpose of this chart is to provide a simple visual reference for understanding different ways support and resistance can appear on a chart. It is intended to help traders recognize these structures and develop a more structured approach to technical analysis.
Remember that no individual support or resistance level guarantees a specific market reaction. Confirmation, context, patience, and appropriate risk management remain important when analyzing any market.
This publication is for educational purposes only and is not financial or investment advice. Always conduct your own research and analysis and consider the risks involved before making any trading decision.
Learn the structure • Understand the reaction • Manage your risk 📊 Education