DAX — week of July 20 – 24, 2026: SHORTShort — Two weeks ago the 26,064 'breakout' was a trap I called; last week the tape fade-and-flushed to 24,715, exactly where I mapped it.
Now it's coiled on the one number that matters, and almost nobody prints it: the weekly EMA (24,996), the weekly pivot (24,997), the 4H EMA (24,999) and the week's VWAP (24,950) are stacked inside a fifty-point knot at 24,950–25,000. Price is sitting one tick above the whole cluster, bouncing a limp +0.3% off Friday's 24,715 low. That knot is the hinge — not the obvious 26,000 top, not the round 25,000 the tourists circle. Above it sits a tight ceiling: R1 at 25,279 tucked under last week's 25,343 high, a 64-point band where every bull trapped at 26,000 waits to average down. I'm a seller into 25,279–25,343 for the trip back to 24,715 and the 24,651 pivot beneath it. The weekly MACD is still green (277 vs 226), but the histogram at +51 is the fading echo of a rally two weeks dead — collapsing toward zero, not building. I flip buyer only on a weekly close back above 25,343; that negates the lower high and reopens 25,625. The whole week hinges on Thursday's ECB — the release valve on the knot. Under 25,343, I sell the rip; I do not chase the hole.
THE BIG PICTURE (weekly)
For four months the DAX ran one way — off the March low near 22,200 in a near-vertical rip to a 26,064 high two weeks ago. That high was the top of a bull trap: the very next week opened 25,995 and got sold every session, and last week finished the job — a lower high at 25,343, a fresh low at 24,715, closing 24,933, the second red weekly candle in a row. Two red weeks off an all-time-high failure isn't noise; it's the market changing hands. Now price is compressed onto a knot almost nobody watches: the weekly EMA 24,996, the weekly pivot 24,997, the 4H EMA 24,999 and the week's VWAP 24,950 all stacked inside fifty points. That is the fulcrum of the entire tape. Hold it on a weekly-close basis and the four-month uptrend survives for one more crack at 25,343 and the 25,625 pivot; lose it and the two-week pullback turns to distribution, opening 24,651, then 24,369. The weekly MACD (277 vs 226) is still nominally positive, but the histogram at +51 is the dying echo of a rally already two weeks in the grave. The week's range budget is 885 points of ATR — enough for a full round-trip of this knot in either direction, which is exactly what a live ECB Thursday is built to deliver.
THE SWING (daily)
Read the daily and stop guessing. Last week bled in a straight line — Wednesday closed 25,127, Thursday 24,977, Friday 24,933, each lower, Friday tagging the low at 24,715 before a weak bounce. That's not a base; it's a staircase down that paused at the 24,715 shelf, which held just 64 points above the 24,651 weekly S1. Today opened 24,977 and reclaimed 25,010 — back above the 24,950–25,000 knot, but that's a bounce inside a pullback, not a breakout. The line is the 25,279–25,343 band: R1 stacked under last week's high, where every seller from the 26,064 trap is parked. Fade the rally into it and target 24,715, then the 24,651 S1; lose 24,651 and 24,369 is the air pocket beneath. Only a weekly close back above 25,343 reclaims the chair for the bulls and puts 25,625 in play. Buying this bounce into resistance, one tick above a knot the whole market is leaning on, is how tourists hand sellers their exit.
THE WEEK'S MAP (4H)
Upside: 25,279 (weekly R1) → 25,343 (last week's high) → 25,625 (weekly R2) → 25,907 (weekly R3) → 25,978 / 26,064 (failed-breakout ceiling) — the supply to fade; a weekly close above 25,343 flips it bullish toward 25,625.
Downside: 24,950 (VWAP) → 24,715 (Friday low / PWL) → 24,651 (weekly S1) → 24,369 (weekly S2) → 24,023 (weekly S3, stretch) — the target ladder while 25,343 caps.
One number all week: 24,997 — the weekly pivot, buried in a four-way knot with the weekly EMA (24,996), the 4H EMA (24,999) and the week's VWAP (24,950), all inside fifty points. Price sits one tick above it after two red weeks off the 26,064 failure. Sellers own the 25,279–25,343 shelf; fade the rally into it and target 24,715, then the 24,651 S1 and 24,369 beneath. A weekly close back above 25,343 negates the lower high and hands bulls 25,625 — until then, under 25,343, sell the bounce and don't chase the hole. Thursday's ECB is the whip.
THE CATALYSTS (CET)
Mon 20 — No Tier-1 EU data. Dead-quiet open; the tape digests its own two-week failure, not the calendar.
Tue 21 — Buba President Nagel speaks 13:30 CET (low impact). The only EU noise before the ECB; light.
Wed 22 — No Tier-1 EU data. Positioning day into the decision; the knot coils tighter.
Thu 23 — ECB rate decision 14:15 CET + Lagarde press conference 14:45 CET. THE whip of the week — a dovish tilt squeezes shorts into 25,343/25,625, a hawkish hold hands sellers the 24,715 break.
Fri 24 — French Flash PMIs 09:15 CET + German Flash PMIs 09:30 CET. Growth check the morning after the ECB — a weak German print confirms the fade, a hot one caps the drop.
BOTTOM LINE
Two weeks ago I called the 26,064 breakout a trap; last week the tape fade-and-flushed to 24,715, exactly where the map said. Now the DAX is coiled on the one number that matters and almost nobody's watching — a four-way knot where the weekly EMA (24,996), the weekly pivot (24,997), the 4H EMA (24,999) and the week's VWAP (24,950) stack inside fifty points. Price is one tick above it, bouncing a limp +0.3% off Friday's low after two straight red weekly candles off an all-time-high failure. That knot is the fulcrum, not the obvious 26,000 top. Above it sits the seller's shelf: R1 at 25,279 tucked under last week's 25,343 high, a 64-point band where every bull trapped at 26,000 is waiting to average down. The play is clean — fade the rally into 25,279–25,343 and target 24,715, then the 24,651 S1 and 24,369 beneath. The weekly MACD is still green but the histogram is the dying echo of a rally two weeks in the grave. I don't flip buyer until a weekly close reclaims 25,343 and reopens 25,625. And the whole week hinges on Thursday's ECB — the release valve on the knot: dovish squeezes the shorts into the shelf, hawkish hands them the 24,715 break on a plate. Trade the level, not the nostalgia — under 25,343, sell the rip and don't chase the hole.
Not advice — trade your own plan.
Futures market
XAUUSD: Rebound within downtrend channel, downside risk remains!XAUUSD is trading around 4,020 and remains within an H1 downtrend channel. The current rebound is approaching a confluence zone formed by the channel's upper boundary, a cluster of moving averages, and the 4,035–4,065 resistance area; thus, conditions for a confirmed reversal are not yet met.
Trading Plan
Short observation zone: 4,035–4,065
Confirmation: Bearish rejection or an H1 close below 3,990
Primary target: 3,960
Invalidation: Firm H1 close above 4,075 and exit from the downtrend channel
Early-week macroeconomic factors are also pressuring gold: oil prices have surpassed $90, the USD has edged higher, and expectations of sustained high interest rates are increasing the opportunity cost of holding the precious metal.
If the price tests the resistance zone but shows a bearish rejection candle, sellers could drive the market back to 3,985, followed by a test of the 3,960–3,975 support zone.
Avoid chasing short positions near support levels. A clearer setup will only emerge if the price rallies to the resistance zone and confirms a return of selling pressure.
Canadian Dollar Futures: Inflation Breakout TestToday's 6C setup is about whether Canadian inflation can force a clean CAD break rather than another hold of the USD/CAD base. The spot reference is simple: 1.40 is the line the market has been defending.
Where the edge is
The edge is event timing, not a medium-term macro call. Last week's BoC message keeps inflation and oil pass-through central to CAD pricing, while oil support keeps CAD demand alive if the post-release break holds.
Evidence
Canada's inflation figures are due today at 1:30pm London. The BoC held at 2.25% on July 15 and said inflation should ease gradually, but warned it would not let higher oil prices become persistent inflation. That makes this a real CAD catalyst.
Trade idea
For 6C, stay conditional into the release and favour CAD only if the post-CPI move confirms acceptance beyond the decision area. If USD/CAD preserves its base after the data, the 6C continuation idea loses its edge.
--------------------
When charting futures, the data provided could be delayed. Traders working with the ticker symbols discussed in this idea may prefer to use CME Group real-time data plan on TradingView: tradingview.com/cme/ .
This consideration is particularly important for shorter-term traders, whereas it may be less critical for those focused on longer-term trading strategies.
General Disclaimer:
The trade ideas presented herein are solely for illustrative purposes forming a part of a case study intended to demonstrate key principles in risk management within the context of the specific market scenarios discussed. These ideas are not to be interpreted as investment recommendations or financial advice. They do not endorse or promote any specific trading strategies, financial products, or services. The information provided is based on data believed to be reliable. However, its accuracy or completeness cannot be guaranteed. Trading in financial markets involves risks, including the potential loss of principal. Each individual should conduct their own research and consult with professional financial advisors before making any investment decisions. The author or publisher of this content bears no responsibility for any actions taken based on the information provided or for any resultant financial or other losses.
XAUUSD Weekly Outlook | Key Levels & Trading Zones for the Week New trading zones and key levels for the week ahead.
The first level to watch is 4030, our immediate resistance. A clean break and hold above this level would open the way towards 4068, with 4099 coming into focus if bullish momentum continues.
Price has also reclaimed the 50 MA, which is now acting as dynamic support. However, the 200 MA remains overhead, keeping the broader bearish pressure intact.
4127 is the key resistance for the week. A decisive break above this level would shift the outlook further to the upside, opening 4181 followed by 4237.
On the downside, 3981 is the immediate support to watch. If this level gives way, the 3926-3883 support zone will come into focus, where we will be watching closely for price reaction
📌Key levels to watch:
Resistance:
4030
4068
4099
4127
Support:
3981
3926
3848
👉Let levels guide you, wait for confirmation.
# XAUUSD Week W29-2026: Gold Breaks Below $4,000 as US-Iran..# XAUUSD Week W29-2026: Gold Breaks Below $4,000 as US-Iran Conflict Fuels Fed Rate-Hike Bets, Wiping Out Bulls Despite a Dovish CPI Print | 20 July 2026
**Reference data** | week 2026-W29
- Symbol: XAUUSD
- Week: 2026-W29
- Bias: bullish
- Conviction: low
- Regime: trending_down
- FX implication: trend_follow
- MTF alignment: all_bearish
- VWAP weekly: 4037.867666331041
- TrendSL weekly: 4522.1999510000005
- Close price: 3992.199951
- US 10Y yield: 4.57%
- US 2Y yield: 4.16%
- US 10Y real yield: 2.35%
- DXY: bias=bearish, close_price=100.766998
- CPI (USD): forecast=0.2, actual=0.0 (miss)
## L0 - Regime Identification
The immediate news backdrop is doing real damage to gold this week. According to verified reporting: gold has broken below the $4,000 psychological level as the US-Iran conflict fuels Fed rate-hike bets; oil prices have surged above Brent on the same conflict, reinforcing higher-for-longer fears; and gold is on track for its biggest weekly loss in six weeks. The war-driven inflation narrative is actively overshadowing any dovish macro signal -- gold fell even as Middle East escalation intensified, because the market read the geopolitical shock through an inflation lens rather than a safe-haven lens.
The regime is classified as trending_down with moderate confidence. This is not a choppy, range-bound environment -- it is a directional sell-off. Compared to prior weeks, the breakdown below $4,000 represents a meaningful deterioration in structure. The FX implication is trend_follow, meaning the path of least resistance remains lower until a credible reversal signal emerges. All multi-timeframe indicators are aligned bearishly, which is a rare degree of internal consistency and should not be dismissed.
## L1 - Driver Stack
Bullish factors:
-> **COT positioning (bullish, moderate weight):** Commitment of Traders data shows net speculative positioning leaning bullish. This matters as a contrarian cushion -- crowded short positioning could trigger a squeeze -- but alone it is not a trend-reversal catalyst.
-> **CPI miss (bullish, moderate weight):** Core CPI (MoM) printed 0.0% against a 0.2% forecast, a clean downside miss. Under normal conditions this would support dovish Fed repricing, weaker USD, and higher gold. The signal is real but is currently being overpowered by the geopolitical inflation narrative.
-> **Technical score (bullish, noted but context-dependent):** The rule engine flags a bullish technical contribution. However, with price trading below the weekly VWAP at 4037.87 and well below the weekly trend stop-loss at 4522.20, this signal carries limited weight in a trending-down regime.
-> **DXY weakness (supportive):** DXY closed at 100.77 with a bearish bias and low conviction. A weak dollar is structurally supportive for gold priced in USD. Again, this is a tailwind that is not currently able to offset the dominant bearish flow.
Bearish factors (regime-dominant):
-> **All-timeframe bearish alignment (strongest factor):** MTF alignment is all_bearish. This is the most important signal in the stack. When every timeframe agrees on direction, fading that consensus requires exceptional evidence.
-> **War-driven rate-hike repricing:** The market is interpreting the US-Iran conflict as inflationary, boosting expectations for Fed tightening rather than easing. This directly pressures gold by raising the opportunity cost of holding a zero-yield asset.
-> **Break of $4,000 psychological level:** Psychological levels matter in gold markets because they anchor retail and institutional stop clusters. A sustained close below $4,000 invites further systematic selling.
-> **Price below weekly VWAP (4037.87):** Current close at 3992.20 is below the weekly VWAP, which confirms short-term momentum is running against any bullish thesis.
## L2 - Macro Snapshot
The macro picture this week is genuinely conflicted, and that conflict is worth unpacking carefully rather than resolving artificially.
On the dovish side: Core CPI (MoM, USD, released 2026-07-14) came in at 0.0% actual versus a 0.2% forecast and a prior reading of 0.2%. That is a clean miss. Under a conventional macro framework, a softer inflation print reduces the urgency for additional Fed tightening, compresses real rate expectations, and is typically USD-negative and gold-positive. The 10Y US Treasury yield sits at 4.57%, the 2Y at 4.16%, implying a modestly upward-sloping curve. The 10Y real yield stands at 2.35% -- this is an elevated level by historical standards. Real yields at 2.35% represent a meaningful carry cost for holding non-yielding gold, and until that figure moves materially lower, it acts as a structural headwind.
On the hawkish side: the geopolitical shock from the US-Iran conflict is being priced as inflationary rather than risk-off. Oil prices have surged, stoking higher-for-longer fears that override the CPI miss in the market's near-term calculus. The irony is that gold, which historically benefits from both inflation and geopolitical uncertainty, is currently being penalized because the specific inflation channel being activated (energy-led, supply-shock) raises terminal rate expectations rather than triggering safe-haven flows.
The net macro read: the CPI miss is a genuine dovish data point, but it is not yet strong enough to break the hawkish narrative being driven by oil and geopolitical risk premium. Watch whether subsequent data confirms the disinflationary trend.
## L3 - Technical Structure
Close price: 3992.20. Weekly VWAP: 4037.87. Weekly trend stop-loss: 4522.20.
Price is trading below the weekly VWAP, which is a straightforward bearish signal from a volume-weighted perspective -- the average weekly participant is now underwater, and that creates overhead supply as trapped longs look for exits on any rally back toward 4037.87.
The weekly trend stop-loss at 4522.20 is far above current price. This level is not a near-term consideration for directional trading but is the structural anchor for the bullish bias in the system -- it is the line that, if closed above on a weekly basis, would confirm the long-term uptrend structure remains intact. The current distance between close price (3992.20) and that stop (4522.20) -- over 530 points -- illustrates how much ground bulls have lost and how far a recovery would need to travel before the structural picture normalizes.
With MTF alignment all_bearish and price below VWAP, the technical picture confirms the bearish regime reading. There is no technical basis here to call a bottom.
## L4 - Intermarket Cross-Check
DXY closed at 100.77 with a bearish bias and low conviction. Under normal market conditions, a falling dollar is a direct tailwind for gold because gold is priced in USD -- dollar weakness mechanically increases gold's price in dollar terms and improves its relative value for non-USD buyers.
However, the relationship is currently distorted. Despite DXY softness, gold is breaking down. This is a notable intermarket divergence. It suggests the selling pressure in gold is not dollar-driven -- it is rate-expectation driven. The market is selling gold because it is pricing in higher Fed rates (driven by the inflationary war narrative and oil spike), not because the dollar itself is strengthening materially.
If DXY deteriorates further and rate-hike expectations begin to fade (for example, if a subsequent CPI print confirms the miss seen this week), the combination of dollar weakness and lower real yield expectations could reassert the traditional inverse correlation and provide a meaningful bid to gold. Until that alignment occurs, the intermarket signal is mixed rather than confirmatory for bulls.
## L5 - Event Risk
Key events and catalysts to monitor over the 3-week horizon:
-> Fed communication and rate-hike probability repricing following the CPI miss
-> Escalation or de-escalation in US-Iran conflict (primary driver of the current narrative)
-> Oil price trajectory -- a sustained surge above current levels would compound the higher-for-longer repricing
-> Any additional US inflation data (PPI, PCE) that either confirms or contradicts the CPI miss
-> WGC (World Gold Council) quarterly demand data -- central bank buying assumptions are flagged for periodic review when new data is available
| Scenario | Probability |
|---|---|
| Geopolitical escalation continues, rate-hike fears deepen, gold extends losses below 3992 | Higher probability given current regime |
| CPI miss is confirmed by follow-on data, Fed rhetoric softens, DXY weakens further -- gold stabilizes and recovers toward VWAP (4037.87) | Possible but not the base case this week |
| Rapid de-escalation of US-Iran conflict, oil reverses -- safe-haven demand for gold normalizes | Lower probability given entrenched narrative |
Note: probabilities are qualitative given the low conviction level on this thesis.
## L6 - Conviction Scorecard
Overall bias: **bullish**. Conviction level: **low**.
This is a structurally important tension to acknowledge explicitly rather than gloss over. The system's bias is bullish -- supported by COT data, the CPI miss, DXY weakness, and a longer-term technical contribution. But conviction is low, and it should be. The regime is trending_down. MTF alignment is all_bearish. Price is below weekly VWAP. The market is actively rejecting bullish catalysts this week and pricing geopolitical inflation risk instead.
Low conviction in a trending-down regime with all-bearish timeframe alignment is a signal to stand aside, not to initiate longs. The bullish bias represents a hypothesis about where conditions could turn, not a current entry signal. Any trader treating this as a buy signal without waiting for regime confirmation is taking on asymmetric risk against the prevailing trend.
No direct comparison to last week's conviction level is available in the brief, but the breakdown below $4,000 and the scale of the weekly loss (described as the largest in six weeks) are consistent with a deteriorating -- not improving -- conviction backdrop for bulls.
## L7 - Time Horizon
**Near-term (days to 1 week):** The path of least resistance is lower. Price is below VWAP (4037.87), regime is trending_down, and the geopolitical narrative is actively in control. Any bounce toward 4037.87 should be treated as a potential resistance retest, not a recovery, unless accompanied by a meaningful shift in the rate-hike narrative or a credible geopolitical ceasefire signal.
**Timeline (2-3 weeks, per stated horizon):** This is the window where the conflicting signals could begin to resolve. If subsequent inflation data confirms the CPI miss, Fed communication softens, and oil stabilizes, the macro conditions for a gold recovery improve materially. The 3-week horizon is long enough for sentiment to shift but short enough that a full trend reversal would require a catalyst, not just patience.
**Medium-term (beyond 3 weeks):** The structural bullish case for gold -- elevated real yields eventually pressuring the economy, dollar weakness, central bank demand -- remains a valid longer-term thesis. The weekly trend stop-loss at 4522.20 defines the level at which that structural bull case remains technically intact. A weekly close back above the VWAP (4037.87) would be the first step toward rebuilding confidence in that thesis.
## L8 - Invalidation Conditions
-> If weekly close below TrendSL weekly (4522.20): bullish structure invalidated -- exit longs, reassess
-> If price sustained below VWAP weekly (4037.87): short-term momentum against thesis -- reduce size
Note: price is already trading below VWAP weekly at 3992.20 as of this close. The second invalidation condition is already active. This is a direct, data-supported reason to reduce or avoid long exposure until price reclaims 4037.87 on a sustained basis.
---
*This analysis is for informational and educational purposes only and does not constitute financial advice.*
#XAUUSD #Gold #ForexTrading #CommodityTrading #FedRateHike #GoldAnalysis #MacroTrading #TechnicalAnalysis #DXY #RealYields #CPI #Geopolitics #USIranConflict #GoldPrice #TradingView
How To Trade Smarter With AI!AI can scan charts, summarize data and highlight possible setups faster than most traders. But a confident signal is still only a hypothesis, not confirmation.
Imagine an AI tool produces a BUY signal with 92% confidence while price is approaching a major resistance zone. The number looks convincing, but the chart tells a different story: buyers push above resistance briefly, fail to hold the breakout and close back below the zone.
The signal sounded certain, yet the market never accepted the higher price.
This is where traders must separate analysis assistance from decision responsibility. AI does not feel the spread widening, understand every change in market conditions or take responsibility when the trade reaches invalidation.
It can recognize patterns from available information, but the trader still needs to verify structure, location and risk before committing capital.
Before following any AI-generated idea, read the chart independently. Is the signal aligned with the higher-timeframe structure? Is price entering from a meaningful area or running directly into resistance? Has the market confirmed the move with a decisive close and follow-through, or has it only produced a temporary wick?
Price action becomes more reliable when candles, structure and support or resistance are evaluated together rather than treated as isolated signals.
Risk must also be defined before entry. A trade without a clear invalidation level is not improved simply because an algorithm assigned it a high confidence score.
The position size should still be calculated from the distance to the stop, the potential reward must justify the risk, and the idea should be rejected when the chart no longer supports it.
AI is most useful as a second pair of eyes. Let it find possibilities, challenge your bias and speed up research, but never allow it to replace context, confirmation and discipline.
''AI can suggest the trade. The market must confirm it. You remain responsible for the risk.''
Good luck, Traders!
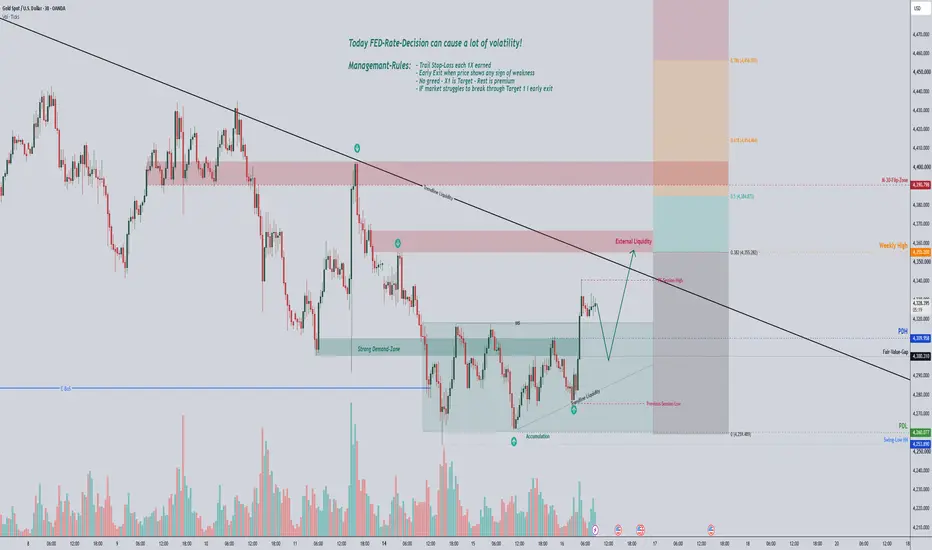
XAUUSD - M15 - SMC + OB Analysis
Market Observation
Gold is currently trading within a short-term retracement after a bearish impulse. Price is approaching a key institutional supply area where sellers may become active.
🔍 Key Levels
🟩 Primary Sell Zone: 4030–4038
🟩 Secondary Supply Zone: 4055–4068
🔻 Bearish Targets: 3990 → 3960
📌 What I'm Watching
Liquidity sweep into the marked supply.
CHoCH / MSS confirmation on lower timeframe.
Bearish BOS with displacement.
FVG retest for potential continuation.
📉 Bearish Scenario
If price rejects from the marked supply and confirms market structure, continuation toward lower liquidity remains possible.
📈 Bullish Scenario
If buyers gain acceptance above the higher supply zone with strong displacement, the bearish outlook weakens and a move toward higher liquidity becomes more likely.
⚠️ Invalidation
A sustained move above 4068 would invalidate my current bearish idea.
✅ Confluences Used
Smart Money Concepts (SMC)
Order Blocks
Market Structure
Liquidity
Supply & Demand
ICT Kill Zones
Risk-to-Reward Planning
This is my personal market observation, not financial advice. Always wait for confirmation and manage your risk.
#XAUUSD #Gold #GoldAnalysis #SMC #ICT #PriceAction #OrderBlock #Liquidity #CHOCH #BOS #FVG #SupplyAndDemand #TechnicalAnalysis #Forex #TradingView #DayTrading #SmartMoneyConcept #GoldTrading
XAU/USD (H1) Trading Plan - Update July 20, 20261. SELL Scenarios
Entry 1 (Immediate Resistance):4029 - 4032 (Previous peak & retest zone).
Stop Loss: 4042
Tải Profit 4005 / 3982
Entry 2 (Major FVG & Resistance):4050 - 4052 (Strong H1 FVG zone).
Stop Loss (SL): 4065
Take Profit (TP):4029 / 4005
2. BUY Scenarios
Entry 1 (Immediate Support):3980 - 3983(Recent CHoCH support level).
Stop Loss (SL): 3968
Take Profit (TP): 4005 / 4029
Entry 2 (Deep Support):3940 - 3943 (Strong key support level).
Stop Loss (SL):3928
Tải Profit (TP): 3960 / 3982
3. BREAKOUT Scenarios
To ensure a proper R:R ratio, do not chase the momentum. Wait for a confirmed Retest
Bullist Breakout:If an H1 candle closes firmly above 4030.
Entry (Retest):Wait for a pullback to 4025 - 4029.
Stop Loss (SL):4014
Take Profit (TP):4050 / 4074
Bearish Breakout: If an H1 candle closes firmly below the 3960 low.
Entry (Retest):Wait for a pullback to 3960 - 3964
Stop Loss (SL):3975
Take Profit (TP):3943 / 3923
*Good luck and manage your risk wisely!*
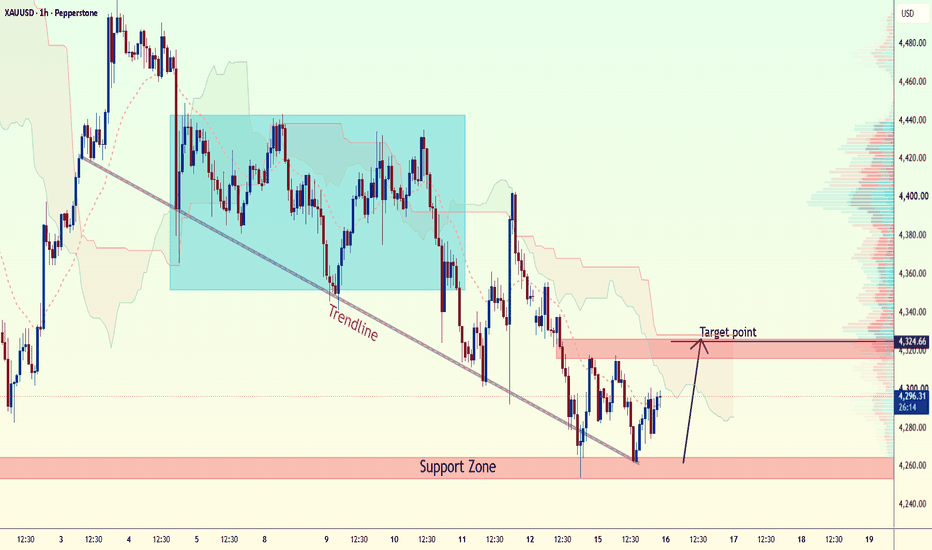
Gold Market OutlookSince **24th June**, Gold has successfully defended the **3,962** support level on **at least four occasions**, with last Friday's rebound providing yet another confirmation of strong buying interest at this key price zone.
On the **4-hour timeframe**, Gold has also been trading within a well-defined **descending channel (falling wedge)** over the past few weeks—a pattern that often precedes a significant breakout.
For now, the market remains in a consolidation phase between **3,962** (support) and **4,096** (resistance).
A sustained breakout above **4,096** would strengthen the bullish case, while a decisive break below **3,962** could signal a shift in the medium-term outlook.
Until then, patience remains key as we wait for the market to reveal its next directional move.
— From the Trading Desk of Investment Live
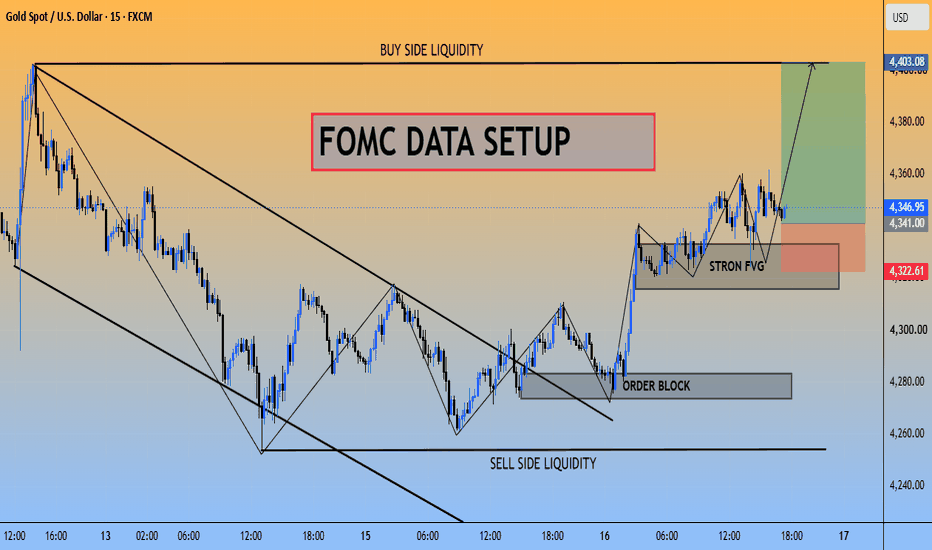
GOLD: Mapping the Liquidity Trap Now that the momentum has shifted, we don't chase. We just map our levels and wait for the pullback.
Right now, Gold is doing exactly that—a slow, healthy correction back to the origin of that explosive move. My main area of interest is the demand zone sitting right at the psychological 3995 - 4000 level.
Why Confirmation is Everything:
I am not setting blind limit orders here. Since the higher timeframe macro trend is still bearish, we have to protect our capital.
A zone is just a place to pay attention, not an excuse to blindly buy. I’m going to let price tap into that 3995-4000 area and sit on my hands until I see lower timeframe (5m or 15m) confirmation. I want to see buyers actually stepping in—look for a structural shift, strong rejection wicks, or a sudden burst of volume.
If it just dumps straight through 4000 with heavy red candles? We stay out. No harm done.
The Outlook:
If we get that confirmation, the logical draw for price is the recent local highs around 4025, and eventually the equal highs at 4050. (If price closes below 3975, the setup is completely invalidated).
Patience pays. Map your levels and let the market do the heavy lifting. 🤝
Gold Continues Under Pressure amid Hawkish FedGold (XAU/USD) struggled to capitalise on its daily rebound and traded stuck around the psychological level of $4,000 per troy ounce ahead of the European session opening on Monday. The precious metal's technical recovery was severely hampered by the resurgence of the US dollar (USD), which was supported by the kinetic military escalation in the Middle East and growing expectations of Federal Reserve monetary tightening.
----------------------------------------------------------------------------------------------------------
✅ Geopolitics Explodes: 9th Night of Strikes, US Soldier Deaths & Iranian Missiles in 4 Countries
The military situation in the Gulf region is entering a phase of open regional kinetic warfare:
- ⚡9th Night of Revenge: US Central Command (CENTCOM) completed a wave of airstrikes for the ninth consecutive night on Sunday. President Donald Trump publicly asserted that these intensive strikes were launched to honour US military personnel killed in Iraq.
- ⚡Serial Missile War in 4 Countries: Tehran responded instantly by firing a wave of ballistic missiles and kamikaze drones. The governments of Bahrain, Jordan, Kuwait, and Iraq have officially confirmed that their territories were hit by Iranian missile blasts.
- ⚡Crude Oil Prices Peak (Highest Since June 12): The combination of the US naval blockade of Iranian ports and the IRGC's aggressive surveillance of the Strait of Hormuz pushed crude oil prices to their highest levels since June 12. The threat of exogenous inflation (energy-driven inflation) automatically increases demand for the US dollar as a safe haven.
----------------------------------------------------------------------------------------------------------
✅ XAU/USD Technical Analysis (Intraday)
Technically, gold prices are stuck in a tight compression pattern around the psychological level of $4,000, where any corrective rally (relief rally) is vulnerable to fading:
- ⚡Fading the Rally Pattern: The current macroeconomic fundamentals are tilted strongly in favor of XAU/USD sellers. It would be prudent to wait for a strong follow-through buying action (sustained breakout) above $4,050 before confirming that gold has formed a short-term bottom (bottoming out).
- ⚡Risk of $3,970 Floor Collapse: As long as gold remains below $4,050, the XAU/USD pair appears vulnerable to being dragged down towards a retest of the $3,970 intraday support level, before opening the way towards the current year's trough in the $3,942-$3,943 area.
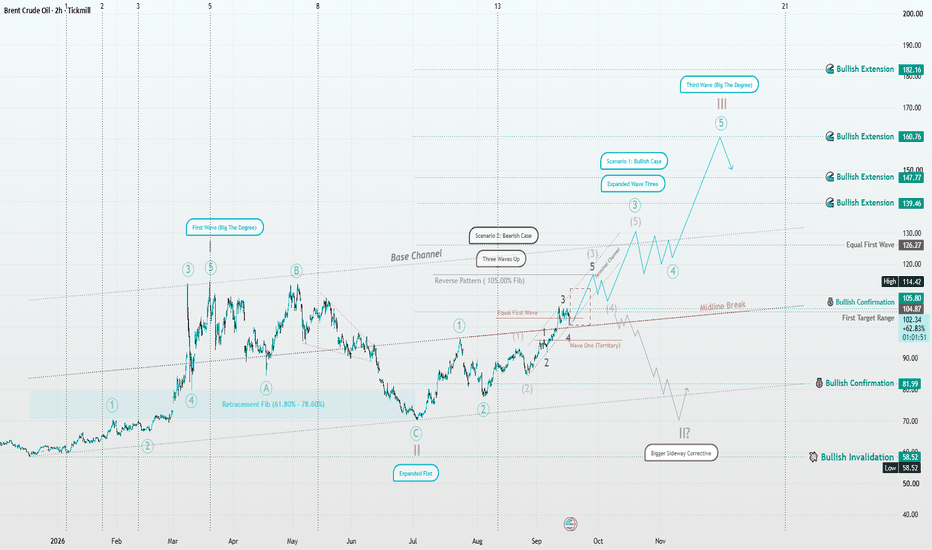
USOIL Price Outlook – Trade Setup🌐Macro Background
A sharp escalation in geopolitical tensions has acted as the primary catalyst driving the recent surge in oil prices. As conflicts between the US and Iran intensify, market anxieties over potential energy supply disruptions in the Middle East have been reignited.
Amid this environment, crude oil has emerged as a clear outperformer, climbing to its highest level in more than a month. Concurrently, surging oil prices have renewed global anxieties over a potential resurgence of inflation.
📊Technical Structure
Since bottoming out near $68.00 at the beginning of July, USOIL has carved out a highly textbook ascending channel, characterized by a series of higher highs and higher lows.
Support Zone (Resistance-turned-Support): The area between $81.02 and $82.59 previously acted as a prominent resistance zone.
Upside Target (Resistance Zone): The next strategic objective for the bulls points directly to the dense overhead congestion zone between $87.61 and $89.12.
🎯Trade Setup
Driven by the confluence of bullish technical patterns and supportive macro fundamentals, a buy-on-retest strategy is favored for the week:
Entry Point: Look for buying opportunities on a price pullback toward $82.59 (the upper edge of the support zone) or upon signs of stabilization within the $81.02 – $82.59 range.
❌Invalidation
If unexpected headlines emerge indicating a sudden de-escalation of geopolitical tensions, causing oil prices to drop sharply on high volume below the lower bound of the support zone at $81.02.
📝Trade Summary
Go Long on USOIL near $82.59, targeting $87.61 – $89.12, as the 4H ascending channel breakout aligns with escalating US-Iran tensions and supply risks at the Strait of Hormuz (Stop Loss below $80.50).
⚠️Disclaimer
This analysis is for reference only and does not constitute trading advice. Financial markets involve significant risk; proper risk and position management are essential.
USOIL: Strong Rally on Hormuz Risk — Long Setup After Pullback🎯 Trade setup:
Direction: Long from pullback
🔻 Entry: 7,750–7,850
🛑 Stop Loss: 7,550
🎯 Take Profit 1: 8,150
🎯 Take Profit 2: 8,400
📰 News:
Oil is rallying sharply as the U.S.–Iran conflict escalates again around the Strait of Hormuz. Reports say the U.S. restored a naval blockade near Iranian ports, while Iran claimed the strait is closed and tanker traffic has been disrupted. This pushed WTI higher as traders price in a stronger geopolitical risk premium.
The main market concern is supply disruption. If Hormuz flows remain unstable, oil may stay supported and inflation expectations could rise again. That also keeps pressure on central banks and risk assets.
📊 Analysis:
On the 1H chart, USOIL is in a strong bullish impulse after breaking above the 7,060–7,200 zone. Price is now trading near 8,060, above EMA 9, EMA 20, SMA 50 and SMA 200, confirming strong bullish momentum.
However, RSI is elevated and MACD is already stretched, so buying directly at highs is risky. The better setup is to wait for a pullback toward support.
Scenario:
If USOIL holds above 7,750–7,850, buyers may continue pushing the price toward 8,150 and 8,400.
A bearish scenario starts if price breaks below 7,550. In that case, the rally may turn into a deeper correction toward 7,275–7,215.
⚠️ Not financial advice.
XAU/USD 20 July 2026 Intraday AnalysisH4 Analysis:
-> Swing: Bullish.
-> Internal: Bearish.
Bias and analysis to remain the same as analysis dated 30 June 2026.
Price did not print bullish CHoCH to indicate bullish pullback phase initiation. Price instead printed a new low followed by a bullish CHoCH
Price is currently trading within and established internal range, however, I will continue to monitor price with respect to depth of pullback.
Intraday expectation:
Price to trade up to either premium of internal 50% EQ, or H4 demand zone before targeting weak internal low, currently priced at 3,942.100.
Note:
Gold remains volatile as tensions between the US, Israel, and Iran keep safe‑haven demand elevated.
Markets are reacting quickly to every headline, while uncertainty around the Fed’s easing path and shifting U.S. policy under President Trump, especially tariffs continues to fuel choppy price action.
For newer traders, the key is simple, stay flexible and manage risk carefully, as fast spikes and sudden reversals are a normal part of the current XAU/USD environment.
H4 Chart:
M15 Analysis:
-> Swing: Bearish.
-> Internal: Bearish.
Price has printed according to analysis dated 14 July 2026 where I mentioned price to trade up to either premium of internal 50% EQ, or M15 demand zone before targeting weak internal low, priced at 3,983.545. This is how price printed.
Price has subsequently printed a bullish CHoCH to indicate bullish pullback phase initiation. Price has since printed lower. Depth of pullback has been insignificant, therefore, I will not classify the bearish iBOS, however, I have marked this in red for illustration purposes.
Price has since printed a further bullish CHoCH and once again price is trading within an established internal range, however, I shall again monitor price action with regards to depth of pullback.
Intraday expectation:
Price to trade up to either premium of internal 50% EQ, or M15 demand zone before targeting weak internal low, priced at 3,959.800.
Note:
Gold remains highly reactive on M15 as geopolitical risk continues to drive quick, headline‑led moves.
The tension between the US, Israel, and Iran is keeping safe‑haven demand elevated, with markets still sensitive to any sign of escalation.
At the same time, shifting US tariff policy under President Trump is adding extra uncertainty, fuelling sharp intraday swings and increasing the likelihood of sudden sentiment flips. Liquidity pockets and whipsaws remain common, making disciplined risk management essential.
Gold’s geopolitical premium is still firmly in place, and until tensions ease, short‑term volatility is likely to stay front‑loaded.
M15 Chart:
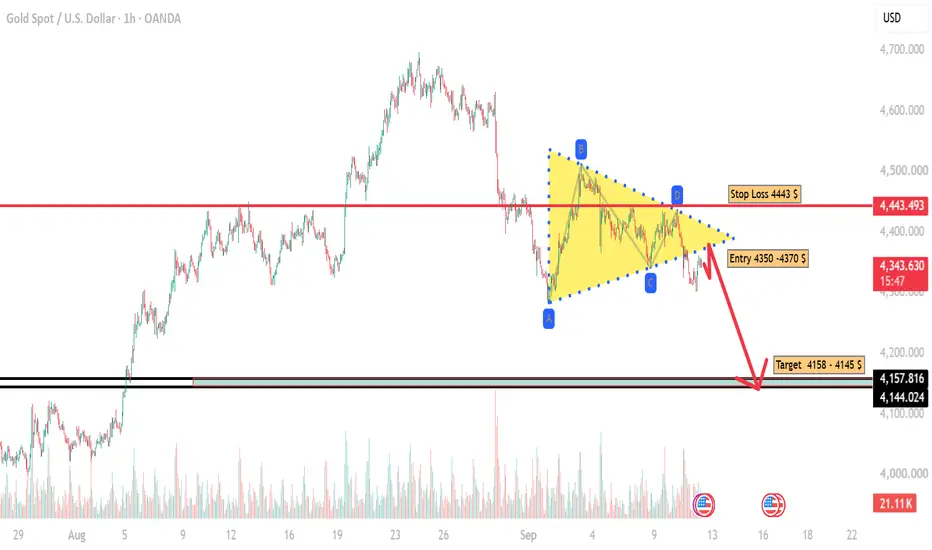
Gold projection Price has been moving in a clear downtrend since early July, repeatedly getting rejected by a steep descending trendline (dynamic resistance).
If price breaks and closes below 4040, it confirms rejection from the dynamic resistance and opens the path for trend continuation.
Strong bullish close above 4075 would cancel the short bias and shift focus toward 4120.
ES H1: Hold 7,478 or Fall to 7,410?▪️ ES H1 SNAPSHOT — EXECUTIVE SUMMARY
▪️ the S&P 500 is basing near 7,492, leaning on a shelf that buyers have repeatedly defended. Structure is coiling, with a firm floor beneath price and a stack of supply overhead.
▪️ Primary outlook remains sideways trading — 7,478 is the line in the sand. Defended, it keeps the recovery intact; if broken, it hands the initiative back to sellers.
▪️ Key resistance zone: 7,537, tagged 35 times and likely to cap the first attempt. Clear it and 7,574 comes into play, with 7,631 beyond.
▪️ Major defense line: 7,478 — a strong level at 14 retests. As long as it caps the downside, dips are for buying, not chasing.
▪️ Primary downside targets if it cracks: 7,410, followed by 7,358, where resting liquidity sits.
▪️ Major liquidity magnet below: 7,410–7,358 — a test here tends to draw a sharp reaction.
▪️ Bullish scenario: Reclaim 7,537 and the balance shifts higher toward 7,574, with 7,631 beyond.
▪️ KEY LEVELS
▪️ Current Price: 7,492
RESISTANCEs
▪️ 7,631 — ★★★★ 8.5 Very Strong · 8 retests
▪️ 7,574 — ★★★★ 8.0 Very Strong · 30 retests
▪️ 7,537 — ★★ 6.9 Moderate · 35 retests
SUPPORTs
▪️ 7,478 — ★★★ 7.7 Strong · 14 retests
▪️ 7,410 — ★ 5.4 Weak · 27 retests
▪️ 7,358 — ★★ 6.2 Moderate · 10 retests
▪️ ProjectSyndicate Levels Desk — Overview of key S/R zones for ES, NVDA, NQ, GC & GBPUSD traders every week. Subscribe to stay up to date with the latest levels.
UKOIL BULLISH BIASThe protracted Iran-US conflict and the blockade imposed on the Strait caused oil prices to rise sharply early in the year. The demand for crude oil and the resultant supply shocks caused the rise in price to create market imbalance that required correction. Presently, price has contacted a demand zone and a price reaction on the daily charts indicate a change in market structure. On the Daily charts, we have a buy limit at 73.5 and exit positioned at 90.36. From supply and demand, there exists price imbalance at 62,101 and 122 price levels that could act as future price entry or exits.
Can Euro Futures Unlock Global Success?The world faces unprecedented volatility today. Investors and leaders must adapt quickly. Euro futures offer a powerful financial tool. They help professionals navigate shifting global markets. Let us explore their immense impact across diverse sectors.
Geopolitics and Geostrategy
Recent conflicts constantly redefine international relations. The Middle East crisis directly disrupts global energy markets. Hostilities in the Strait of Hormuz spike European inflation. Nations scramble to secure reliable energy supplies. Consequently, Euro futures reflect this intense geopolitical tension. Traders use them to price strategic risks. Geopolitics dictate currency strength more than ever before. European energy dependency drives these massive currency fluctuations.
Macroeconomics and Economics
Central banks drive major global currency movements. The European Central Bank recently hiked rates. They relentlessly fight inflation fueled by energy shocks. Meanwhile, the Federal Reserve faces slowing job growth. Chairman Kevin Warsh maintains a hawkish stance. Yet, weak employment data stalls further tightening. These diverging policies create immense Euro volatility. Investors leverage Euro futures to hedge these macroeconomic risks. Economic stability relies on precise currency forecasting.
Industry Trends and Business Models
Global supply chains face continuous market disruption. Businesses must rethink their foundational operating models. Extreme currency fluctuations destroy profit margins overnight. Savvy companies integrate Euro futures into their strategies. This integration protects revenue from sudden exchange rate shifts. Modern business models demand robust financial hedging. Flexibility now defines successful global industry trends. Firms that ignore currency risks will ultimately fail.
Management and Leadership
Effective leadership requires decisive and immediate risk management. Executives face immense pressure to protect corporate assets. They cannot leave currency exposure to chance. Top managers actively trade Euro futures. They lock in favorable rates to secure corporate budgets. This proactive stance defines modern financial leadership. Weak leaders ignore these vital financial instruments. Strong leaders use them to ensure long-term stability.
Company Culture and Innovation
A volatile Euro demands a resilient corporate culture. Teams must pivot quickly when market dynamics change. Agile companies foster relentless financial innovation. They train employees to understand global market forces. This awareness drives smarter operational decisions. A culture of vigilance protects the bottom line. Financial literacy sparks broader innovative thinking. Teams design better products when budgets remain secure.
Technology and Cybersecurity
Trading Euro futures relies on advanced technology. Algorithms execute massive trades in mere milliseconds. This high-speed environment attracts sophisticated cybercriminals. State-sponsored hackers target critical financial infrastructure. They exploit geopolitical chaos to steal valuable data. Financial institutions must deploy cutting-edge cybersecurity defenses. Strong encryption protects vital trading algorithms. Technology secures the very foundation of modern currency markets.
Pharmaceuticals and Science
The pharmaceutical industry operates on a massive global scale. European drug manufacturers heavily export to America. Currency fluctuations drastically impact their total revenues. Euro futures allow these giants to hedge profits. Stable revenues fund vital scientific research. Unpredictable exchange rates threaten long-term clinical trials. Hedging ensures life-saving science continues without interruption. Financial foresight directly supports global health initiatives.
High-Tech and Patent Analysis
High-tech firms constantly battle for global market share. R&D investments depend on stable currency values. A weak Euro makes European patents cheaper abroad. Companies strategically file patents based on these shifting costs. Euro futures help tech firms predict future expenses. They protect budgets allocated for intellectual property. Smart patent analysis requires accurate currency forecasting. Financial tools therefore drive technological dominance.
Conclusion
Euro futures represent more than mere financial instruments. They act as vital barometers for global stability. From geopolitics to life-saving pharmaceuticals, their impact expands everywhere. Astute professionals must understand these powerful tools. Mastery of currency markets ensures future global success.
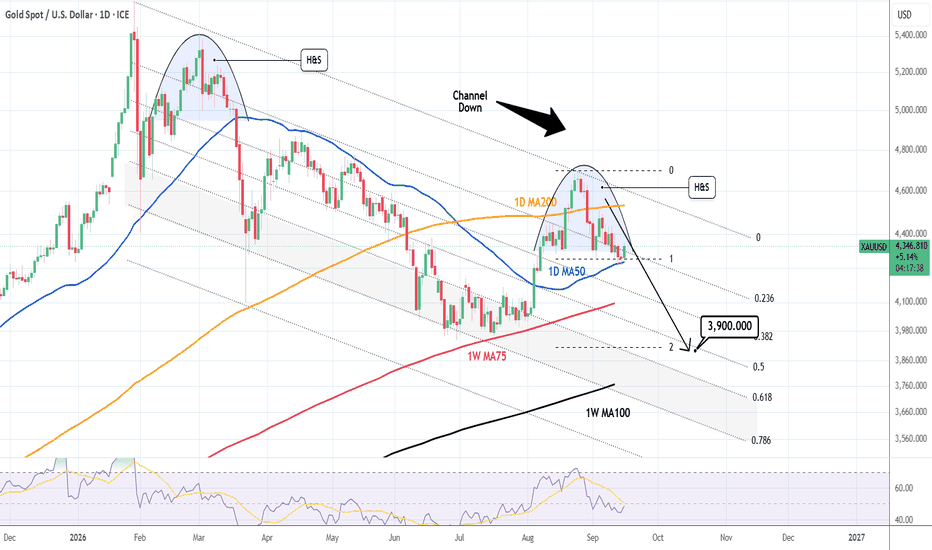
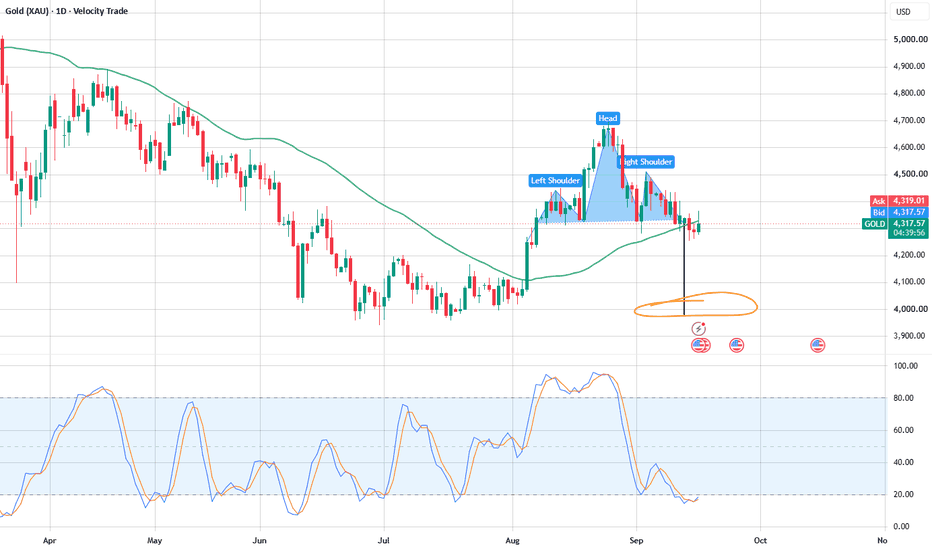
Gold Analysis - Bears Eye 3887 Daily Support?Gold remains under bearish pressure even though price has managed to recover from recent lows. The current rebound is approaching a strong confluence resistance area around 4020-4040 where the descending trendline, previous structure and FIB levels are aligned. This zone is likely to attract fresh selling interest unless buyers can produce a strong breakout. As long as gold continues making lower highs below the major resistance at 4120, the overall short-term bias remains bearish. A bearish rejection or lower high from the current resistance area could trigger another decline toward the recent lows with sellers aiming for the daily support zone near 3887.
Trade Plan - Sell Setup
Sell Zone: 4020-4040
Targets: 3983, 3940, 3924
Extended Target: 3887 (Daily Support)
Invalidation: H4 close above 4120. A sustained break above this level would weaken the bearish outlook and could open the door for a move toward 4136-4160.
Trade Plan - Buy Setup
Sell Zone: 3960-3983
Targets: 4015, 4040, 4060, 4085
Extended Target: 4120 (Daily Support)
Invalidation: H1-H4 close below 3940. A sustained break below this level would increase bearish momentum and could expose 3924 and 3887 (Daily Support).
Note
Please risk management in trading is a Key so use your money accordingly. If you like the idea then please like and boost. Thank you and Good Luck!