XAUUSD Is About to Make Its Next Big Move... But Which Way?
OANDA:XAUUSD is sitting right below a major resistance around 4008–4015, and buyers are still holding the higher lows. The trend is leaning bullish, but momentum is slowing as price compresses under resistance.
My plan:
💛 If we get a clean breakout and retest above 4015 → I'll look for longs.
💛 If price sweeps the highs then rejects with a market structure shift → Shorts become interesting.
💛 If we dip into 3995 and buyers step back in → That's the pullback I'm waiting for.
Key Levels
📍 Resistance: 4008–4015
📍 Support: 3995–4000
📍 Bullish Target: 4018 → 4025
📍 Bearish Target: 3988 → 3978
Trading isn't about catching every move—it's about waiting for the one that gives you the best probability.
P.S. You don't have to stick to Forex brokers to trade Gold. With Bitget UEX, you can also trade XAUUSD (Gold CFDs) alongside crypto, stocks, and other markets all from one platform.☕✨
Bias: Slightly Bullish 📈 (waiting for confirmation)
Futures market
GOLD | Multi-Timeframe Resistance ConfluenceGold is approaching a key multi-timeframe resistance zone, where several technical factors align. This area could become a decision point for the next move.
Confluences
• 15M Horizontal Resistance
• 4H 33 EMA Resistance
• 1H Descending Trendline Resistance
• 15M Bearish Volume Divergence
The combination of these confluences increases the probability of a bearish reaction. However, I will wait for bearish price action confirmation before considering short opportunities.
Key Levels
📍 Resistance Zone: 4033–4040
📍 Support: 3982
📍 Major Support: 3943
Bullish Invalidation: A strong close above the resistance zone and the 1H trendline would weaken the bearish setup and could lead to further upside.
⚠️ This is a technical analysis based on price action and multi-timeframe confluence. It is not financial advice. Always wait for confirmation and manage your risk.
#XAUUSD #GOLD #GoldAnalysis #PriceAction #TechnicalAnalysis #Forex #TradingView #MultiTimeframe #EMA #VolumeAnalysis
XAUGBP - B wave idea - longPlease see chart for idea
Pattern recognition. ABC
I believe we are in A wave down to possibly complete somewhere near £2800 (dont try to be perfect)
B wave to retrace up to 99% 0f A
realistic targets are 62% £3500 once the down trend turns
(look for small chart patterns at the fib levels to enter long)
I have added a 4 hour chart with similar pattern to show you what I m thinking and marked it up so you know where I think we currently are.
not duration specific the moves could take shorter or longer than the waves show
All the best
Dave
XAUUSD MARKET OUTLOOK (3 MONTHS DATA)XAUUSD has been strongly bearish for the past 3 months. looking at this market from the technical standpoint, I see no significant reason that could lead to price reversal at the moment. I am still bearish in this market and will only be interested in sell ideas. therefore, keep a close watch for opportunities yet to come. don't try to catch a falling knife
Gold remains under selling pressure as RSI stays in weak territo📊 Market Overview:
Gold is undergoing a corrective decline as market sentiment remains cautious, with major equity indices such as the S&P 500 and Nasdaq trading lower amid short-term profit-taking. Meanwhile, the U.S. Dollar continues to hold firm, keeping pressure on gold and limiting its ability to break above key resistance levels.
📉 Technical Analysis:
• Key Resistance: $3,988 (around the 9-period SMA) and $4,000.
• Nearest Support: $3,959 (recent low) and $3,940.
• EMA: Price remains below the 9 EMA ($3,978), indicating that the short-term trend remains bearish.
• Candlestick / Volume / Momentum: RSI is currently at 37.86, below the 40 level, suggesting bearish momentum continues to dominate. There are no clear signs of a bullish reversal on the lower timeframes yet.
📌 Outlook:
Gold is likely to extend its short-term decline unless it can close above the $3,978 level (9 EMA).
💡 Suggested Trading Strategy:
🔻 SELL XAU/USD: 3,970 – 3,975
🎯 TP: 40 / 80 / 200 pips
❌ SL: $3,978
🔺 BUY XAU/USD: 3,950 – 3,955
🎯 TP: 40 / 80 / 200 pips
❌ SL: $3,947
Gold prices have rebounded, but has the trend reversed?Gold prices have rebounded, but has the trend reversed?
Gold prices fell 2.6% this week, marking the largest weekly drop in six weeks.
The rebound is real, but has the trend reversed? It's too early to draw conclusions.
As shown in the chart: We remain bearish on gold prices.
The US has launched airstrikes against Iran for the seventh consecutive night, with both sides expanding the scope of their attacks. The US attacked bridges in Iran, while Iran attacked power and desalination facilities in Kuwait.
US-Iran conflict → Soaring oil prices → Soaring inflation → Rising expectations of interest rate hikes → Falling gold prices
Although gold prices have corrected nearly 30% from their highs, net long positions in the market remain near historical highs, and institutional long positions are highly concentrated.
What does this mean?
The market is well-funded, and the risk of long positions "uncoupling" remains. If the market continues to correct, these funds may further liquidate their positions and exit the market, thereby exacerbating market volatility.
$4,000 is a key psychological level. If gold prices break below this level and continue to fall, short-term downward pressure could intensify.
Conversely, this also indicates strong support below.
Technical Analysis: The short-term rebound is a "correction," not a "reversal."
The biggest problem facing gold is not whether the price decline is sufficient, but whether the correction period is insufficient.
Previous upward cycle: 121 weeks
Current correction to date: Only 24 weeks
Historically, a correction needs to be at least 38.2% of a sustained upward cycle, or approximately 46 weeks, to be considered sufficient.
In other words, gold prices could fluctuate within the $3600 to $4400 range for more than six months.
Expected Range: $3,300-$3,500: A True "Golden Opportunity"
First Resistance Level: $4,030-$4,040
Strong Resistance Level Above: $4,080-$4,130
First Support Level Below: $3,960-$3,980
Strong Support Level Below: $3,940-$3,950
Range Judgment: $3,950-$4,200 – A break above $4,200 would allow bulls to regain control; a break below $3,950 would see bears continue their sweeping attack.
Strategy: The primary strategy is to sell on rallies (consistent with the medium-term trend).
Given the unchanged downtrend, selling on rallies to resistance levels is a relatively high-probability strategy.
Entry Range: If the weekly chart shows… gold prices open higher near $4,030-$4,040 but subsequently encounter resistance, a small short position can be established.
Adding to Positions Recommendation: Consider adding to your position if gold prices rebound above $4080 and then fall back.
First Target Price: $4000-$3980
Second Target Price: $3960-$3940
Stop-Loss: Above $4050
This week, the market taught us a lesson: in an era where oil prices can even "change" gold's trajectory, both die-hard bulls and bears will be utterly crushed by the market.
Gold has now become a "hostage" of the Federal Reserve; a single day's rise in oil prices can put gold in a difficult position.
At the $4000 level, a fierce tug-of-war is underway between bulls and bears. We shouldn't be the first to rush in and become cannon fodder, nor should we be the last fool to run away. Monday's strategy can be summarized in one sentence: Don't chase the price above $4030, and don't chase the price below $3960. Buy low and sell high, take a small profit and leave.
This round of correction is not about courage, but about patience.
The real "golden opportunity" will not come today, nor will it come tomorrow; it may come when everyone can no longer hold on.
XAUUSD Bullish Reversal from Buy-Side FVG & SupportXAUUSD is approaching a key confluence zone where a Buy-Side FVG aligns with a strong support level, making this a high-probability demand area. As long as price respects this zone, buyers may step back in and drive a bullish recovery toward the marked resistance target. A clean reaction from support will confirm bullish momentum, while a breakdown below the entry zone would invalidate the setup. Patience and confirmation remain essential before entering the trade.
XAUUSD — Bearish Continuation Toward Fibonacci Target
Fundamental Analysis
Gold remains sensitive to USD momentum, Treasury yields, and upcoming U.S. macro data. For next week, the technical bias still leans bearish while price stays below the major descending structure.
Technical Analysis
On the 4H chart, XAUUSD is trading around 4,017 after losing momentum under the downtrend trendline. The nearest sell reaction zone is around 4,050 - 4,070, where price may retest the Fibonacci sell area before another downside move. If this zone rejects price, sellers may continue to push gold toward the lower Fibonacci psychological target around 3,755. A stronger recovery toward 4,203 or 4,300 - 4,384 would only be a deeper bearish retest unless price breaks the major downtrend.
Important Key Levels
Current price: 4,017
Nearest sell zone: 4,050 - 4,070
Strong resistance: 4,203
Fibonacci liquidity zone: 4,290 - 4,310
Major Fibonacci sell zone: 4,380 - 4,384
Main downside target: 3,755 - 3,740
Invalidation: above 4,203
Trading Scenario
Main Sell Setup
Entry: 4,050 - 4,070
Stop Loss: 4,203
Take Profit 1: 3,950
Take Profit 2: 3,850
Take Profit 3: 3,755 - 3,740
Sell Condition
Wait for gold to recover into the 4,050 - 4,070 Fibonacci sell zone and show bearish rejection. A failed reclaim, long upper wick, bearish engulfing candle, or close back below the zone would confirm seller pressure. If price breaks below the recent low, the bearish continuation setup becomes stronger. If gold breaks and holds above 4,203, this sell setup should be invalidated.
Overall View
The main view for next week remains bearish while XAUUSD trades below the downtrend structure. A short-term recovery can happen, but the preferred plan is to wait for price to retest the Fibonacci sell zone before looking for continuation toward the 3,755 - 3,740 target area.
Do you share the same bearish view on gold for next week, or are you waiting for a deeper retest near 4,203 first?
XAUUSD — OB Reaction, Trendline Break Can Confirm Recovery
Gold is trading around $4,017 after reacting strongly from the lower OB and buy zone liquidity around $3,985–$3,992. This is an important area on the medium-term structure because price has already tested the lower reaction zone several times, and sellers failed to create a clean continuation below it.
From an SMC perspective, gold is still moving inside a broad corrective structure, but the reaction from the lower OB shows that buyers are starting to defend the discount area. The key point now is the descending trendline. If gold can stay above this trendline and build acceptance above the current range, the recovery structure can become stronger.
The current market is not a place to chase. The clean plan is to wait for price to respect the $3,985–$3,992 buy zone or confirm strength above the trendline. If buyers continue to defend this area, gold may recover toward the VL zone first, then the upper OB area around $4,100–$4,125.
Buy setup 1
Condition:
Gold holds the buy zone liquidity around $3,985–$3,992 and forms bullish rejection with lower timeframe MSS / CHOCH.
Entry: $3,985–$3,992
SL: below $3,950
TP1: $4,030
TP2: $4,060
TP3: $4,100–$4,125
TP4: $4,175
Buy setup 2
Condition:
If gold breaks above the descending trendline and retests it as support, bullish recovery becomes stronger.
Entry: above $4,030–$4,040 after breakout retest
SL: below $3,985
TP1: $4,060
TP2: $4,100–$4,125
TP3: $4,175
TP4: $4,220
Buy setup 3
Condition:
If gold sweeps below $3,985 but quickly reclaims the buy zone, this can create a stronger liquidity-trap buy setup.
Entry: after reclaim above $3,985–$3,992
SL: below the sweep low
TP1: $4,030
TP2: $4,060
TP3: $4,100–$4,125
Sell setup
Condition:
Selling is not the main priority while price is reacting from the lower OB. A sell setup is only valid if gold fails to hold above $3,985–$3,992 and breaks the lower structure clearly.
Entry: below $3,950 after breakdown retest
SL: above $3,985
TP1: $3,920
TP2: $3,880
TP3: $3,830–$3,850
Sell scalping setup
Condition:
If gold reaches the upper OB around $4,100–$4,125 and shows clear bearish rejection, a short-term sell scalp may appear.
Entry: $4,100–$4,125 after rejection
SL: above $4,150
TP1: $4,060
TP2: $4,030
TP3: $3,985–$3,992
Key levels
Current price area: $4,017
Buy zone liquidity: $3,985–$3,992
Strong reaction OB: $3,950–$3,970
Trendline confirmation area: $4,030–$4,040
Short-term resistance: $4,060
VL reaction zone: $4,090–$4,105
Upper OB target zone: $4,100–$4,125
Bullish continuation confirmation: clean hold above the descending trendline
Stronger bullish confirmation: clean break above $4,125
Bearish continuation confirmation: clean break below $3,950
Bearish target zone if structure fails: $3,830–$3,850
My current view is that gold is reacting from a medium-term OB support area, and the recovery can become stronger if price holds above the descending trendline. The Prime Gold plan is to avoid selling directly into the lower OB and wait for confirmation around $3,985–$3,992 or a clean breakout above the trendline. If buyers defend this structure, gold can continue toward $4,060, $4,100–$4,125 and potentially higher liquidity.
No confirmation, no trade.
Gold price reacting at support level next target could be 4050XAUUSD Analysis | 45M Timeframe 📊
Price is testing a strong Buy Zone after a confirmed CHOCH and BOS. If buyers defend this area, a bullish move toward 4050 is expected
✅ Wait for confirmation before entry
🎯 Target: 4050
🛑 Always use proper Risk Management
This analysis is for educational purposes only, not financial advice
GOLD NEXT WEEK - GOLD REMAINS UNDER PRESSURE: IS 38XX NEXT?The new trading week begins with little change in the broader macro narrative. Last week's softer U.S. inflation data failed to trigger a sustained rally in Gold, reinforcing the view that institutional investors remain focused on the Federal Reserve's cautious stance rather than a single round of economic releases. Fed officials continue to emphasize that inflation has not yet been fully contained, keeping expectations for restrictive monetary policy largely intact. As long as U.S. yields remain relatively firm and the dollar avoids a deeper correction, Gold is likely to struggle in establishing a meaningful recovery.
With the major inflation reports now behind the market, attention shifts toward upcoming Fed communication and broader risk sentiment. The absence of a fresh bullish catalyst leaves Gold increasingly dependent on technical structure, where sellers continue to hold the upper hand.
From a technical perspective, Gold continues to respect its broader daily bearish trend, printing a sequence of lower highs and lower lows beneath the long-term descending trendline. Recent rebounds have repeatedly failed near the Demand + Fibonacci 0.50–0.618 resistance cluster, confirming that institutional sellers are still defending premium pricing. Although the 390x support zone has generated buying interest, price has yet to produce any meaningful Break of Structure (BOS) that would suggest a trend reversal.
As long as Gold remains below the descending trendline and key resistance, the current recovery should continue to be viewed as corrective. If selling pressure extends through the 390x support, the next major liquidity objective could emerge around the 38xx demand zone, where longer-term buyers may begin reassessing value.
PRIMARY SCENARIO
Gold could continue trading within the prevailing bearish structure. Failure to reclaim the Demand + Fibonacci 0.50–0.618 resistance may expose the 390x support to another test. A confirmed daily break below this area would likely extend the decline toward the 38xx liquidity zone.
ALTERNATIVE SCENARIO
If buyers reclaim the descending trendline and secure a confirmed daily close above the 0.618 Fibonacci resistance, bearish momentum could begin to fade. Such a move would be the first indication that the broader downtrend is losing strength and that a deeper corrective recovery may develop.
MARKET VIEW
Current Bias: Bearish
Preferred Strategy: Sell the Rally – Wait Confirmation
Lucas Gray Trading
[XAUUSD] H1 Short Squeeze Achieved: Premium FVG Mitigated ahead of Friday's Final Showdown!
⚖️ Macro Backdrop: Local Yield Consolidation Fuels Bullion's Technical Squeeze
Gold markets approach the final weekly close with an aggressive intraday short-squeeze (+0.68%), triggered by a sharp technical cooling of the U.S. Dollar Index (DXY) and short-term profit-taking across 10-Year U.S. Treasury yields. While the dominant higher-for-longer macro economic backdrop remains strictly restrictive for non-yielding assets, near-term institutional order flow has focused entirely on filling historical price imbalances. Smart money successfully utilized yesterday's deep discount sweep to absorb sell-side stops, engineering a powerful pre-weekend short squeeze targeting premium structural pools.
📉 Technical Analysis: Internal CHoCH & Premium FVG Mitigation Matrix
The H1 structural blueprint showcases a textbook liquidity transfer and rebalancing sequence:
1. Short Squeeze Target Hit: Following a multi-stage breakdown, price has successfully launched a massive corrective rally out of the 3,975 macro floor. This expansion drive cleanly filled the immediate H1 Fair Value Gap (FVG) and mitigated the major S/R Flip Zone (lower shaded gray box).
2. The Premium Ceiling Matrix (Upper Shaded Gray Box): The market has printed a clean minor Break of Structure (BOS) upward. However, the black zigzag roadmap forecasts a critical multi-stage ceiling test next week. The immediate resistance corridor sits at the 4,030 - 4,045 zone, which confluences perfectly with the HTF Primary Bearish Trendline.
3. The Target Roadmap Playbook: Price is highly expected to tap the 4,040 trendline ceiling -> execute an institutional pullback to sweep late-joining buyers down to the newly created H1 demand block (lower gray box at 3,995 - 4,005 corridor) -> before deciding its next macro expansion leg.
🔄 IF-THEN Playbook (Execution Scenarios):
• IF price expands to test the 4,040 trendline resistance pool and prints a clear lower-timeframe structural failure (M5/M15 CHoCH Rejection) -> THEN enter high-probability swing shorts targeting the 4,000 baseline floor and expanding down to the 3,975 macro lows.
• IF price secures a decisive H1 candle close above the 4,050 ceiling -> THEN the intraday bearish structure is completely invalidated, opening the runway for an aggressive lift toward the 4,090 supply pool.
🎯 Strategic Metrics Summary:
• Current Market Price: 4,025.295
• Immediate Resistance / Trendline Ceiling: 4,035.000 — 4,045.000
• Key Correction Floor / Buy Zone: 3,995.000 — 4,005.000 (Internal FVG Base)
• Structural Invalidation Level: Decisive H1 close above the 4,050.000 handle.
💬 Trader Question: Are you locking in profits on your long scalps at this current 4,025 FVG mitigation, or are you waiting for the 4,040 trendline touch to load heavy short positions for the weekend? Drop your playbook below!
WEEKLY CLOSE BELOW TRENDLINE: WHAT'S NEXT FOR GOLD?The final trading session of the week arrives with no major macro catalyst capable of shifting market sentiment. Earlier this week, softer U.S. inflation data temporarily weakened the dollar but failed to generate a sustained recovery in Gold. Markets continue to price in a cautious Federal Reserve, with policymakers showing little urgency to ease monetary policy while inflation risks remain elevated. As a result, Treasury yields have stabilized and institutional flows continue to favor defensive positioning rather than aggressive buying in precious metals.
With the week's key economic releases now behind us, price action becomes increasingly important. The fact that Gold has been unable to capitalize on supportive inflation data suggests that buyers remain hesitant, while sellers continue to dominate the broader market structure.
From a technical perspective, Gold is set to close the week below the descending trendline on the H4 timeframe, reinforcing the existing bearish trend. Every recovery toward the Demand + Trendline resistance has been met with renewed selling pressure, confirming this confluence as the key institutional supply zone. Meanwhile, price continues to hold above the short-term support around 396x, but the rebound lacks momentum and has yet to produce a confirmed Break of Structure (BOS).
A weekly close beneath the trendline would strengthen the bearish narrative and keep the focus on the next liquidity zone around 392x–393x. Until buyers reclaim the descending trendline, the current recovery should still be viewed as corrective rather than the start of a broader reversal.
PRIMARY SCENARIO
As long as Gold remains below the Demand + Descending Trendline resistance, sellers are likely to maintain control. Any short-term recovery toward this resistance cluster could attract fresh selling pressure, with the 392x–393x support zone remaining the next downside objective.
ALTERNATIVE SCENARIO
If buyers manage to reclaim the descending trendline and secure a confirmed H4 close above the Demand resistance, bearish momentum could begin to fade. Such a move would suggest the current selling pressure is losing strength and open the door for a broader corrective recovery.
MARKET VIEW
Current Bias: Bearish
Preferred Strategy: Sell the Rally – Wait Confirmation
Gold M30: Dead Cat Bounce Before a New Downtrend?
Gold remains under heavy pressure after the recent sell-off as markets continue to price in a higher-for-longer Fed outlook. Stronger inflation expectations, supported by rising oil prices and a resilient U.S. Dollar, are keeping real yields elevated, limiting demand for non-yielding assets like Gold.
From a Smart Money perspective, price is still trading below the descending trendline, preserving the short-term bearish structure. The latest recovery appears corrective rather than impulsive, with buyers failing to reclaim the premium supply area.
Technically, price is reacting inside the 0.5–0.618 Fibonacci retracement around 4005–4010, which aligns with the descending trendline and acts as a key confluence resistance. Unless bulls can close decisively above this zone, the current bounce is likely to become another liquidity grab before sellers resume control.
Key Levels
Resistance: 4005–4010 (Fibonacci + Trendline Confluence)
Support 1: 3968–3972 (Current Demand / Liquidity)
Support 2: 3938–3942 (Major Liquidity Pool)
Trading Scenarios
Bearish: Rejection below 4005–4010 could trigger another sell-side expansion toward 3968, with a deeper move into 3940 if selling momentum accelerates.
Bullish: A confirmed breakout above the descending trendline and sustained acceptance above 4010 would weaken the bearish outlook and expose 4040–4050 as the next upside objective.
Monitor USD sentiment and geopolitical headlines closely. Liquidity conditions may remain volatile, increasing the probability of false breakouts around key technical zones.
XAUUSD (4Hr.) CHARTFriends, my approach to reading charts is very simple.
Technical Note: From a technical perspective, gold closed below the last order block candle on the H4 timeframe, further strengthening the current bearish trend. This confirms this confluence as a key institutional supply zone. Meanwhile, the price remains above short-term support around 3960. It could turn bullish if it touches the 4044 level. If that happens, the strategy will be to buy the dip. The stop-loss will be placed below the swing low (3960). The view is currently bearish.
Let the market come to your zones and show its hand. Trade safe and manage your risk! Always wait for your own confirmations before entering the market. Classic trading strategy where you lock in profits during market rallies and purchase assets at a discount when their prices pull back. The goal is to accumulate fundamentally strong assets at lower prices, anticipating they will rebound to new highs.
Risk Disclaimer: This analysis is for educational purposes only and does not constitute financial advice. Always practice proper risk and position sizing. Stop Loss Must if you want to be a profitable Trader.
MARKET VIEW:-
Current Bias: Bearish
Preferred Strategy: Sell the Rise – Wait for Confirmation
XAUUSD – Gold Is Still Heavy, But Support Is Getting Important XAUUSD – Gold Is Still Heavy, But Support Is Getting Important
Gold is still struggling to build a strong recovery.
Price is currently trading around 4,017 after briefly moving back above the psychological 4,000 level. The bounce is visible, but gold remains near the monthly low area and is still moving inside a broad descending channel on the daily chart.
This means the market is not fully bullish yet. Gold is trying to recover from support, but the bigger structure still needs confirmation.
FUNDAMENTAL ANALYSIS
Gold remains under pressure as higher oil prices bring inflation concerns back into focus.
Rising tension between the U.S. and Iran has supported oil prices, which may keep inflation expectations elevated. This can strengthen the case for the Fed to keep interest rates higher for longer, supporting the U.S. dollar and limiting upside for non-yielding assets like gold.
For now, the fundamental background is still cautious. Any recovery in gold needs technical confirmation before becoming reliable.
TECHNICAL ANALYSIS – SMC + MARKET STRUCTURE
From an SMC perspective, gold is still moving inside a wide descending channel. Price has been forming lower highs since the major top, and the market has not yet broken the bearish structure.
The current area around 3,900 – 4,020 is very important. This zone is marked as a strong support and potential buy reaction area. If buyers defend this area, gold may create a corrective recovery toward the next resistance zones.
The first major resistance is around 4,207. If gold breaks and holds above this level, the recovery structure becomes stronger.
Above that, the next important resistance sits near 4,380 – 4,400, where Fibonacci and previous price reaction align. A stronger breakout from there could open the path toward the higher resistance zone around 4,700.
However, if gold loses the current support zone, the bearish channel remains active and price may continue searching for lower liquidity.
KEY PRICE ZONES
Current price: 4,017
Strong support / Buy zone: 3,900 – 4,020
Psychological level: 4,000
First resistance: 4,207
Fibonacci reaction resistance: 4,380 – 4,400
Higher resistance: 4,700
Bearish pressure remains: Below 4,207
Invalidation for recovery view: Below 3,900
TRADING SCENARIOS
Buy Scenario
Buy Zone: 3,900 – 4,020
Entry: Bullish reaction, liquidity sweep, or daily confirmation from support
SL: Below 3,900
TP1: 4,207
TP2: 4,380 – 4,400
TP3: 4,700 if momentum expands
Breakout Buy
Above 4,207 → Target 4,380 – 4,400
Sell Scenario
Sell below 3,900 after confirmation
TP1: 3,750
TP2: Lower channel area if bearish momentum continues
Invalidation: Reclaim 4,020 – 4,207
MY VIEW
Gold is trying to recover, but the bigger trend is still heavy.
The chart shows price sitting near a major support zone, so I do not want to chase selling too late. At the same time, I cannot call a bullish reversal while gold remains inside the descending channel and below 4,207.
For me, 4,207 is the first real confirmation level.
If buyers can push gold above 4,207, the recovery may extend toward 4,380 – 4,400.
If support near 3,900 fails, sellers may regain full control.
Gold is at support — but confirmation will decide the next move.
Do you think gold will defend the 4,000 area, or will sellers break the support zone next?
Every Trade Deserves Six Questions + Real ExampleOne of the biggest misconceptions in trading is believing that a good chart automatically deserves a trade.
It doesn't.
A market can look beautiful. It can be trending perfectly, sitting at support, respecting moving averages, printing textbook candlestick patterns, or doing everything your favorite trading book says it should do.
None of that matters until you have a complete plan.
Professional traders don't ask, "Does this chart look good?"
They ask a much better question:
"Can I answer every important question before risking my money?"
If the answer is no, the trade simply doesn't exist yet.
Before risking even a single dollar, every trading idea should survive the following six questions.
1. Why am I watching this market?
Every trade starts with a reason.
- Not because Gold is moving.
- Not because Bitcoin is trending on social media.
- Not because someone on YouTube said a altcoin it's about to explode.
There has to be a setup.
Maybe you're looking at a trend continuation after a healthy pullback. Maybe it's a range breakout. Maybe it's a false break, a liquidity sweep, or a reversal from a major support zone.
The setup is the story that attracted your attention in the first place.
Without a setup, you're not trading a strategy.
You're simply reacting to movement.
2. What has to happen before I enter?
This is where patience separates professionals from everyone else.
Having a setup doesn't automatically give you permission to enter.
- Every setup needs confirmation.
- What exactly are you waiting for?
- A candle close above resistance?
- A rejection from support?
- A break and retest?
- A higher low?
- A lower high?
Whatever your trigger is, it should be defined before the market gets there.
And here's the difficult part.
If that trigger never appears...
You don't trade.
Many traders believe discipline means managing a position well.
In reality, discipline often means never opening the position at all.
3. What would prove me wrong?
This may be the single most important question in trading.
Every trade should begin with a sentence:
"This idea is wrong if..."
Notice the wording.
Not "I hope it doesn't..."
Not "It probably won't..."
Simply:
"My analysis stops making sense if price reaches this level."
That level is not chosen because losing money hurts there.
It is chosen because your original idea no longer exists beyond it.
Too many traders place stops based on how much they are willing to lose instead of where their analysis actually becomes invalid.
Your stop should protect your logic, not your emotions.
4. Is the risk acceptable?
Even the best trading idea can become a terrible trade if the risk doesn't make sense.
Imagine finding the perfect setup, only to realize that your stop needs to be 1000 pips away while your realistic target is only 400.
Can it still work?
Maybe.
Should you trade it?
Probably not.
Risk management isn't about finding winning trades.
It's about making sure the winners are worth the losers.
Ask yourself:
- Does this stop fit my money management?
- Can I keep my position size where it should be?
- Does the potential reward justify taking the trade?
If the answer is no, don't try to force it.
The market will always create another opportunity.
Your capital is much harder to replace.
5. How will I manage the position?
Most traders spend hours looking for entries and only seconds thinking about what happens afterward.
That's backwards.
What if price immediately moves in your favor?
Will you move your stop?
Take partial profits?
Do nothing?
What if the market goes sideways for two days?
What if it comes within ten pips of your target before reversing?
These aren't questions you should answer while watching every candle.
By then, emotions are already involved.
Every important management decision should be made before you click Buy or Sell.
The less you have to improvise during the trade, the less likely you are to sabotage yourself.
6. How will I judge this trade afterward?
This is probably the most neglected question in trading.
Most traders evaluate one thing.
Did I make money?
That's understandable.
But it's also the wrong metric.
A winning trade can be poorly executed.
A losing trade can be executed perfectly.
The questions that matter are different.
- Did I follow my rules?
- Was my entry according to plan?
- Did I respect my stop loss?
- Did I let emotions change my decisions?
- Would I take exactly the same trade again tomorrow?
That's how professionals improve.
Not by counting winning days.
By reviewing decision quality.
Because over hundreds of trades, good decisions tend to produce good results.
Bad decisions eventually produce exactly what they deserve.
A Real Example From Gold
Let's make this practical.
Yesterday I wrote that, despite Gold being in a very clear downtrend, I believed the next major move would eventually be a bullish reversal, with the potential to reach the 4200 area.
Did I immediately open a long position?
No.
Why?
Because I only had an idea.
I had a directional bias and I had a target, but a trading idea is not the same as a trading setup.
Could I have bought an intraday dip and made money?
Absolutely.
Maybe I would have caught the exact bottom.
Maybe I would have made 3-400 pips.
But that wouldn't have made it a good trade.
It would have made it a lucky one.
The problem wasn't the idea.
The problem was everything I didn't have.
I had no confirmation that buyers were actually taking control.
More importantly, I had no clear point where I could honestly say:
"My idea is wrong."
Without that, where does the stop go?
How much do I risk?
How do I calculate my position size?
How do I know whether I'm still trading my original idea or simply hoping the market eventually reverses?
I couldn't answer those questions.
So I stayed out.
Now let's imagine how that exact same idea could become a real trading opportunity.
Following the way I trade, the first thing I would want to see is Gold breaking its descending trendline and, more importantly, establishing itself above the 4050 area.
Not just a quick spike.
Acceptance.
Then I would like to see a small pullback that holds above the breakout area, followed by buyers stepping in again and starting a fresh impulsive move higher.
Only then does the picture change.
Now I still have my original idea and objective around 4200, but I also have something much more valuable.
I have confirmation.
And because I have confirmation, I also have invalidation.
If Gold loses that newly created support, then my bullish thesis is no longer valid.
That level naturally becomes my stop-loss area.
Suddenly, everything starts falling into place.
- I know why I'm entering.
- I know what confirmed the trade.
- I know where I'm wrong.
- I know exactly how much I'm risking.
And only then can I calculate whether the reward justifies taking the position.
Notice something important.
The market itself didn't change very much.
What changed was the quality of the information available to me.
That's the difference between trading an opinion and trading a plan.
Professional traders don't get paid for predicting reversals.
They get paid for waiting until a prediction becomes a high-probability setup with clearly defined risk.
And sometimes that means entering hundreds of pips above the bottom.
That's perfectly fine.
I'd rather miss the first part of a move and trade a confirmed trend than catch the exact low with nothing more than hope supporting my position.
The Best Traders Skip More Than They Trade
One lesson took me years to truly understand is that doing nothing is often a trading decision.
A professional trader can spend the entire day watching a market without opening a single position.
Not because they're afraid.
Not because they're indecisive.
Because the conditions they defined in advance never appeared.
Beginners often feel frustrated when they don't trade.
They think they've wasted the day.
Professionals think differently.
Every bad trade they avoid is money they didn't have to lose.
Sometimes staying flat is the highest-return trade you'll make all week.
The Goal Was Never to Trade Every Opportunity
The markets generate hundreds of interesting charts every single week.
You don't need them all.
In fact, trying to catch everything is one of the fastest ways to destroy consistency.
Your goal isn't to trade every breakout, every reversal, every news event, or every trend.
Your goal is much simpler.
Trade only the ideas you completely understand.
The ones where you know:
- why you're entering,
- what confirms the entry,
- where you're wrong,
- how much you're risking,
- how you'll manage the trade,
- and how you'll evaluate yourself afterward.
Everything else is just noise disguised as opportunity.
Final Thoughts
The next time you open your platform, don't ask yourself:
"What can I trade today?"
Ask something much more valuable:
"Which of these ideas deserves my money?"
If you can't answer all six questions, the market isn't telling you to trade.
It's telling you to wait.
And waiting isn't a weakness.
It's one of the few advantages retail traders still have.
Because in trading, patience isn't what happens before the opportunity.
Patience is part of the strategy itself.
Have a nice weekend!
Mihai Iacob
GOLD NEEDS A DECISIVE BREAK ABOVE 4000 AND REVERSE HIGHER?Gold continues to consolidate after defending the 3960–3980 support zone, but the market remains trapped beneath the descending trendline and the psychological 4000 level. Recent price action shows buyers are gradually stepping back in, yet bullish momentum is still insufficient to confirm a reversal.
On the H1 timeframe, gold is compressing just below resistance, suggesting that volatility is fading before the next impulsive move. As long as support continues to hold, the recovery scenario remains valid. However, buyers need a decisive breakout above 4000 and the nearby trendline to shift momentum back in their favor.
📍 Key Levels:
🔹 3960 – 3980
Major support and preferred buying zone.
🔹 4000 – 4015
Psychological resistance and breakout trigger.
🔹 4030 – 4045
First upside target after a confirmed breakout.
🔹 3950
A sustained break below this level would weaken the bullish recovery scenario.
✅ Preferred Scenario:
✔️ Gold continues holding above 3960–3980, preserving the short-term recovery structure.
✔️ A strong breakout above 4000–4015 would confirm renewed buying momentum and increase the probability of a move toward 4030–4045.
✔️ Until the breakout occurs, the preferred approach remains scalping within the current range, while waiting for confirmation before following the next directional move.
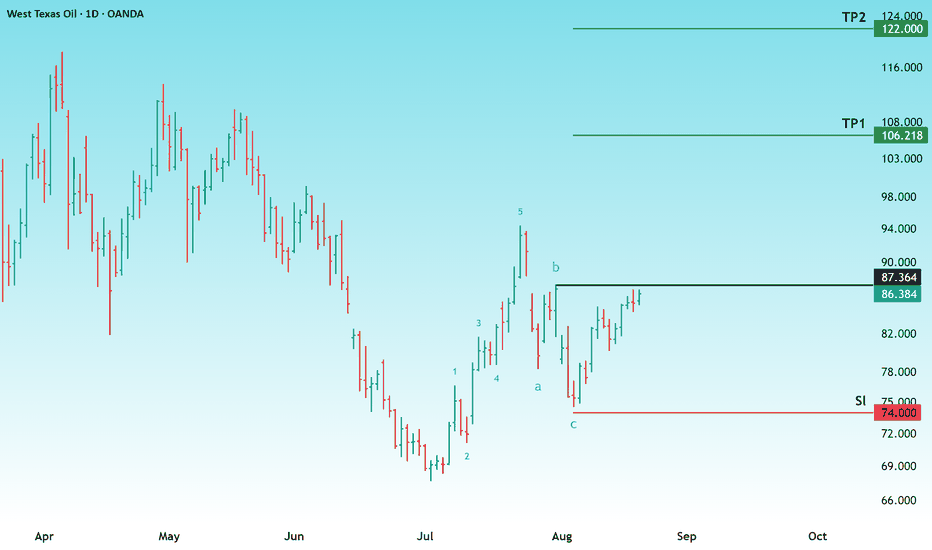
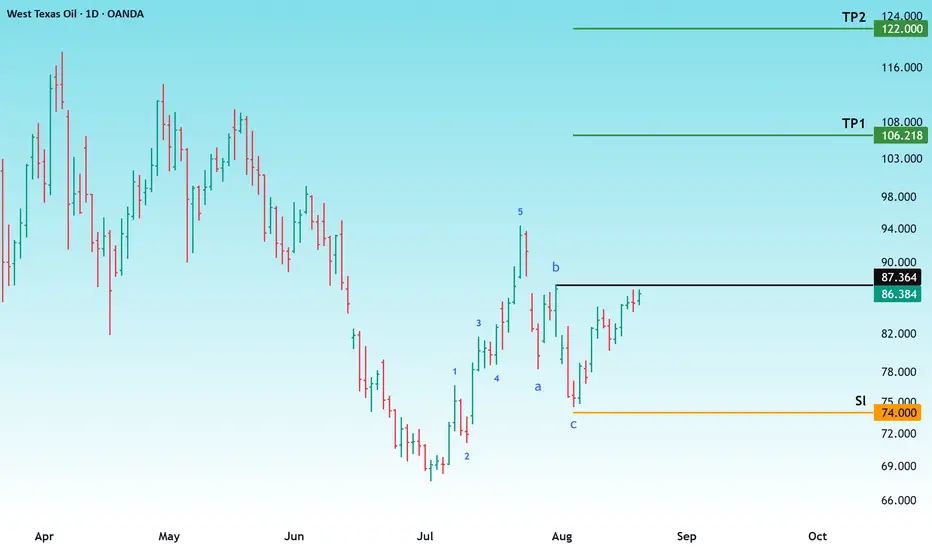
#OIL: Watch out for a potential rebound 📊 #OIL: Watch out for a potential rebound 📈
🧠 Structurally, the price has reached the vicinity of an overlapping support zone and filled the gap, making a rebound from this level plausible. Chasing short positions here is not recommended!
➡️ There is also a gap above that is attracting the price; the resistance zone to watch lies around the 81–86 range!
🤜 Follow me to stay updated on market movements. Remember to like 💖 and share 💬.
TVC:USOIL
H2 20/07 - SCALPING THE DOWNTREND, 402X IS THE KEY BREAKOUTGold continues to trade below the H2 descending trendline, keeping the broader bearish structure intact. Although short-term rebounds are possible after Friday's recovery, sellers remain in control as long as price stays beneath the trendline and major resistance.
The preferred strategy is to wait for bullish pullbacks into resistance before looking for fresh selling opportunities. The current recovery is viewed as a correction within the broader downtrend rather than the start of a new bullish cycle.
☑️ Primary Scenario – Bearish Continuation
Price remains below the H2 descending trendline.
Short-term rebounds are considered selling opportunities.
First resistance: 4025–4030.
Target 1: 3972.
Target 2: 3946.
☑️ Alternative Scenario – Bearish Bias Invalidated
Gold breaks and closes above the 4025–4030 resistance area.
The H2 descending trendline is decisively broken.
The short-term bearish structure is invalidated.
Buyers may extend the recovery toward the 4060–4065 major supply zone.
Key Levels
Resistance
4025–4030 – Trendline resistance.
4060–4065 – Major supply zone.
Support
3970–3975 – First demand area.
3945–3950 – Strong support.
Session Bias
🔴 Bearish Scalping
As long as gold trades below the H2 descending trendline, rallies into resistance remain preferred selling opportunities.
The short-term bearish outlook will only be invalidated if gold breaks and closes above the descending trendline around the 402x resistance area. In that case, price could extend a corrective recovery toward 4060–4065 before establishing its next directional move.