Short
Short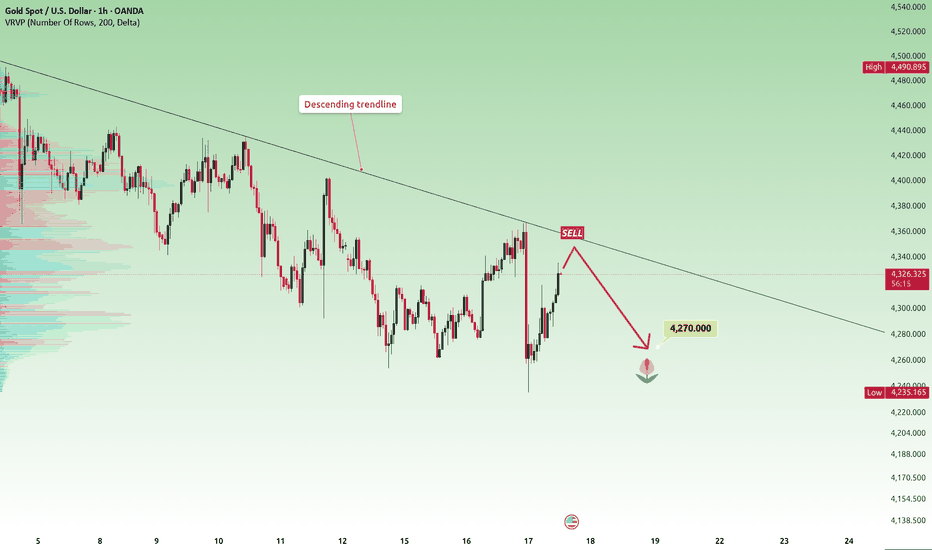
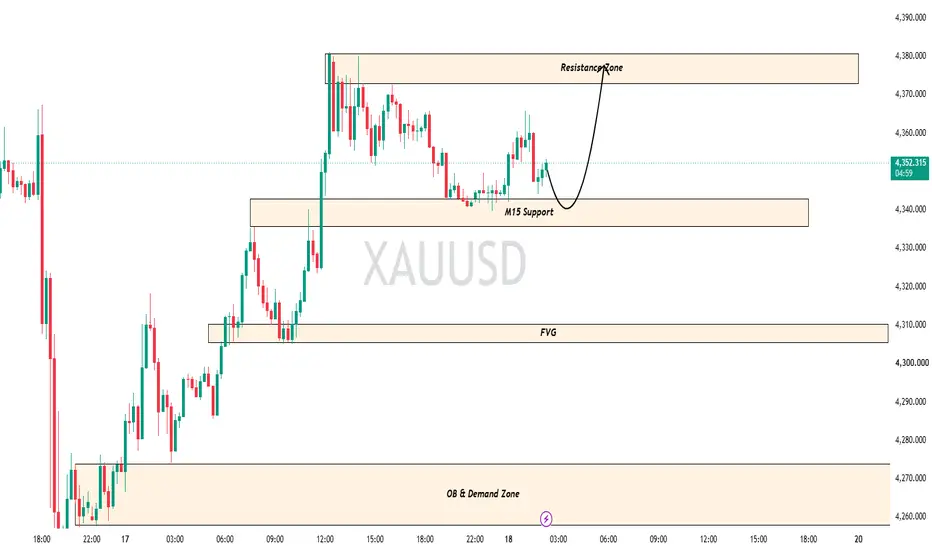
XAUUSD — M15 Support & Resistance StructureGold is currently trading around 4,350, consolidating above the marked M15 support zone at 4,336–4,344.
The chart shows a clear reaction from the support area, while the main resistance zone sits around 4,372–4,380. A sustained move above this resistance could indicate further bullish continuation, while rejection may keep price within the current range.
Key levels:
* M15 Support: 4,336–4,344
* Resistance Zone: 4,372–4,380
* FVG: 4,306–4,311
* OB & Demand Zone: 4,260–4,273
The primary focus is on how price reacts at the M15 support and whether buyers can push toward the resistance zone. A decisive break below support would weaken the bullish structure and bring lower levels into focus.
Educational purposes only. This is technical analysis based on price structure and market behavior, not financial advice. Always manage risk.
Long 
Gold (XAU/USD) 4H – Bearish Retracement Setup Toward IRL FVG/POIStructure: Price swept the sell-side liquidity zone (~4,000-4,050) after a corrective consolidation (the yellow zone), then triggered a clear market structure shift, confirming a bullish leg. This rally pushed price into the order block zone near 4,650-4,700 where it also tagged buy-side liquidity — a classic zone for smart money to distribute and reverse.
Current phase: After tapping the highs, price has pulled back sharply into the IRL FVG (imbalance/fair value gap) around 4,450-4,550, which lines up with POI 1 and POI 2 marked on the chart. This is the zone the chart is treating as a potential reaction/reversal area for a continuation of the downside move.
Bearish targets: Below current price (4,391), the chart marks three descending POIs — Bearish POI 1 (~4,300), POI 2 (~4,260), and POI 3 (~4,180) — suggesting a stepped bearish continuation scenario if the FVG zone rejects price, potentially revisiting the market structure shift level and beyond.
Key levels to watch:
Resistance/Supply: 4,450-4,550 (IRL FVG / POI zone)
Support/Demand: 4,300 → 4,180 (stacked bearish POIs)
Invalidation: A strong close back above the order block zone (~4,650+) would invalidate the bearish continuation thesis.
A quick note: I'm not a financial advisor, and this is a technical read of the chart's own annotations, not a trade recommendation — price action, news catalysts (especially USD strength/Fed policy), and volume confirmation should all factor into any actual decision. XAUUSD H1: Gold Has Two Floors, but Only One Can Save ItGold just gave us one of those moves that can easily fool both sides.
Price rallied from the 4,260 area, climbed all the way toward 4,365, and then lost almost the entire move in a single aggressive sell-off.
Now Gold is sitting around 4,290.
So what happened?
Buyers proved they can push.
Sellers proved they can hit harder.
And that leaves price in a very interesting place.
Instead of predicting the next candle, I am dividing today's chart into three floors.
4,260 → the defense
4,324 → the checkpoint
4,365 → the control level
Whichever side starts taking these floors will tell us much more than the current candle ever could.
Floor #1 is already under attack
The most obvious area on the chart is the H1 Order Block around 4,258–4,272.
This is where the latest collapse found buyers.
But I do not want to BUY simply because price returns there.
There is a difference between touching support and proving support works.
If Gold revisits 4,258–4,272, I want sellers to attack the zone first.
Then I want buyers to take it back.
In practical terms, a dip into the Order Block followed by an H1 recovery above approximately 4,275 gives me the confirmation I need.
BUY — SECOND DEFENSE
Entry: 4,272–4,280 after H1 reclaim
SL: 4,250
TP1: 4,305
TP2: 4,324
TP3: 4,350
TP4: 4,365
Notice where TP2 sits.
That is not a random target.
4,324 is where today's chart changes character.
4,324 is not resistance. It is a checkpoint.
Gold is currently below 4,324, and the short-term EMAs are also sitting overhead.
That means a bounce from 4,260 is only a bounce until proven otherwise.
For buyers to earn something more, I want an H1 candle to close above 4,324, followed by a retest that remains above approximately 4,315–4,324.
If that happens, I would stop treating every rally as something to sell.
BUY — CHECKPOINT RECLAIM
Entry: 4,320–4,327 after bullish retest
SL: 4,298
TP1: 4,350
TP2: 4,365
TP3: 4,385
TP4: 4,400
This is the cleaner BUY for traders who do not want to catch the bottom.
You sacrifice a cheaper entry.
In return, you get more information.
That is often a good trade.
But there is unfinished business at 4,365
Look at what happened during the previous rally.
Gold reached approximately 4,360–4,365, met the falling EMA200, and was immediately rejected.
That reaction matters.
It tells us sellers are still defending the upper part of the H1 structure.
And above it sits the larger 4,380–4,400 resistance zone.
So if Gold recovers again, I will not automatically become bullish.
I will watch 4,355–4,370 very carefully.
A second rejection there, especially an H1 candle that trades above 4,355 but closes back below 4,350, would give sellers another opportunity.
SELL — SECOND REJECTION
Entry: 4,348–4,358 after rejection confirmation
SL: 4,375
TP1: 4,324
TP2: 4,300
TP3: 4,275
TP4: 4,260
This trade has a simple idea behind it:
If buyers receive a second opportunity to reclaim the EMA200 and fail again, I do not want to argue with the rejection.
I want to trade it.
What if the Order Block breaks?
This is where the chart becomes much easier.
If Gold produces an H1 close below 4,255, I no longer consider 4,260–4,270 a valid buying area.
Support has had its chance.
It failed.
I would then wait for price to bounce back toward 4,255–4,265 from underneath.
If that retest is rejected:
SELL — FLOOR REMOVED
Entry: 4,255–4,263 after bearish retest
SL: 4,280
TP1: 4,235
TP2: 4,215
TP3: 4,190
The key here is patience.
I do not want to sell a huge red candle below 4,255.
Let the breakdown happen.
Let price come back.
Then see whether former support becomes resistance.
That gives the trade structure instead of emotion.
And 4,400?
That is where I stop looking for reasons to be bearish.
The chart still has a major resistance band around 4,380–4,400, so even a recovery above 4,365 does not automatically mean Gold is free.
For me, an H1 close above 4,400 followed by a successful hold of 4,385–4,400 would be the real structural upgrade.
At that point:
BUY — SELLERS LOSE THE ROOF
Entry: 4,392–4,402 after retest holds
SL: 4,370
TP1: 4,425
TP2: 4,440
TP3: 4,465
TP4: 4,485
Until that happens, 4,400 remains the ceiling.
Above it, the chart becomes a different market.
My map for today is deliberately simple
Forget trying to predict every H1 candle.
Watch who owns the floors.
Below 4,255: sellers have removed the foundation.
4,260–4,275: buyers get their defensive opportunity.
Above 4,324: the recovery starts earning credibility.
Around 4,365: buyers face the EMA200 test again.
Above 4,400: I stop treating this as merely another rebound.
Gold is currently around 4,290, which is almost exactly where I do not want to force a position.
The better trades are sitting at the edges of the map.
4,260 asks whether buyers can defend.
4,324 asks whether they can advance.
4,365 asks whether they can survive resistance.
4,400 asks whether they can finally take control.
Which level do you think gets taken first — 4,260 or 4,324? Long 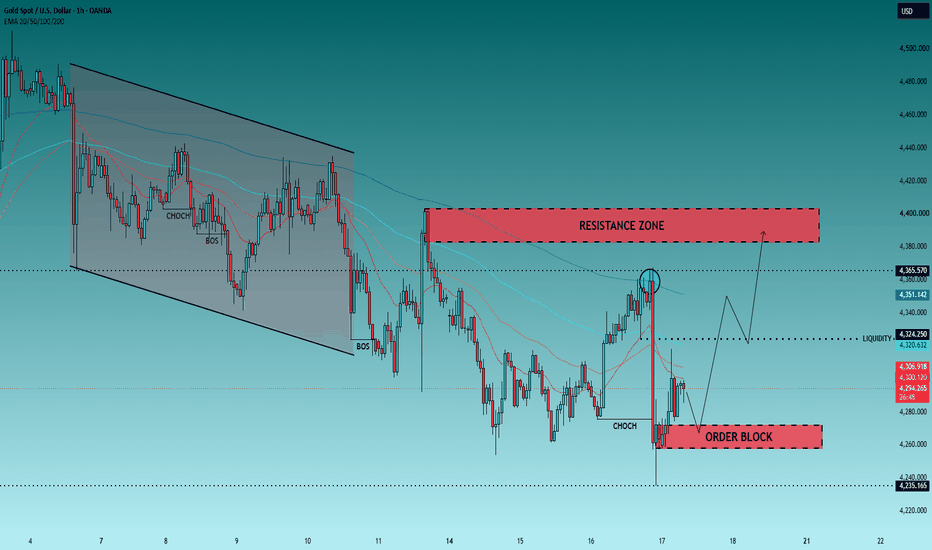
XAUUSD 4H | Liquidity Sweep + Market Structure Shift🧠 Technical Analysis:
Gold has shown a potential shift in short-term structure after sweeping liquidity around the 4,240–4,260 area. 💧
📌 Key Observations:
💧 Liquidity sweep near 4,240–4,260
🔄 Market Structure Shift (MSS) visible
📉 Descending trendline has been broken
🟢 Price is attempting to reclaim the 4,390–4,440 resistance area
🎯 If bullish structure remains intact, the next areas of interest are around 4,480–4,520, followed by 4,600–4,680
⚠️ A move back below the recent structure would invalidate or weaken the bullish scenario
🔎 Key Concepts:
💧 Liquidity Sweep | 🔄 MSS | 📈 Trendline Break | 🧱 Market Structure | 🎯 Resistance Zones
📚 Disclaimer:
This is a technical market analysis based on price structure and liquidity behavior. It is not financial advice or a guaranteed outcome. Always manage risk according to your own strategy. ⚠️
🏷️ Hashtags
#XAUUSD #Gold #TechnicalAnalysis #PriceAction #MarketStructure #LiquiditySweep #MSS #Forex Long 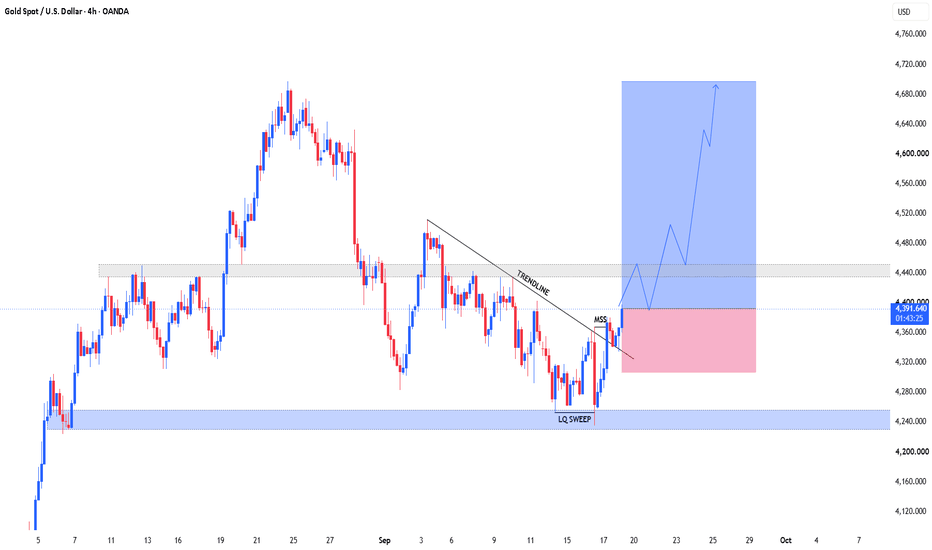
XAU/USD BUY — Support Rebound Toward 4,410Current chart structure: Bullish recovery from the 4,330–4,335 support zone. Price is currently around 4,345, so the setup remains valid while support holds.
Support: 4,330–4,335
Entry zone: 4,340–4,350
Resistance: 4,360–4,370
TP1: 4,380
TP2: 4,400
TP3: 4,410–4,415
Invalidation: Sustained break below 4,330
A move above 4,360–4,370 would provide stronger bullish confirmation. Current market reports also show gold trading around $4,350, with the recent move supported by a softer dollar and easing oil prices, while higher rates remain a risk for gold.
Signal: 🟢 BUY — Support Hold / Bullish Rebound Long 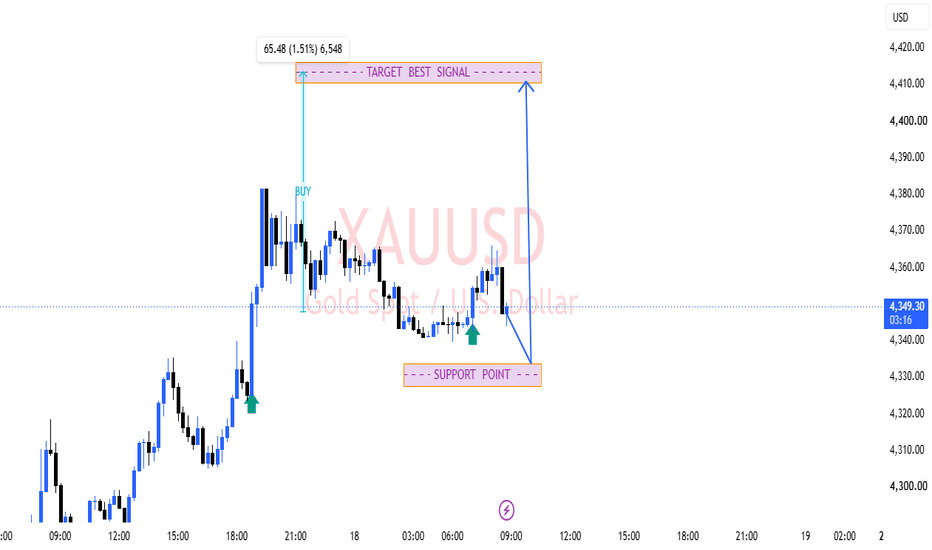
Gold Reclaims Structure — Is Liquidity Next?Timeframe: 2H XAUUSD
Price recently swept sell-side liquidity around the 4,250–4,270 area and reacted strongly.
Strong bullish displacement followed, showing a shift in short-term momentum.
Price has now reclaimed the 4,360–4,380 structure area, giving a bullish BOS/reclaim signal.
The broader structure is still mixed, but the short-term order flow has turned bullish with the latest higher low and impulsive move.
🔑 KEY LEVELS:
🟢 Bullish Demand / Order Block: 4,270–4,315
🔵 Reclaim / Confirmation: 4,360–4,380
🔴 Buy-Side Liquidity / Resistance: 4,470–4,500
⚠️ Major invalidation area: Below 4,250
Previous local highs around 4,400–4,430 may act as intermediate resistance.
🎯 TRADE SETUP — Bullish Scenario:
Entry: 4,340–4,365 on a confirmed pullback/retest
Stop Loss: 4,265
TP1: 4,400
TP2: 4,430
TP3: 4,480–4,500
Risk/Reward: Approximately 1:1 to TP1, 1:1.5 to TP2, and 1:2.5+ to TP3, depending on entry.
🚀 POSSIBLE NEXT MOVE:
Bullish: If price holds above the reclaimed 4,360–4,380 zone and prints bullish confirmation on a retest, continuation toward 4,400 → 4,430 → 4,480+ liquidity becomes the scenario to watch.
Bearish: If price fails to hold the reclaim and breaks back below the recent displacement base, a deeper retracement toward the 4,270–4,315 demand/order block becomes possible.
⚠️ INVALIDATION:
A decisive 2H close below the 4,250–4,270 liquidity-sweep low would invalidate the bullish structure and suggest the sell-side liquidity sweep failed. Long 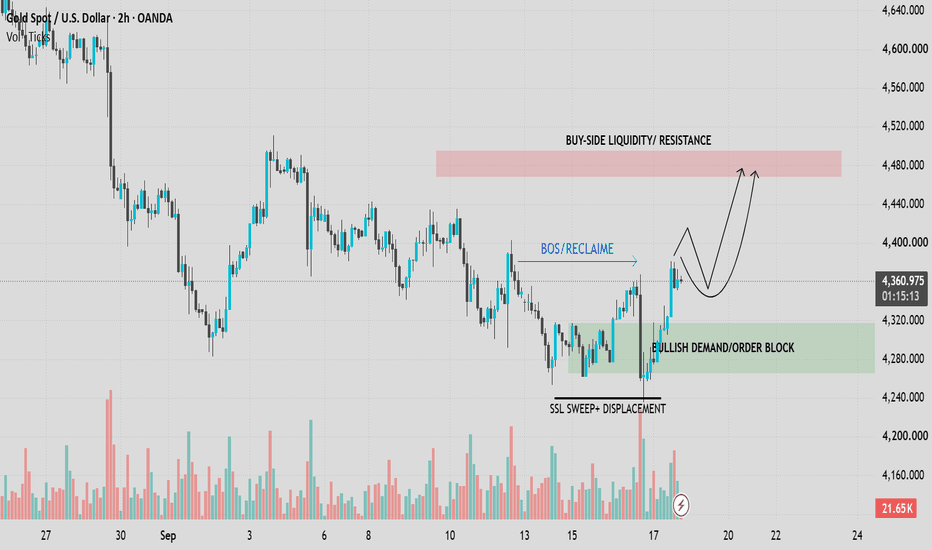
Short 
H1 Squeeze: 4,400 Trap Before 4,370 Flush Dump?
Macro Backdrop: Post-FOMC Repositioning & Friday Profit-Taking
Gold (XAUUSD) trades on the offensive near 4,363.265 (+0.09% floating) on Friday, September 18, 2026. Following the high-stakes Federal Open Market Committee (FOMC) rate verdict and policy projections, bullion is seeing an aggressive post-news short squeeze driven by dollar stabilization and position adjustments ahead of the weekend close. While long-term central bank gold accumulation and ongoing US sovereign debt sustainability concerns continue to provide an underlying macro floor, higher-timeframe institutional order flow remains heavily corrective. Smart Money is utilizing this Friday relief momentum to engineer an aggressive liquidity sweep into overhead supply blocks, trapping breakout retail buyers before unleashing a decisive liquidation flush.
📉 Technical Analysis: Bullish CHoCH, "Sell Calp" Ceiling & SMC Liquidity Roadmap
The updated H1 structural blueprint reveals a classic Smart Money Concepts (SMC) corrective mitigation and distribution cycle:
1. Structural Accumulation & CHoCH Breakout: Following repeated Break of Structure (BOS) markdown legs down to the 4,240 macro floor (LL), price established an accumulation base. An impulsive displacement candle broke through the local Lower High (LH at 4,360), printing a bullish Change of Character (CHoCH) and creating a new Higher High (HH at 4,385).
2. Local FVG & Demand Defense: The subsequent pullback into the Fair Value Gap (FVG at 4,320.000 — 4,335.000) was aggressively absorbed, keeping near-term bullish momentum intact.
3. Trend Indicator Overview: The H1 Trend Indicator remains technically Negative on the broad range (Upper Range: 4,381.065 | Mid Pivot: 4,308.115 | Lower Range: 4,235.165), confirming that this upward movement is a counter-trend relief squeeze.
4. Immediate Overhead Resistance / "Sell Calp" Box (4,395.000 — 4,410.000 Area): The middle blue resistance block labeled "Sell Calp". As outlined by the black zigzag trajectory, price is projecting an impulsive extension into 4,405 -> followed by an initial corrective dip to 4,380.
5. Primary Premium Supply Ceiling (4,425.000 — 4,440.000 Corridor): The upper unmitigated institutional supply block. A final parabolic push into this level sweeps remaining Buy-Side Liquidity (BSL) before meeting heavy institutional selling.
6. The Institutional Flush Trajectory: Heavy downward black arrow indicates a violent liquidation leg once the 4,430 ceiling is mitigated, slicing straight back down toward the 4,370 S/R Flip floor.
🔄 IF–THEN Playbook (Execution Scenarios):
• IF price taps the 4,395 — 4,410 "Sell Calp" Box or stretches into the 4,425 — 4,440 Premium Supply and confirms a lower-timeframe failure (M5/M15 CHoCH Reversal) -> THEN execute high-probability swing short positions targeting 4,380, 4,360, and the 4,370 S/R Flip floor.
• IF price pushes cleanly above 4,445 on an H1 candle close with sustained buy volume -> THEN pause the bearish rejection thesis and trail momentum longs toward 4,470+.
• IF price breaks directly below the 4,340 local higher low before reaching 4,400 -> THEN enter early continuation shorts targeting 4,308 (Mid Pivot) and 4,280.
🎯 Strategic Metrics Summary:
• Current Market Price: 4,363.265 (+0.09%)
• Trend Range: Negative (Upper: 4,381.065 | Mid: 4,308.115 | Lower: 4,235.165)
• Immediate Resistance: 4,395.000 — 4,410.000 ("Sell Calp" Box)
• Major HTF Supply Ceiling: 4,425.000 — 4,440.000
• Local FVG Support Floor: 4,320.000 — 4,335.000
• Post-Reversal Target Floor: 4,360.000 — 4,370.000 ($$$ S/R Flip)
• Structural Invalidation Level: Decisive H1 close above 4,445.000
Are you riding this Friday squeeze up to the 4,400 "Sell Calp" zone, or are you patiently waiting with sell limits at the 4,430 Supply ceiling to catch the heavy flush? Share your execution plan below! Short 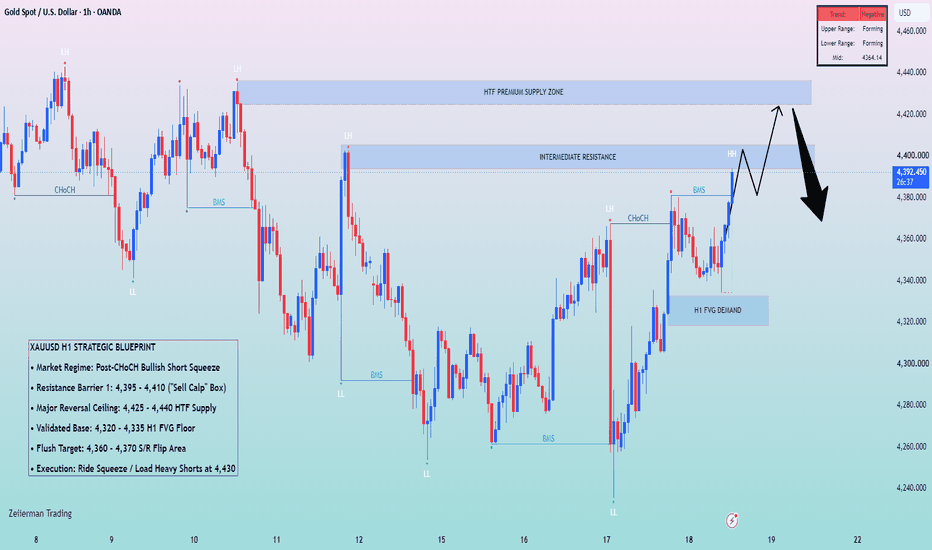
Short 
Long 
Gold (GC) Analysis, Key-Zones, Setup for Fri (Sep 18)Bias: Gold settled Thursday at 4,399.7 on the December contract, up 12.2 points or 0.28 percent, and the settlement hides a genuine reversal session. December opened at 4,301.4, already 86.1 points or 1.96 percent beneath the prior settlement of 4,387.5, printed a low of 4,294.5 and a high of 4,423.3, 3.00 percent above that low, and settled at 4,399.7, 81.7 percent of the way up a 128.8 point range. A market that gaps two percent lower on a hawkish central bank and closes green has absorbed the news. The gap itself was mechanical: the Federal Reserve raised rates 25 basis points to 3.75 to 4.00 percent on Wednesday, the first increase since July 2023, unanimously, with projections showing twelve of eighteen officials expecting one further increase this year and no cut next year. Thursday's ten-year inflation-protected auction at 1:00 PM ET then cleared at a 2.653 percent high yield against 2.438 percent previously, a direct and measurable rise in the opportunity cost of holding a non-yielding asset. The dollar index sat near 100.238 in evening trade after the 04:00 PM ET equity close, easing 0.10 percent but holding nearly all of its post-decision gains after setting a fresh one-and-a-half month high. What the recovery could not do is clear resistance: the advance stalled at 4,423.3 and settled 10.4 points beneath the 100-day average at 4,410.1, having pierced it intraday without holding it. Structurally the metal is a completed downtrend searching for a base at a neutral reading, trading 23.90 percent below its 52-week high of 5,781.8, beneath its 20-day, 100-day and 200-day averages but above its 5-day and 50-day, with a 14-day directional index of just 16.66 and positive direction 15.98 against negative direction 17.16, which is an absence of trend rather than a downtrend. The multi-indicator composite reads 16 percent sell at minimum strength with its trend component on hold, matching the readings on both equity index contracts. The 14-day stochastic %K at 32.00 percent sits in the lower part of its range. Bias is lower while 4,450 caps the bounce, with the 4,410 area the decision line, and the 9:15 AM ET data window the session's first identifiable catalyst, with Federal Reserve commentary carried on the news-feed calendar at 9:30 AM ET and unconfirmed against a primary source following it.
Resistance:
- 4,755.0 13-week and 1-month high, the lower high that defines the current swing sequence
- 4,579.3 Pivot R3, extended mechanical objective beyond one and a half average ranges
- 4,501.3 Pivot R2, converging with the 20-day average within 11.3 points
- 4,490.0 20-day moving average, first level whose recovery changes the structural read
- 4,450.5 Pivot R1, invalidation reference for the primary setup
- 4,423.3 session high, upper edge of the supply band
- 4,410.1 100-day moving average, nearest resistance of any kind and the decision line
Support:
- 4,387.5 prior settlement, the level the reopened session is trading beneath
- 4,372.5 Pivot Point, converging with the 5-day average at 4,371.1 within 1.4 points
- 4,342.0 50-day moving average
- 4,321.7 Pivot S1, second objective of the primary setup
- 4,294.5 session low, 6.9 points beneath a two percent gap-down open, with the settlement 105.2 points above it
- 4,273.3 1-month low, 21.2 points beneath Thursday's low, the pair forming base evidence
- 4,243.7 Pivot S2, first mechanical objective beneath the one-month low
- 4,192.9 Pivot S3, deepest level with mechanical basis for the session
Primary Setup: SHORT GC from the 4,410 to 4,425 supply band on a retest of the area where Thursday's recovery stalled, with the thesis resting on a bounce that reached the 100-day average and the session high without settling above either while the real-rate direction moved decisively against the metal. Stop 4,455, placed above Pivot R1 at 4,450.5, since a settlement through that level would mean the reversal bar is extending rather than stalling. Targets at 4,372 first, where the Pivot Point and the 5-day average converge within 1.4 points, 4,322 second at Pivot S1, and 4,295 third at Thursday's session low if momentum extends through the second target. The 14-day average true range is 105.2 points, or 2.39 percent of settlement, and the position carries half the normal allocation given a counter-trend entry ahead of a tentatively timed overnight central bank decision and a September quarterly expiration session, carried in the options positioning data rather than a verified calendar and unconfirmed, whose dollar flows can move the metal without conveying direction. The entry band sits above the settlement, so the setup requires strength before it activates rather than weakness. Pricing is likely to be disorderly around the 9:15 AM ET industrial production release and the Federal Reserve commentary from Bowman and Schmid carried on the news-feed calendar at 9:30 AM ET and 11:45 AM ET, both unconfirmed against a primary source. Gold settles at 1:30 PM ET, so the metal's session is decided ahead of the equity close. A decisive settlement above 4,450.5 negates the short case and puts the 20-day average at 4,490.0 and Pivot R2 at 4,501.3 in play. The overnight Bank of Japan decision, carried on the news-feed calendar at 11:30 PM ET on a tentative statement time and unconfirmed against a primary source, matters more to this metal than it appears, since a second major central bank tightening in the same week reinforces the global real-rate direction that has driven gold 23.90 percent below its 52-week high.
Friday is a decision session rather than a trend session for gold, and the decision is whether Thursday's reversal extends or stalls. The 14-day average true range is 105.2 points, or 2.39 percent of the settlement, and Thursday's 128.8 point range exceeded that average by 23.6 points. A one average-true-range day from the settlement spans 4,294.5 to 4,504.9, which puts Thursday's session low almost exactly on the lower bound and shows how much of a normal day's distance the recovery has already consumed.
Short 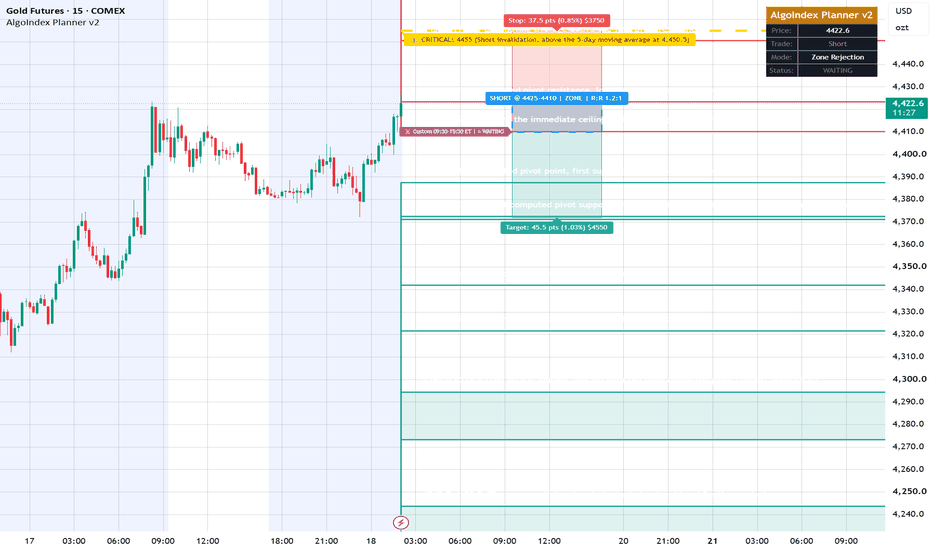
Bullish bounce off?Silver (XAG/USD) is falling towards the pivot and could bounce towards the 1st resistance.
Pivot: 64.83
1st Support: 62.45
1st Resistance: 67.91
Disclaimer:
The opinions given above constitute general market commentary and do not constitute the opinion or advice of IC Markets or any form of personal or investment advice.
Any opinions, news, research, analyses, prices, other information, or links to third-party sites contained on this website are provided on an "as-is" basis, are intended to be informative only, and are not advice, a recommendation, research, a record of our trading prices, an offer of, or solicitation for, a transaction in any financial instrument and thus should not be treated as such. The information provided does not involve any specific investment objectives, financial situation, or needs of any specific person who may receive it. Please be aware that past performance is not a reliable indicator of future performance and/or results. Past performance or forward-looking scenarios based upon the reasonable beliefs of the third-party provider are not a guarantee of future performance. Actual results may differ materially from those anticipated in forward-looking or past performance statements. IC Markets makes no representation or warranty and assumes no liability as to the accuracy or completeness of the information provided, nor any loss arising from any investment based on a recommendation, forecast, or any information supplied by any third party.  Long
Long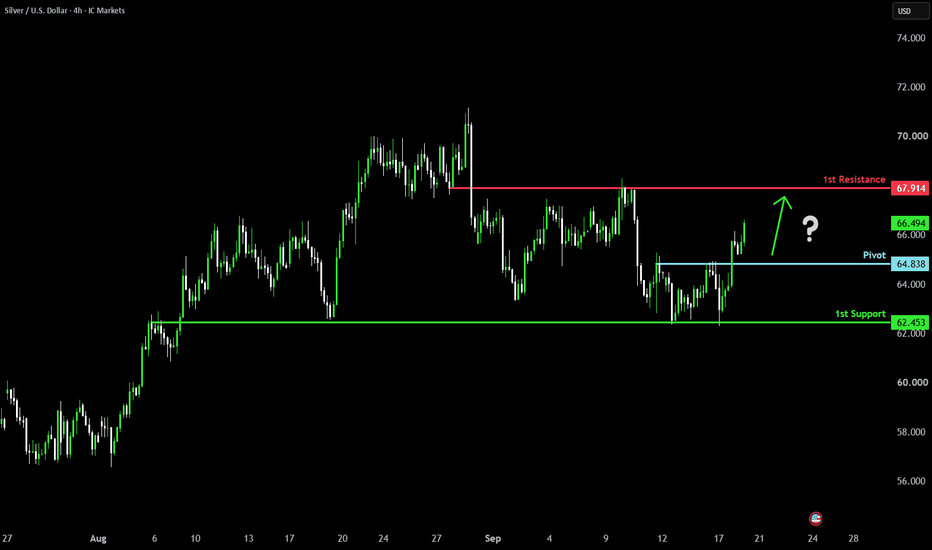
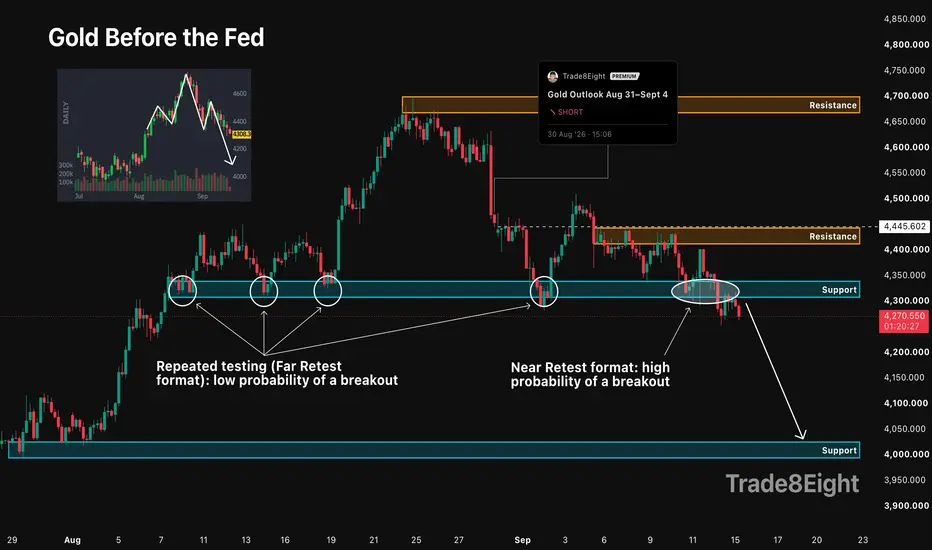
Gold Before the Fed⏱️ Reading time: 2 minutes
(Trading setup with Entry level, SL and TP)
TVC:GOLD is consolidating around $4,300 after repeated tests of support. I continue to favor a downside breakout, provided price can break and hold below the level.
🤔 Why 4300 matters?
Repeated tests can weaken support when buyers struggle to push price away from it. A close below the level with follow-through would strengthen the bearish case.
📌 Potential trade setup:
Priority direction: SELL
Entry zone: 4,295
Target: 4,030
Stop: 4,395
🏦 The Fed factor
The September 16 Fed decision is the next major catalyst. Rate-hike expectations and elevated US yields have pressured gold. With a hike largely priced in, further downside would be better supported by hawkish guidance and renewed strength in yields and the dollar.
♻ Alternative scenario
A brief move below $4,300 followed by a quick reclaim would raise the risk of a false breakout. A sustained recovery above the consolidation high would invalidate this setup.
🎓 The logic behind this market view is explained in more detail in my education material, which can be found in Related publications : “Near and Far Retests: What Every Trader Should Know”
If this post was useful, feel free to boost 🚀 it and share your view in the comments 💬
⚠️ Disclaimer: This is a public market view based on current analysis; market conditions and price direction are subject to change based on news factors and volatility. This is not financial advice. Please do your own research and manage your risk.
Short 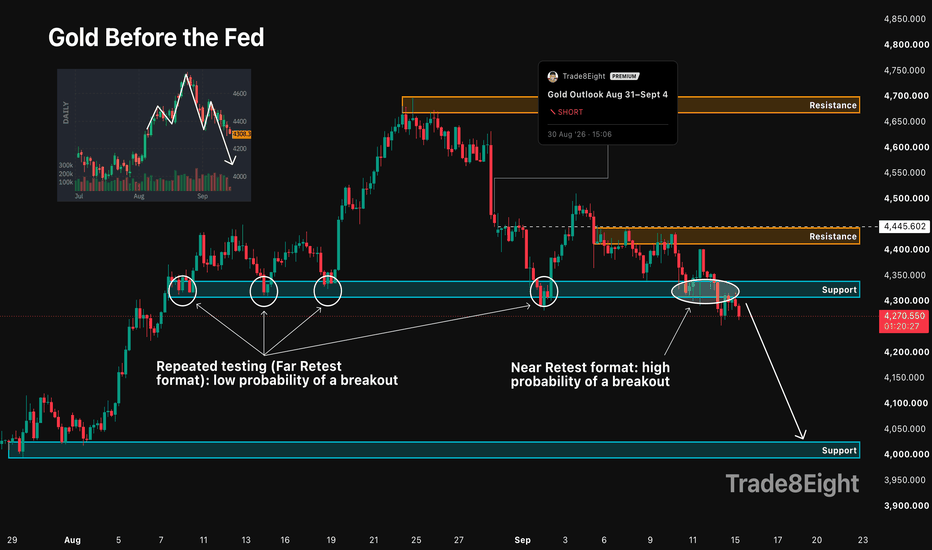
The chart shows gold trading inside a descending channel, with pThe chart shows gold trading inside a descending channel, with price currently near the upper part of the recent consolidation zone.
📉 Bearish setup
The marked structure favors downside if resistance continues to hold.
Resistance: 4,370–4,490
Key rejection zone: 4,370–4,400
First downside area: 4,300–4,250
Main target: 4,056
A 4H close below the recent swing lows would strengthen the bearish continuation setup.
📈 Bullish invalidation
If gold breaks and closes above 4,490 on 4H, the bearish channel setup becomes significantly weaker. A sustained breakout could shift attention toward higher resistance levels.
🎯 Trade structure from the chart
SELL zone: 4,370–4,400
SL: above 4,490
TP1: 4,300
TP2: 4,200
TP3: 4,056
At 4,360, price is just below the marked resistance, so chasing a short here gives less favorable positioning than waiting for either a rejection around 4,370–4,400 or a confirmed breakdown.
Key level to watch: 4,370.
Above it → bullish breakout risk.
Below it + rejection → bearish continuation setup. Short 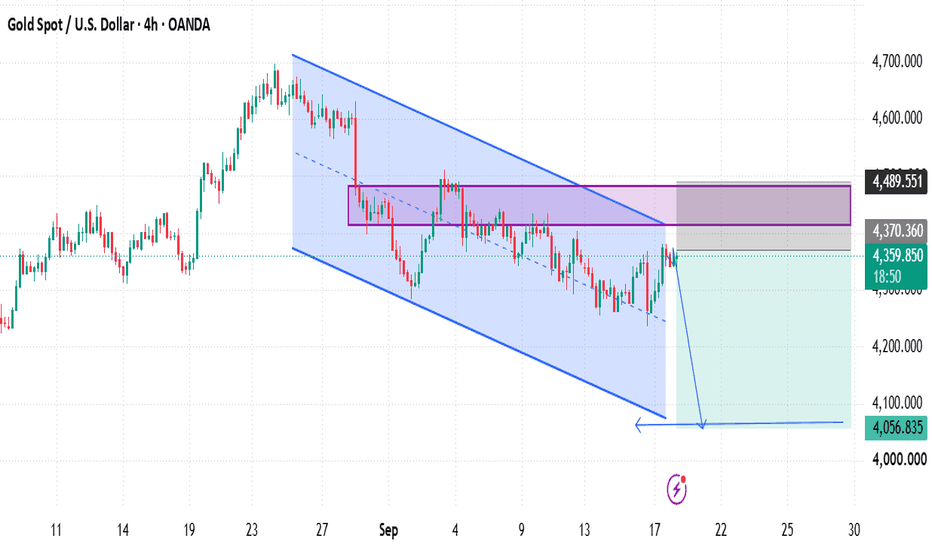
XAU/USD 15M: Bearish Rejection from Resistance — Target 4,303XAU/USD 15-Minute Technical Analysis
Current price: ~4,364
Structure: Price has been moving inside an ascending channel, but it is now testing the upper resistance/supply area.
Sell zone: 4,384–4,387 — key resistance where sellers may appear.
Major resistance / stop area: 4,415–4,417. A sustained 15-min close above this region would weaken the bearish setup.
Bearish target: 4,302–4,300, which aligns with the projected downside move and channel-support area.
Potential path: A rejection from 4,384–4,387 followed by a break below the recent intraday support could open the way toward 4,325, then 4,303.
Bullish invalidation: Strong acceptance above 4,387, especially a break and hold above 4,415, would invalidate the displayed short scenario.
Setup shown on the chart: bearish rejection → downside continuation toward 4,303.
Short 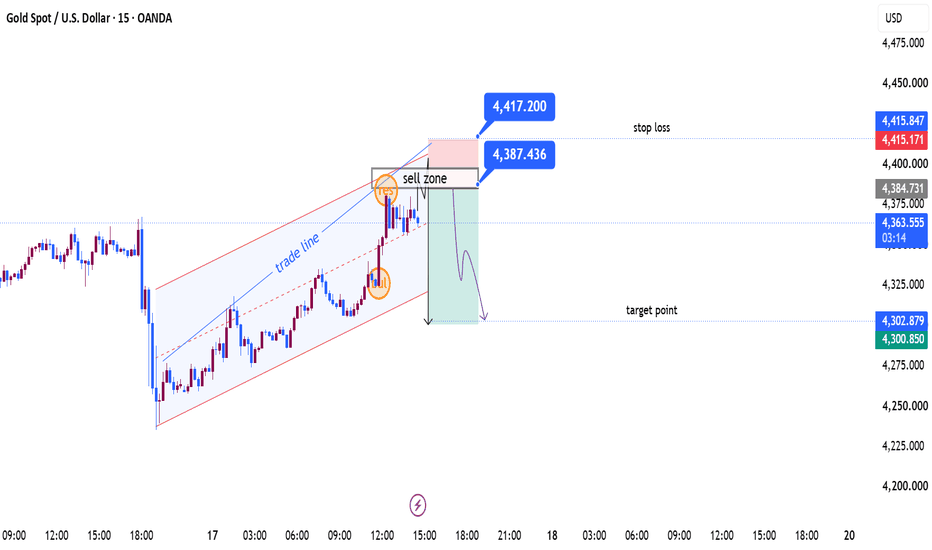
Why can't you always catch the market trends?From the current fundamentals perspective, the US dollar has continued to strengthen after the interest rate hike, and gold still faces the risk of further weakening. If the market continues to decline, the first support level to watch is 4200. If it breaks through this level, the next support level to watch is 4100. Looking at yesterday's gold price movement, the market generally showed a pattern of rising first and then falling. However, the main reason for yesterday's decline was still the market impact of the interest rate hike. Gold fell to a low of 4235 at the end of the session before rebounding quickly, indicating that there is still some support below. Currently, the overall price is still within the trading range, so there is no need to rush to place orders. Just wait patiently for the right position and signal.
In terms of technical indicators, the daily MACD histogram continues to expand, with the fast and slow lines forming a death cross and trending downwards, currently showing no clear signs of turning back. The RSI indicator has also fallen back into the weak zone, and is generally in a neutral to weak pattern, but has not yet entered the oversold zone. This means that the short-term bearish momentum has not been fully released, and there is still room for further decline. Therefore, from the perspective of the daily chart structure, the current trend of bearishness is still relatively clear, and short-term rebounds should be viewed more as corrections rather than a trend reversal. From the 4-hour chart, gold prices continue to move along the downward trend line. Each time there is a slight rebound, it is suppressed by the moving average and falls back again. The highs are constantly decreasing and the lows are constantly being refreshed, maintaining a relatively complete downward channel structure. In the short term, initial resistance is concentrated in the $4320-$4350 area, which is also the resistance area of the 100-day moving average. Further upside, the key resistance level to watch is the $4400 mark. Without a valid breakout, it will be difficult for the bulls to change the current short-term weak structure. From the hourly chart, although the rise after today's opening appears quite rapid, given the bearish news environment, the first thing to watch is the resistance level around 4320-4350. If the rebound reaches this area and encounters resistance again, then shorting opportunities can still be considered. The first support level to watch is 4257, the starting point of the rise. If this level is broken during the day, then the next level to watch is 4235. Conversely, if the price can quickly break through the resistance level of 4350, then the starting point of the decline at 4367 should be monitored. The current market volatility is already quite significant, so patience is needed in trading, and it is important to avoid repeatedly chasing the market in the middle. In summary, the recommended trading strategy for gold is to primarily sell on rallies and secondarily buy on dips. The key resistance level to watch in the short term is 4320-4350, while the key support level is 4230-4200. Short 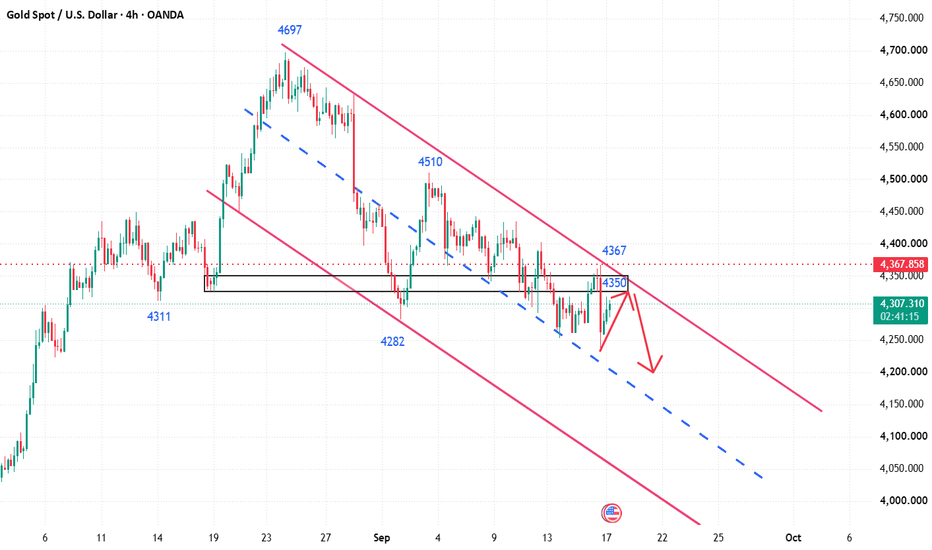
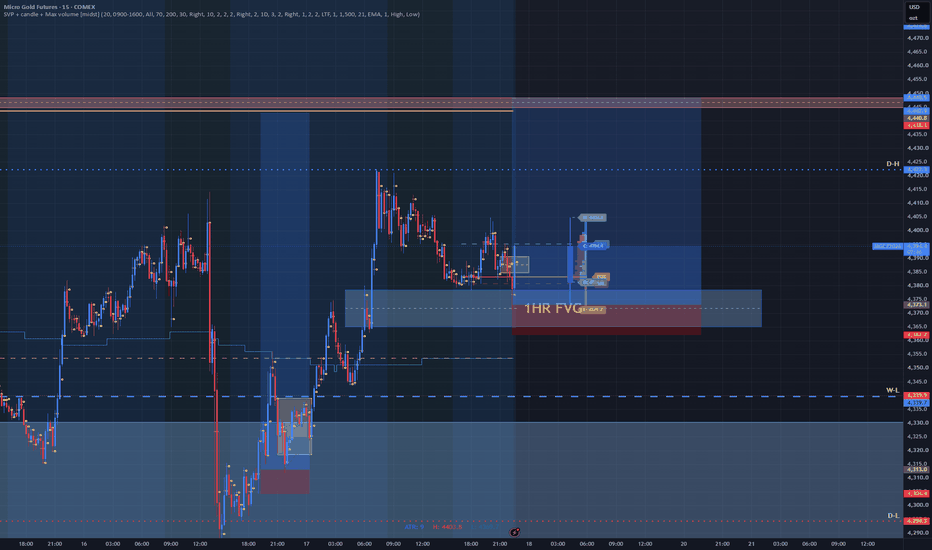
GOLD — THE SETUP FINALLY SHOWED ITS HANDYesterday I talked about waiting for Gold to come down into the H4 FVG, sweep the lows, and then show me whether buyers were actually going to step back in.
Well...
That's exactly what happened.
Price swept the lows, pushed into the area I was watching, and then buyers stepped in and started driving price higher.
I didn't try to catch the exact bottom.
I waited for the reaction.
And that patience paid off.
🔵 NOW WE HAVE A PULLBACK
Going into the NY session today, Gold started pulling back after the initial move higher.
Instead of chasing the move, I waited.
Price eventually came back down into the 1H FVG I had marked out.
That's where things got interesting.
At the same time, I'm watching GVZ and its IV Rank, which had moved into an area that, based on the way I use this tool, supported the potential for another strong move.
Now I had multiple pieces coming together:
Liquidity sweep ✅
H4 FVG reaction ✅
1H FVG pullback/fill ✅
GVZ/IV Rank confirmation ✅
Price reclaiming session value ✅
That's the type of confluence I'm looking for.
🎯 THE ENTRY
I took the long at:
4373.1
The important thing for me wasn't simply that price touched the FVG.
It was the reaction around the level.
I wanted to see buyers defend the area and price begin accepting back inside the session's value.
Once price moved back inside value, I was able to move my stop and take some risk off the table.
Now I'm simply letting the trade develop.
👀 WHAT I DON'T WANT TO DO
This is where trading can get dangerous.
Once you're in a trade and it's moving your way, it's very easy to start thinking:
"This thing is going to the moon."
😂
Nah.
I'm still watching the same thing I was watching before I entered:
Is price continuing to accept higher?
If buyers maintain control, I'll let it work.
If the market tells me that the move is losing momentum, I'll respect that too.
The setup doesn't become invalid just because I want the trade to keep going.
🧠 THIS IS WHY I WAIT
The original idea wasn't:
"Gold is going down into this FVG, so I'm buying it."
It was:
Let price come to the level → watch the reaction → confirm the buyers → then participate.
That's a completely different mindset.
The sweep gave me the location.
The FVG gave me the area.
Order flow and value helped me with the timing.
And once the market showed me buyers were willing to take control...
I got on the ride.
That's trading for me.
I don't need to predict the move.
I just need to be ready when the setup actually presents itself.
📈 CURRENTLY RIDING THE LONG FROM 4373.1
Now let's see what Gold wants to do.
Price showed its hand.
I just made sure I was paying attention. 👊🏾
#Gold #MGC #GC #GoldFutures #FuturesTrading #OrderFlow #PriceAction #FVG #LiquiditySweep #VolumeProfile #TradingView #DayTrading #FuturesTrader #MarketStructure #GoldTrading Long
XAU/USD: Market Analysis and Strategy for September 18Looking at this week's performance, gold declined over three days. Following the Federal Reserve's interest rate hike, the price of gold dropped sharply as the bearish news was priced in. Yesterday, during the Asian session, gold rose with support from the 60-day moving average (MA60) at $4,257 and continued to climb during the European session; it reached $4,380 during the US session before pulling back to close at $4,340. The MACD bearish momentum bars have significantly contracted, indicating that the bulls currently dominate the daily trend.
On the hourly chart, gold rose to $4,366 during the Asian session before retreating. The MACD fast and slow lines have crossed downwards above the zero line, and bearish momentum bars are expanding, suggesting a bearish short-term outlook. Given the bullish daily trend, the intraday strategy favors buying on pullbacks to support levels; key attention should be paid to the support at $4,315, which aligns with the 4-hour chart's middle Bollinger Band.
My recommendations:
BUY: 4335-4330 | SL: 4320 | TP: 4360-4380
BUY: 4312-4317 | SL: 4305 | TP: 4340-4350 Long 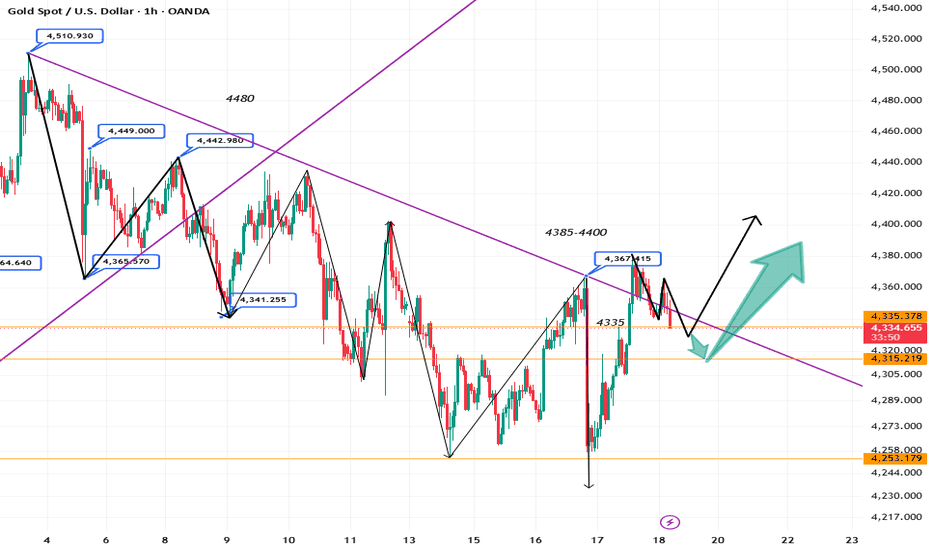
Long 
Long 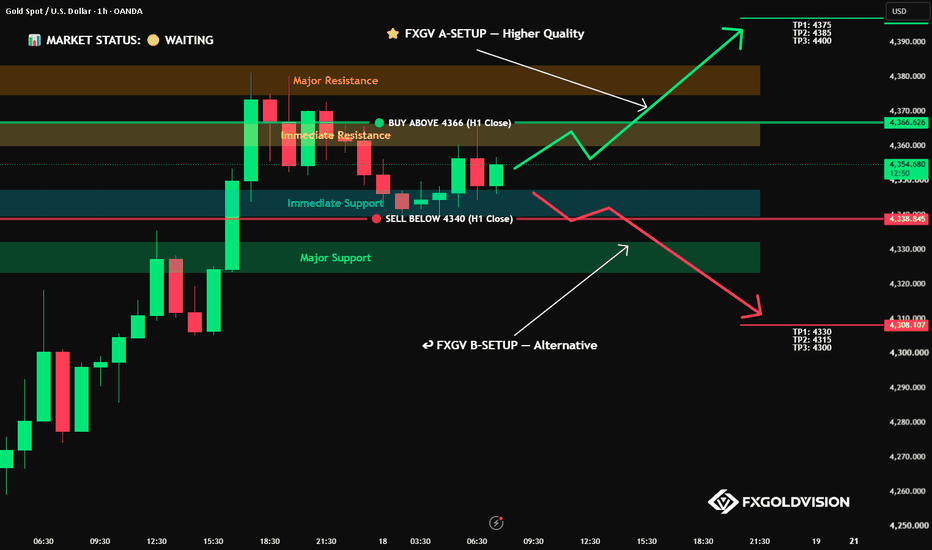
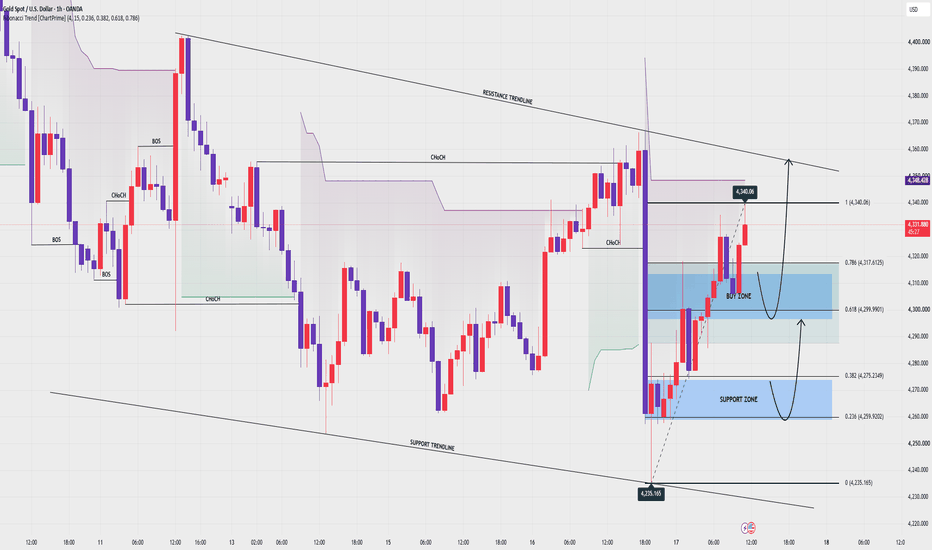
XAUUSD — Post-Fed Fibonacci Retest Buy SetupFundamental Analysis
Gold is recovering after the Fed-driven selloff as the U.S. dollar retreats from a seven-week high and oil prices ease, giving XAUUSD room to rebound. The Fed raised rates 25 bp to 3.75%–4.00% and maintained a hawkish stance, with most policymakers still expecting at least one additional hike this year.
The macro backdrop therefore remains mixed: tighter Fed expectations continue to limit upside, but softer energy prices and a weaker dollar are supporting the current recovery.
Technical Analysis
On H1, XAUUSD is trading near 4,326 after the post-Fed liquidation reached 4,235 and triggered a strong recovery.
Price has already reclaimed the 4,300 psychological area and reached 4,335, confirming improving short-term momentum. However, the broader structure is still capped by the descending resistance trendline.
The preferred retracement area is 4,297–4,314, where Fibonacci 0.618–0.786 and the marked H1 buy zone converge.
If buyers defend this area, price could first retest 4,335, then extend toward the descending trendline around 4,350–4,360.
The deeper 4,258–4,273 support zone remains an important structural defense if the first buy area fails.
Important Key Levels
4,350–4,360 — Trendline resistance / main target
4,335 — Immediate resistance
4,297–4,314 — Main buy zone
4,286–4,297 — Short-term pivot
4,258–4,273 — Major support
4,235 — Post-Fed low
Trading Scenario
Main Buy Setup
Entry: 4,297–4,314
Stop Loss: 4,280
Take Profit 1: 4,335
Take Profit 2: 4,350
Take Profit 3: 4,355–4,360
Buy Condition
Wait for a controlled pullback into 4,297–4,314 and bullish confirmation. A liquidity sweep, long lower wick, bullish engulfing candle, or H1 reclaim above 4,314 would strengthen the continuation setup.
A sustained H1 break below 4,280 would invalidate the immediate buy idea and shift attention toward the deeper support zone.
Overall View
The short-term H1 structure is shifting into bullish recovery after the Fed liquidity sweep, but the broader descending trendline has not yet been broken.
The preferred plan is therefore to avoid chasing around 4,325–4,335 and wait for a retracement into 4,297–4,314. If buyers defend this Fibonacci zone, XAUUSD could retest 4,335 before challenging 4,350–4,360.
Will gold hold 4,297–4,314 and retest the H1 resistance trendline? Long