Futures market
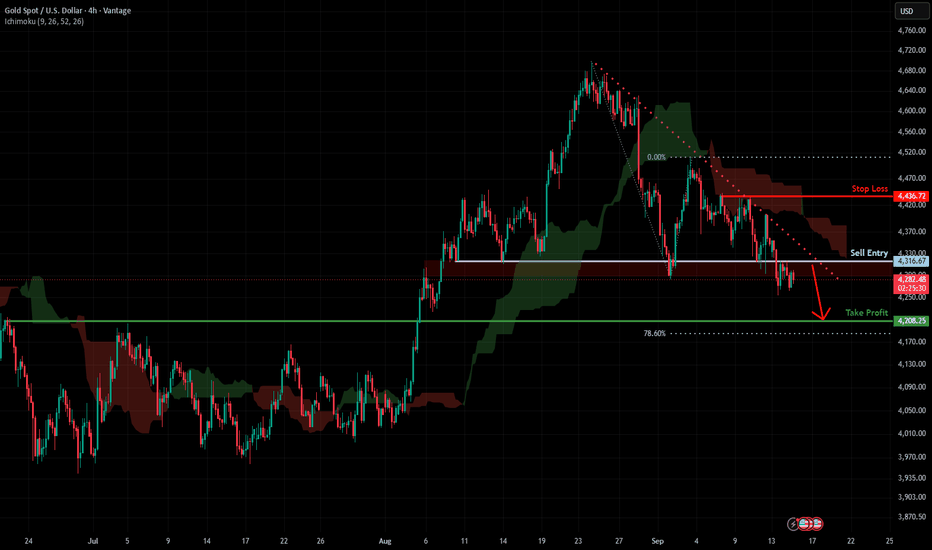
Sell short on rallies; do not chase the market down or up!Gold is approaching a critical breakout point; look to sell into rallies—do not blindly chase the market up or down!
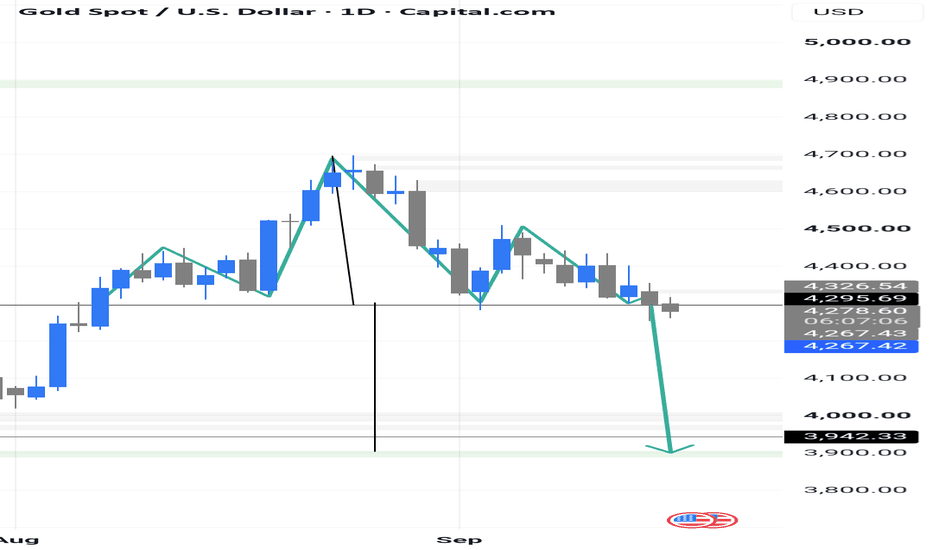
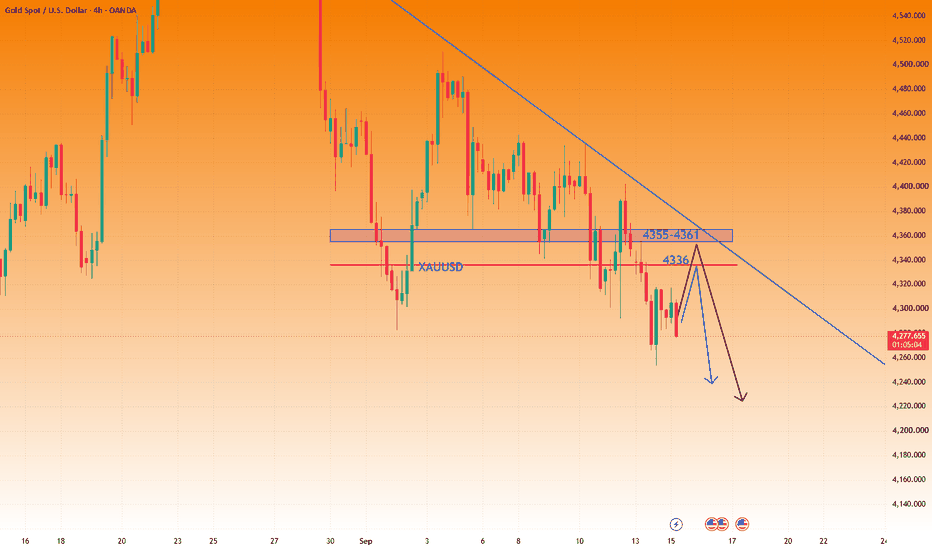
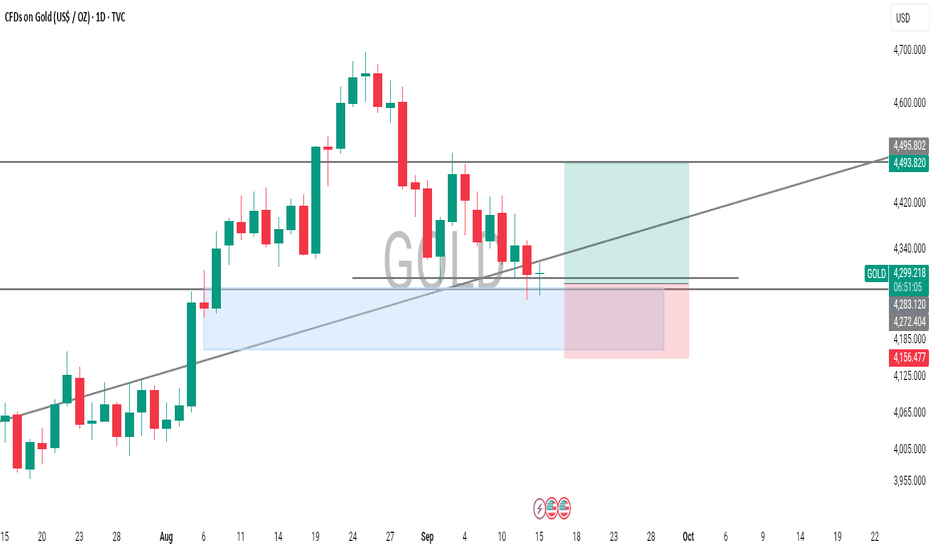
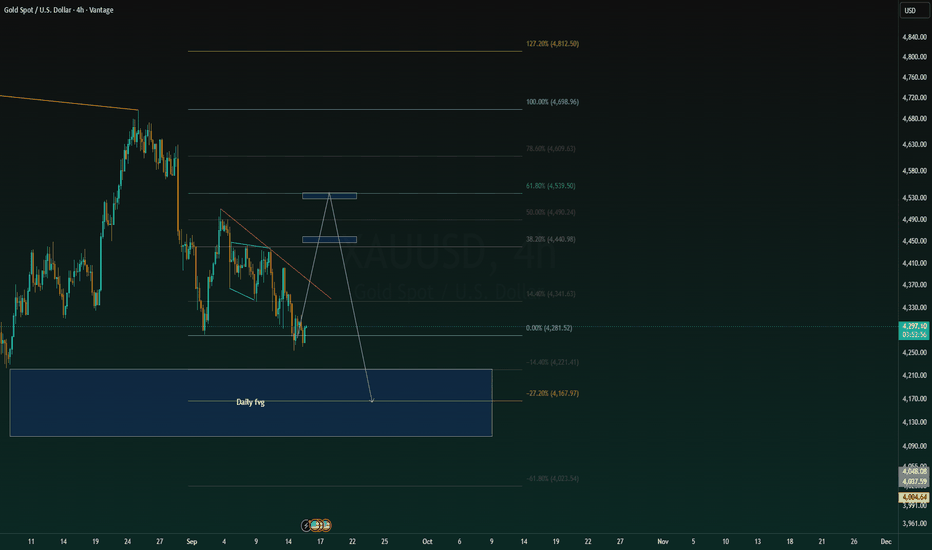
The US dollar and US Treasury bonds have seen a strong rebound. Although recent CPI and PPI figures indicate a slowdown in inflation, the renewed rise in oil prices will put renewed pressure on the Fed's potential rate hike in September, offsetting the upward sentiment in gold prices. In reality, the price has decreased rather than increased, and the overall market remains under pressure. From a technical perspective, gold's daily chart shows a continued bottoming process with a bearish candle, and the price action within the downward channel is narrowing, indicating continued weakness. A downward breakout is possible today, but given that today is the weekly close, a period prone to market shakeouts, avoid chasing the market down. Maintain a strategy of selling on rallies. Resistance levels are at 4016-17 and 4055-60, while support is at 3970-60. A break below this level would target 3942, or even below 3900. Remember, avoid chasing highs and lows, as the market is prone to false breakouts followed by upward rallies!
Recommendation: Short gold around 4055-60.
Short positions yielded over 100 points of profit!
Short positions have yielded profits of over 100 points!
I initiated short positions at 4100 on Tuesday, 4080 on Wednesday, and 4055 today—successfully capitalizing on rebound highs for three consecutive days. I have consistently emphasized that short-selling is the dominant trend, and to date, we have locked in profits totaling several hundred points. This accurate judgment is not a matter of chance or luck, but rather the result of more than a decade of experience and solid skills accumulated through in-depth market analysis. All live trading students can verify that all strategies and ideas are publicly available, synchronized, and verifiable. I am always open and honest and never exaggerate or fabricate anything.
Currently, market sentiment is dominated by bears, the rebound is extremely weak, and the overall downward trend remains unchanged. The first short-term resistance is currently around 4040; a break below this level would turn it into short-term resistance. Strong intraday resistance lies in the 4070-4080 area, which is yesterday's rebound high. The short-term downside targets are 3960-3950-3943, while the key support level for the longer term is at the 3900 mark.
Logic of Comprehensive Bearish DominanceLogic of Comprehensive Bearish Dominance
(Absolute market control on Friday; "sell the rally" strategy)
📶 1. Macro-level interest rate pricing has decisively reverted to a bearish theme.
The core logic previously supporting this rally was "falling inflation → rising expectations of Fed rate cuts." However, retail sales and initial jobless claims data have confirmed the extreme resilience of the US economy, indicating that the decline in inflation was merely a temporary fluctuation. Without a recession to necessitate monetary easing, there is no fundamental support for Fed rate cuts. Wall Street institutions have once again converged on the view that high interest rates will persist for the long term. As a non-yielding asset, gold faces continued downward valuation pressure in an environment of rising real US Treasury yields; there is no basis for a reversal of the medium-term bearish trend.
🚀 2. A triple-threat cycle of perpetual selling pressure leaves rallies without buying support.
① Programmed selling from Yen carry trades: The wide interest rate spread between the USD and JPY triggers automated scripts in carry-trade funds to sell gold—repatriating dollars to repay Yen-denominated debt—whenever the price sees a minor uptick, effectively capping any rebound.
② Cascading sell-off triggered by stop-loss orders: Following the breach of key support levels at 4000 and 4020, a surge of long-position stop-loss orders was executed, creating a negative feedback loop; there is no active buying interest to support the price level below.
③ Sustained institutional capital outflow: The SPDR Gold ETF has again significantly reduced its holdings, and speculative long positions on Wall Street are actively closing out; with no new long-term capital entering to "buy the dip," any price rallies are merely "bull traps."
🌐3. Bearish structure confirmed across multiple timeframes; rebound pattern decisively broken
Weekly timeframe: After hitting a high of 4202 (forming a double top) earlier in the week, the price has retreated steadily; it is currently retesting the lower band of the weekly chart. The week is highly likely to close with a large bearish engulfing candle, further reinforcing the weekly bearish trend, with the 5-week moving average at 4160 acting as strong medium-to-long-term resistance.
Daily timeframe: The previous V-shaped rebound structure (3983–4202) has completely ended. The price has broken below the critical dual support of the 5-day and 10-day moving averages; the moving average system has turned downward, forming a bearish alignment.
The MACD bearish (green) histogram has expanded again, signaling the official opening of a downward channel.
Short-term (1-hour/4-hour) timeframes: A stepped downward channel has fully formed. Short-term moving averages are consistently suppressing the price; the price turns downward whenever it touches the moving average resistance, characterizing a standard bearish continuation pattern.
Pivot Cluster6/9 28520
6/10 28557
7/17 28554
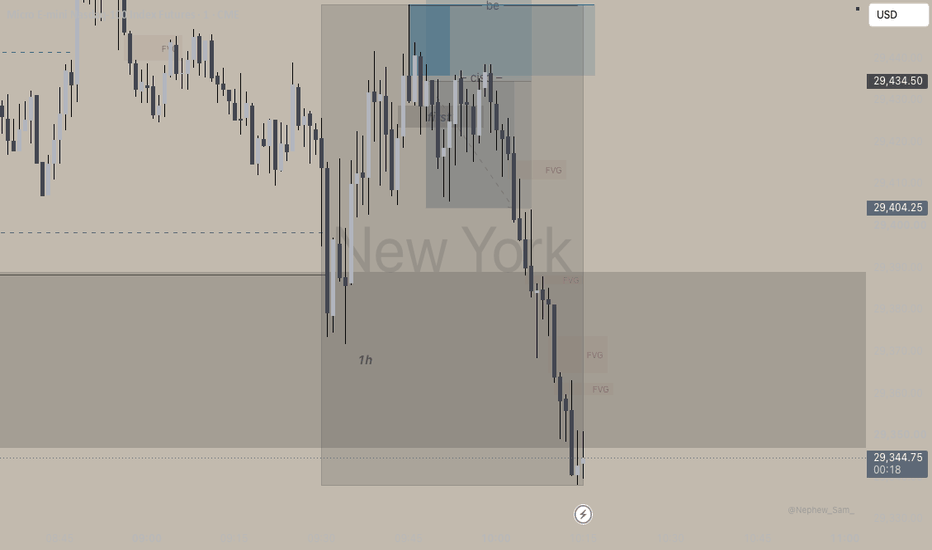
NY is probing not liquidating
NY is respecting London's sell-side sweep
NY is in absorption-verification mode
Trade the Sequence 15s bars
IF sweep THEN reclaim
IF reclaim THEN hinge
IF hinge THEN break
IF break THEN trade setup is valid
Entry: buy pullback to the lip
Bears flip the script
The Atomic Logic Chain (IF-THEN)
Correct Mechanics + Correct Structure + Correct Logic = Correct Trade
XAU/USD | Gold Outlook | Safe Haven vs Risk AppetiteGold remains caught between safe-haven demand and profit-taking near key resistance. Markets continue to digest geopolitical uncertainty, central bank expectations, and persistent global trade tensions. Any escalation in geopolitical conflicts or renewed economic uncertainty could quickly revive bullish momentum, while easing tensions may trigger short-term pullbacks.
Key Levels
🟢 Bullish above: 3,992
🔴 Bearish below: 3,986
Market Focus
🌍 Geopolitical developments remain the biggest catalyst.
🏦 Central bank commentary and rate expectations continue to influence gold.
💵 U.S. Dollar strength could limit upside, while weaker yields may support buyers.
⚠️ Expect volatility around macro headlines rather than technicals alone.
Trading Thesis
Gold is no longer trading on charts alone—it's trading on headlines. Stay disciplined, manage risk, and let price confirm the next move.
GOLD Analyses-8, [July 17, 2026]Welcome to my page! I share daily technical analyses of Gold and other charts here.
FX:XAUUSD
💡Market Analysis:
Gold is in a clear downtrend, currently trading in a range below the descending trendline. We anticipate a continuation of the bearish movement from the key resistance level of 4,001.00 toward the major support at 3,972.87.
Key Support & Resistance:
Key Resistance: 4,001.00 - 4,016.13
Key Support Area: 3,972.87 - 3,960.62
🎯 Trade Entry & Exit Plan:
Entry : Breakout/Pullback of trendline or key zones with >50% candle body.
Stop Loss : Behind the last wave or the last breakout candle.
Take Profit : Minimum R:R 2, with further targets at major horizontal levels.
⚠️Risk Management:
Maximum 1% risk per trade.
❤️Please share your thoughts and comments on this analysis!
GOLD Will Grow! Long!
Take a look at our analysis for GOLD.
Time Frame: 4h
Current Trend: Bullish
Sentiment: Oversold (based on 7-period RSI)
Forecast: Bullish
The market is approaching a significant support area 3,969.23.
The underlined horizontal cluster clearly indicates a highly probable bullish movement with target 4,062.29 level.
P.S
Overbought describes a period of time where there has been a significant and consistent upward move in price over a period of time without much pullback.
Like and subscribe and comment my ideas if you enjoy them!
Trade 17-07-26 XAUUSDPEPPERSTONE:XAUUSD
This time, the trade moved very quickly—I didn't have time to react. I was hoping to sell much higher, but I missed the opportunity while I was checking other assets. After reviewing the other assets and realizing there would only be one opportunity in the S&P 500, I went back to gold, and my target zone had already been confirmed, but I should have sold a little higher.
Gold | One More Wave… or Has Wave B Already Begun?XAUUSD | 2H Elliott Wave Update
According to the higher-degree Weekly and Daily wave counts, Gold continues to develop Wave IV. This analysis is based on the Elliott Wave Principle, following both its core rules and structural guidelines while focusing on market structure rather than price prediction.
The primary focus of this update is a Leading Diagonal, currently identified as part of Wave A. Price has now reached a region where this structure may be complete. However, until the market provides structural confirmation, the Leading Diagonal cannot be considered finished with certainty.
According to the Elliott Wave Principle, Waves 2 and 4 within a Leading Diagonal must unfold as Zigzag corrections, whether single, double, or triple. Likewise, Waves 1, 3, and 5 may develop either as Impulses or as Zigzags, with those Zigzags also appearing in single or multiple forms.
At the current stage, Wave 5 of the Leading Diagonal is displaying signs of structural complexity. Therefore, two scenarios remain equally valid. The first suggests that the Leading Diagonal has already been completed and the market is ready to begin Wave B. The second assumes that one final minor decline—or a brief capitulation move—is still required before the diagonal can be considered complete.
From a structural perspective, a confirmed breakout above the descending corrective channel would provide the first meaningful evidence that Wave B has begun. Until then, additional downside movement within the current structure remains a valid possibility.
Once the Leading Diagonal is confirmed complete, the preferred scenario is for Wave B to unfold, followed by Wave C, ultimately completing Wave IV as a classic A–B–C Zigzag. Fibonacci retracement levels may help identify potential reversal zones, but in this analysis, market structure always takes precedence over price ratios.
Research Notes
One observation that has repeatedly caught my attention is the visual similarity between some Leading Diagonals and Triple Zigzags. In several markets, I have seen price confined within converging trendlines, initially appearing to be a textbook Leading Diagonal. However, as the structure matured, it became evident that the market was actually developing a Triple Zigzag.
This occurs because multiple Zigzags can sometimes produce a wedge-like appearance. For that reason, visual pattern recognition alone is never sufficient. The internal wave relationships and the structural rules of the Elliott Wave Principle remain the decisive factors.
Another key element is the relationship between Gold and the U.S. Dollar Index (DXY). Although these markets generally maintain an inverse correlation, historical observations suggest that this relationship is not always constant. There have been periods in which Gold continued building a bullish structure despite a rising Dollar Index. In such situations, one market appears to be correcting through time, while the other progresses toward a price objective.
For this reason, I place greater emphasis on wave structure and price behavior than on traditional intermarket correlations alone.
Unless the market proves otherwise, my preferred expectation remains unchanged: once the Leading Diagonal is complete, Wave B should develop first, followed by Wave C, ultimately completing Wave IV as a classic Zigzag correction.
Price is the outcome; Structure is the cause.
Patterns whisper. I listen.
— Mr.Nobody
Gold Spot / U.S. Dollar
7 days ago
Gold | One More Wave… or Has Wave B Already Begun?
Gold Spot / U.S. Dollar
May 17
Gold 4H: Leading Diagonal or Just the Beginning?
Scalping - Gold prices consolidate and fall below 4037.1. Trend
Short-term bias: Bearish.
Gold remains below EMA89, showing the medium-term trend is still bearish.
Price has broken below the previous ascending trendline, turning it into resistance.
EMA9 is below EMA89, while price is trading beneath both EMAs.
The latest rebound appears to be a technical pullback, not a trend reversal.
➡️ The H1 structure still favors sellers.
2. Key Resistance
4,031–4,036
Immediate resistance.
Former trendline support, now acting as resistance.
Confluence of EMA9 and the broken trendline.
4,047–4,055
Major resistance zone.
Near EMA89 and recent swing highs.
A rejection here could trigger another bearish move.
3. Key Support
4,000–4,005
Immediate psychological support.
A break below could increase selling pressure.
3,985
Major support.
Previous swing low and the next downside target if bears remain in control.
4. Technical Signals
EMA9 < EMA89: Bearish momentum remains dominant.
RSI (~45): Neutral with room for further downside.
The broken ascending trendline suggests buyers are losing momentum, while rallies toward resistance may attract fresh selling.
---------------
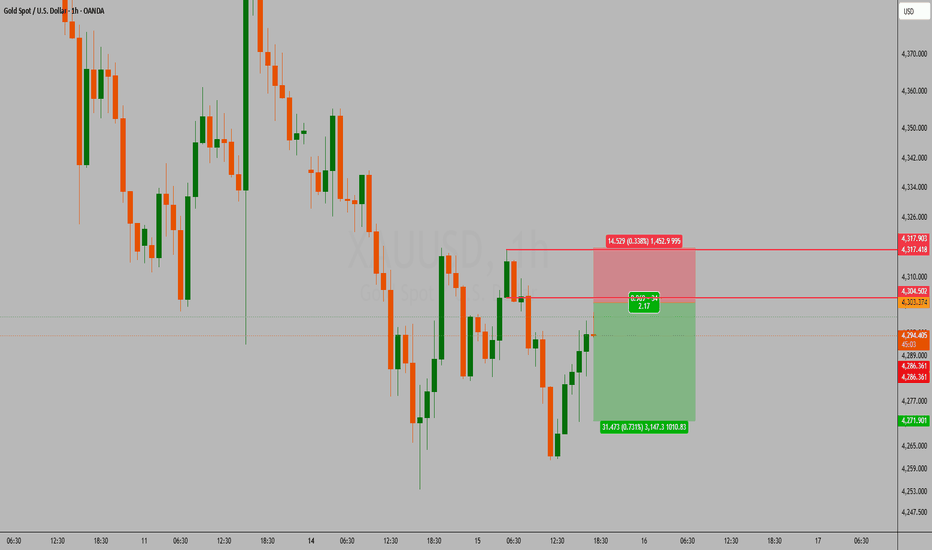
SELL GOLD zone : 4035 - 4038
SL : 4043
TP : 4022 - 4005 - 3982
-----------------
Gold Market Analysis | July 15
Buy gold first, then short gold.
290+ PIPS Profit Secured | Range Trading Continues 🚀
Dear fellow traders, good morning! ☀️🙏
In yesterday’s analysis, we identified:
🔥 4090-4100 USD
as the key resistance zone for short positions.
During the live market session, we provided the sell signal:
📌 4090-4095 USD Short Entry
Gold moved lower as expected and reached:
🎯 4050-4060 USD Support Zone
When bearish momentum slowed near support, we closed the position and secured:
💰 290+ PIPS profit ✅
Congratulations to all traders who followed our strategy! 👏
Successful trading comes from:
✅ Clear analysis
✅ Patience and discipline
✅ Strict risk management
🌎 Fundamental Analysis | Market Outlook 🔍
On Wednesday, July 15, gold opened slightly weaker.
The price was affected by:
📉 Previous session’s late pullback pressure
🌍 Rising geopolitical risks
🛢️ Stronger oil prices
Although recent inflation data showed signs of cooling, the impact may be limited.
As long as:
⚠️ Geopolitical risks remain
⚠️ Oil prices stay elevated
gold may continue facing pressure.
Therefore, today’s market may remain:
📊 Range-bound with both long and short opportunities.
📌 Key Economic Events Today
The market will focus on:
🇺🇸 US June PPI data (YoY & MoM)
Based on yesterday’s CPI data and market expectations:
📉 Further inflation cooling is possible,
which could reduce rate pressure and support gold.
However:
📈 Stronger New York Fed manufacturing expectations
🛢️ Oil price movements
🌍 Geopolitical uncertainty
may limit gold’s rebound.
Current approach:
➡️ Buy first, then look for selling opportunities at resistance.
📈 Gold Technical Analysis
The overall gold structure remains:
📉 Weak consolidation
There is still no clear signal of a major bullish reversal.
The most important level to watch:
🔥 4200 USD
Remember:
As long as gold cannot break and hold above 4200:
➡️ All rebounds below this level should be considered technical recoveries.
However, there is no need to become overly bearish.
The key support remains:
🟢 3940 USD
As long as this level holds:
➡️ Bulls still have opportunities to recover.
The market currently needs a catalyst to choose the next direction.
📊 Technical Structure | Daily & 4H Chart
Tuesday’s daily candle closed higher.
The Bollinger Bands are narrowing:
➡️ Market volatility is decreasing.
However:
Gold has not yet stabilized above the 4H Bollinger middle band.
This shows:
⚠️ Bullish momentum is not strong enough yet.
Current trading range:
🔥 4000-4100 USD
Before the range breaks:
📌 Focus on short-term range trading.
Trade:
⬆️ Sell near resistance
⬇️ Buy near support
Only after a clear breakout:
➡️ Follow the larger trend.
🔑 Important Levels Today
🔴 Resistance:
🔥 4050-4060 USD
🔥 4100 USD
🔥 4200 USD (Major trend level)
🟢 Support:
🔥 4000 USD
🔥 3980-3970 USD
🔥 3940 USD (Key support)
🎯 Gold Trading Strategy | July 15
🔻 Short Setup:
Entry:
🔥 4050-4060 USD
Stop Loss:
🛑 4080 USD
Targets:
🎯 4000 USD
🎯 3980 USD
🟢 Long Setup:
Entry:
🔥 3980-3970 USD
Stop Loss:
🛑 3960 USD
Targets:
🎯 4020-4030 USD
📌 Market Summary
Current gold market:
➡️ Short-term: Range consolidation
➡️ Above 4200: Bullish trend confirmation
➡️ Below 3940: Bearish pressure increases
The key factors remain:
🌍 Geopolitical developments
🏦 Fed policy direction
💵 Dollar movement
Do not force a single direction before the market chooses.
Trade the levels, control risk, and wait patiently. 📊
💬 Community Discussion
Dear traders, what is your view on gold today? 🤔
1️⃣ Will gold break above 4100 and challenge 4200? 📈
2️⃣ Or will resistance push price back toward 4000? 📉
Share your analysis below 👇
👍 Like for support
🔔 Follow for daily gold analysis
💬 Comment your trading plan
Wishing everyone:
💰 Profitable Trading
📈 Consistent Results
🏆 Successful Trading Day! 🚀
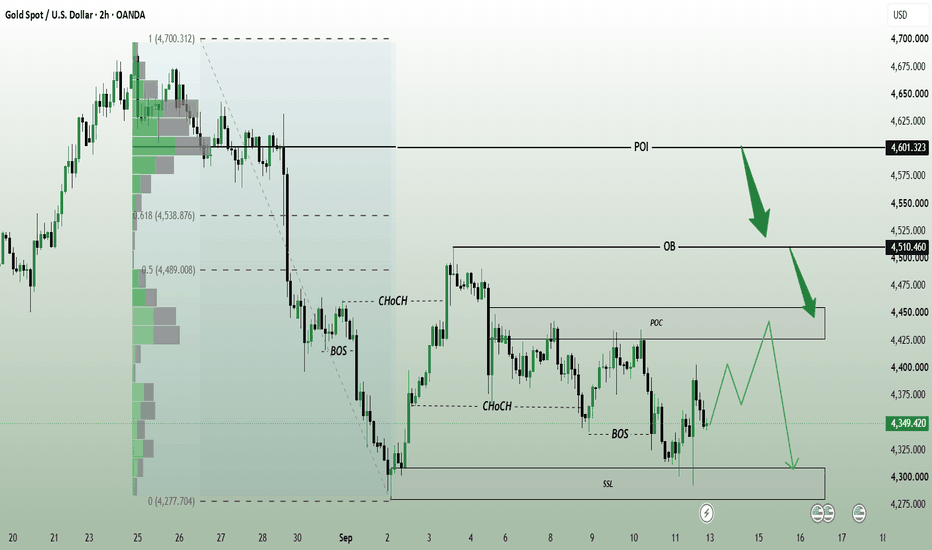
Gold Bulls Still Have Work To Do | XAUUSD 17/07Gold has bounced sharply from the H1 Bullish Order Block and Demand Zone, convincing many traders that a larger recovery may already be underway.
The problem?
The market hasn't confirmed that story yet.
Price remains below the H1 POI, SMALL OB, and the descending trendline, meaning buyers have yet to reclaim the key resistance levels needed to shift the current market structure.
For now, demand is holding.
But buyers still need to prove they can break through overhead resistance before any larger bullish reversal can be considered.
Currently
• Price reacted strongly from the H1 Bullish OB + Demand Zone
• Recent sell-side liquidity has been swept
• Buyers are building a short-term recovery
• Market remains below the H1 POI and SMALL OB
• Descending trendline continues to cap price
• Higher-timeframe bearish structure remains intact
• Buy-side liquidity rests above recent highs
Trading Plan
Bias: Bullish Retracement Within a Bearish Structure
Main Zone
• 3,965–3,980 → H1 Bullish OB + Demand Zone
Execution Idea
As long as the H1 Bullish OB and Demand Zone continue to hold, buyers may extend the recovery toward the POI and SMALL OB. A successful reclaim of these resistance levels would expose the H1 Liquidity zone around 4,130.
However, losing the demand zone would likely hand control back to sellers and resume the broader bearish trend.
Targets
→ TP1: 4,030 → H1 POI
→ TP2: 4,070 → H1 SMALL OB
→ TP3: 4,130 → H1 Liquidity
→ TP4: 4,160–4,180 → H1 Order Block
Invalidation
A confirmed H1 candle close below the 3,965–3,980 Bullish OB and Demand Zone would invalidate the recovery scenario and suggest sellers are regaining control.
Key Insight
A bounce from demand is not the same as a confirmed trend reversal. Buyers have defended support, but they still need to reclaim key resistance before the H1 bearish structure can truly change.
Key Question
Is Gold building a stronger recovery, or is this just another retracement before sellers return?
CHRONO-SPHERE GEOMETRY / Tape Reading / NQU2026 / 15M - 16/07/26ECONOMIC NEWS RELEASE CONTEXT:
Retail Sales – High Impact
OPERATOR MANDATE: Engage in London and New York PM sessions only (London Close after 12:30 ET)
1. ASIA SPHERE (Green-outlined sphere on left/west):
Initial Manipulation indicated bullish with bearish distribution. Price ranged in and around the Projective Volatility Cone (PVC).
2. LONDON MANIPULATION SPHERE (Bronze solid small center sphere):
Late bullish retracement into a SIBI formed within the sphere pulled price back up to southern boundary level of the sphere by 05:15 ET. True geometric compliance!
3. LONDON DISTRIBUTION SPHERE (Bronze-black tinted larger center sphere):
Sound bearish distribution occurred to below Asia Sphere-south level.
4. NY AM MANIPULATIOIN SPHERE (Yellow solid small sphere mid-right/east):
Price manipulated bullishly by retracing up into ever-so-small SIBI formed within the London Session once at 09:30 session and then again at 10:30 both within the NY Manipulation Sphere timeline. True geometric compliance!
5. NY PM DISTRIBUTION SPHERE (Cluster of 3 spheres to the furthest right/east):
Price steadily distributed bearishly for the remainder of the day from New York Sphere-south to beyond the Global Sphere boundary in the PM Session.
Desk Audit Status:
Observation logged. Time-price nodes and structural footprints complied completely with the Chrono-Sphere geometry.
Gold market projects taking out 3930Gold continues to reinforce its **bearish sentiment**, with sellers maintaining control of the prevailing market structure. Current price action projects a further downside extension, targeting the **3930** zone as the next key liquidity objective.
follow for more insights , comment and boost idea
Daily Analysis and Reaction Locations [2026-07-16]Previous session violated the internal high — could be an early indication for continuation higher. But given the broader market context, this could also just be a liquidation event. Right now, that leaves an unresolved range without a confirmed direction.
There's a reference below the previous day low I'm watching. As long as that holds, I'm leaning up for the session.
Still two-sided — no confirmed direction yet.
Grab the chart or zoom out on the preview to see all zones.
Trade Idea
Taking the pre-market push higher, targeting the POC — that's anchored to the new internal low, which hasn't confirmed yet either. Once price reaches the POC, I'm watching for confirmation that price wants to turn lower before considering anything on that side.
Shared for educational and analytical purposes only — not financial advice or a trade recommendation. Entries, stops, and targets are shown for study, not signals to copy.
Coffee Coiling Between 306.50 & 325.00 — The Break Decides▪️ COFFEE H4 SNAPSHOT — EXECUTIVE SUMMARY
▪️ Coffee is balancing near 316.60, boxed between a well-defined floor and ceiling with no clear control. The market is rotating sideways as it waits for a catalyst.
▪️ Primary outlook is neutral — 325.00 is the fulcrum. The first clean break of the range sets the tone.
▪️ Key resistance zone: 325.00, defended 13 times. Above that sits 351.50, then 372.00.
▪️ Range floor: 306.50 — a weak level at 12 retests. Lose it and the balance breaks lower.
▪️ Primary downside targets on a break: 285.00, then 263.00, where liquidity pools.
▪️ Major liquidity magnet below: 285.00–263.00 — the zone that would pull price if the floor cracks.
▪️ Bullish scenario: A daily close back above 325.00 flips the tape and targets 351.50, then 372.00.
▪️ KEY LEVELS
▪️ Current Price: 316.60
RESISTANCEs
▪️ 372.00 — ★ 4.5 Weak · 36 retests
▪️ 351.50 — ★★★ 7.8 Strong · 27 retests
▪️ 325.00 — ★ 3.4 Weak · 13 retests
SUPPORTs
▪️ 306.50 — ★ 5.1 Weak · 12 retests
▪️ 285.00 — ★★★ 7.7 Strong · 17 retests
▪️ 263.00 — ★ 4.7 Weak · 5 retests
▪️ ProjectSyndicate Levels Desk — Overview of key S/R zones for Indices, Metals, Futures, NVDA, NQ, ES & GC traders every week. Subscribe to stay up to date with the latest levels.
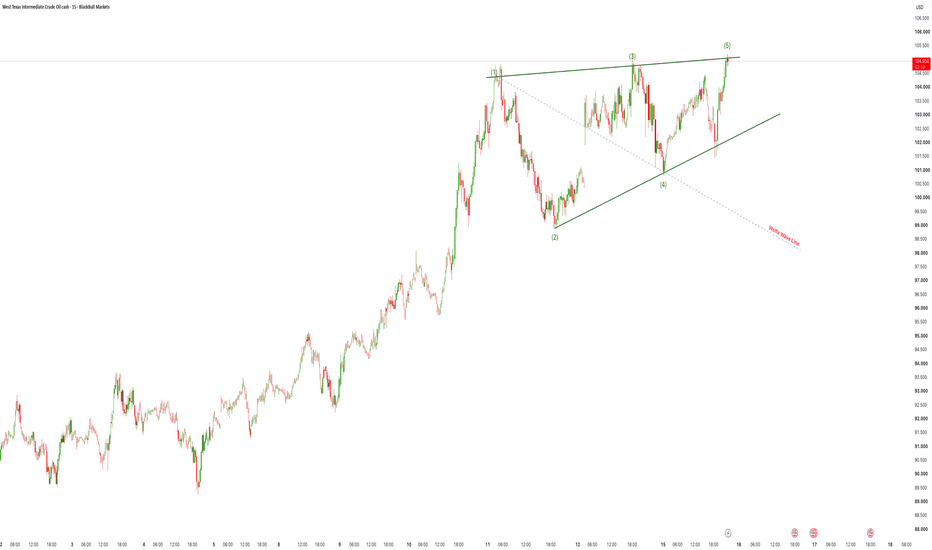
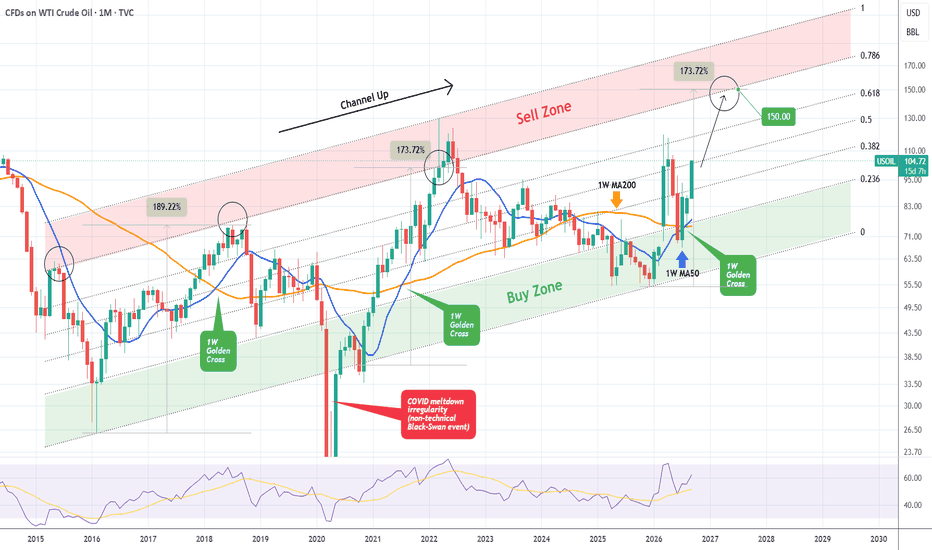
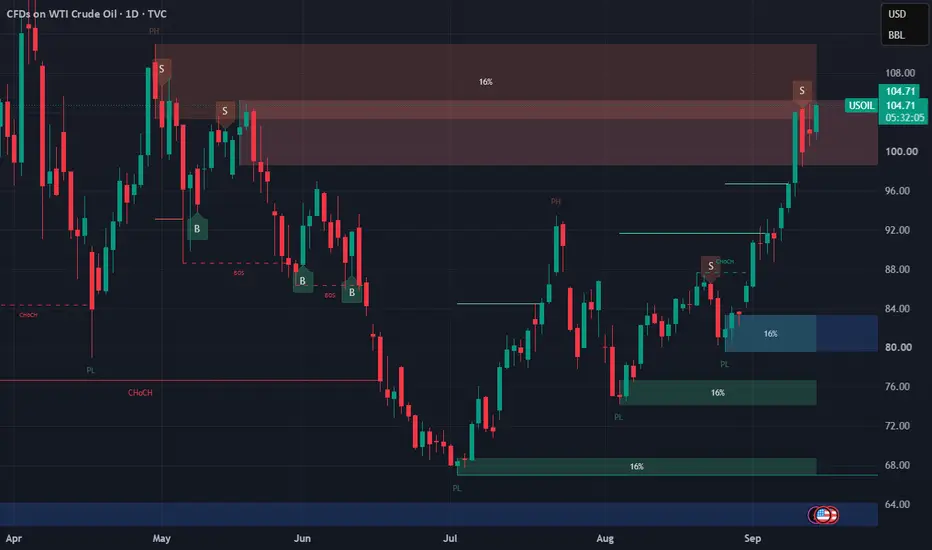
crude made cup& handle pattern updateas per chart cup&handle pattern breakout has done now some consolidation here some key lvl here---
crude spot eyes on 80.60$ stya above looks up side 81.60-83 than after 85$ soon support indicate 77$ if stya below than more down side expect 75-73$ soon .
mcx crude oil eys on 7840 if sustain above than 7930--8000 than after 8200--8500 soon. support find 550 sustain below or close below than will see next down era 73--7100++++