XAUUSD | BUY SETUP...
🥇 XAUUSD | BUY SETUP
📍 Buy Reaction Zone: 4,265–4,280
🎯 Target 1: 4,405
🎯 Target 2: 4,440–4,455
🟢 Support Zone: 4,250–4,270
🔴 Resistance Zone: 4,330–4,350
🔴 Major Resistance: 4,440–4,455
📊 Market Analysis:
Gold is currently trading around 4,330 and facing the marked resistance zone. The chart shows a broader descending trendline, so price may first pull back toward the 4,265–4,280 support area. If buyers defend this zone and produce a confirmed bullish reaction, the recovery can target 4,405 first, followed by the major resistance area around 4,440–4,455.
A clean break and acceptance above 4,350 would strengthen the upside move. However, a decisive breakdown below the 4,250–4,265 support would invalidate this bullish setup.
🛡️ Invalidation: Below 4,250
Bias: 🟢 BUY on confirmed support reaction  Long
Long
Short 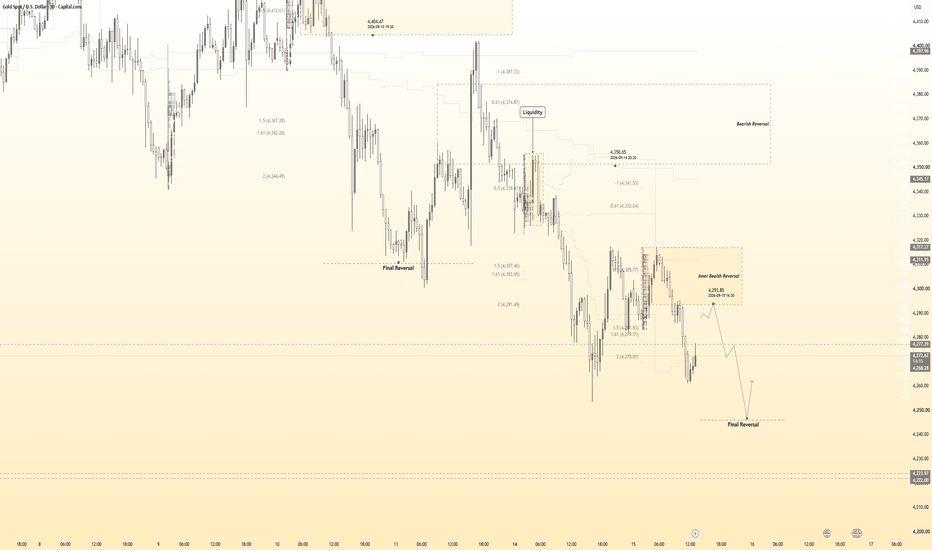
crudeoil breakout! will hit 10400-800 ya 9200?The structure is now clearly bullish, but RSI near 76 indicates short-term overbought conditions, so chasing the price at the current level can carry higher pullback risk
Key Technical Structure
Current Price: 9974
Immediate Resistance: 10050
Next Resistance: 10400
Major Resistance: 10800
Buy above 10,050 on sustained price action
sl: 9910
Target 1: 10200
Target 2: 10400--10800
bearish / rejection---
Avoid aggressive shorts while price remains above 9,840.
A bearish setup becomes stronger only if crude gives a daily close below 9,840.
Possible downside levels:
9,560- 9400 -9200+++
A rejection around 10,400 combined with bearish price action could produce a short-term correction, especially because RSI is already in the overbought zone.
over all summary --
The breakout is technically strong, but RSI ~76 means the market is stretched in the short term. Therefore, the higher-probability approach is to wait for either a confirmed breakout above 10,050 or a controlled pullback toward 9840, rather than chasing the current price GOLD US SESSION — 4300 HOLDS, BULLS STRIKE BACKGold has shown a strong recovery from the 4,285 support zone, reclaiming the 4,300 area with strong bullish momentum. However, price is now approaching the first resistance around 4,340, so the US session should focus on how price reacts at key zones rather than chasing the move.
📌 MAIN SCENARIO
The immediate key area is 4,317–4,340. If Gold holds above 4,317 after a pullback and buyers continue to defend this zone, the recovery can extend toward 4,399.
If price reaches 4,340 and shows a clear rejection, a short-term scalp back toward 4,317 → 4,285 can develop. Therefore, the preferred approach is to buy confirmed pullbacks while 4,285 remains protected, while remaining flexible around 4,340 resistance.
🔑 KEY LEVELS
🔴 4,443 — Major resistance / upper target
🔴 4,399 — Key resistance
🔴 4,340 — Immediate resistance / reaction zone
🟢 4,317 — Short-term support / pullback area
🟢 4,285 — Major support / bullish invalidation area
🟢 4,224 — Deeper support if 4,285 fails
🎯 PREFERRED SCENARIO
Gold has recovered strongly above 4,300.
Watch 4,317–4,340 for the first US-session setup.
If 4,317 holds after a pullback → look for Buy confirmation.
A successful break and hold above 4,340 opens the way toward 4,399.
If 4,340 rejects strongly → consider a short scalp toward 4,317 / 4,285.
A break below 4,285 would invalidate the immediate bullish recovery setup.
🟢 BIAS
BULLISH — BUY THE CONFIRMED PULLBACK.
The key shift is the strong recovery from 4,285 and reclaim of 4,300. For the US session, Emma's approach is simple: don't chase the impulse — wait for the pullback, confirmation, and reaction at the key zone. Long 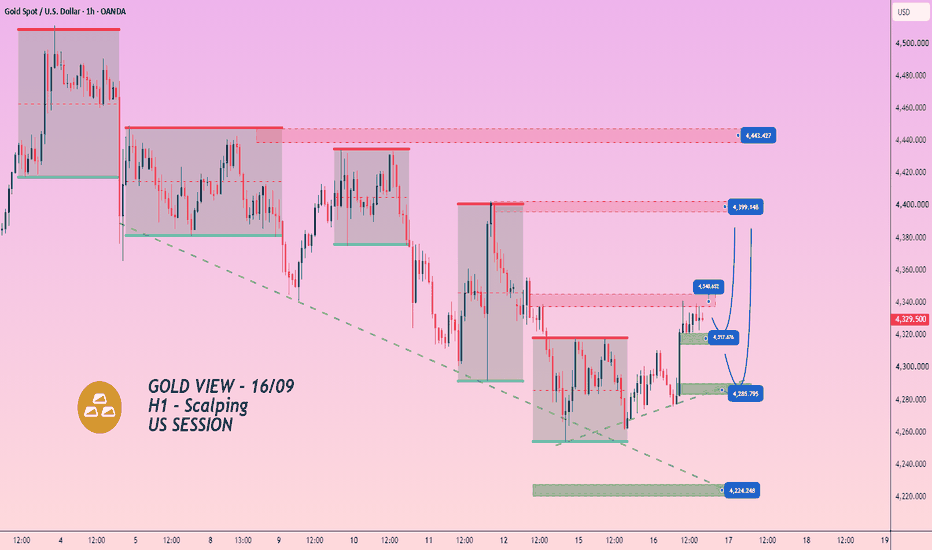
Long 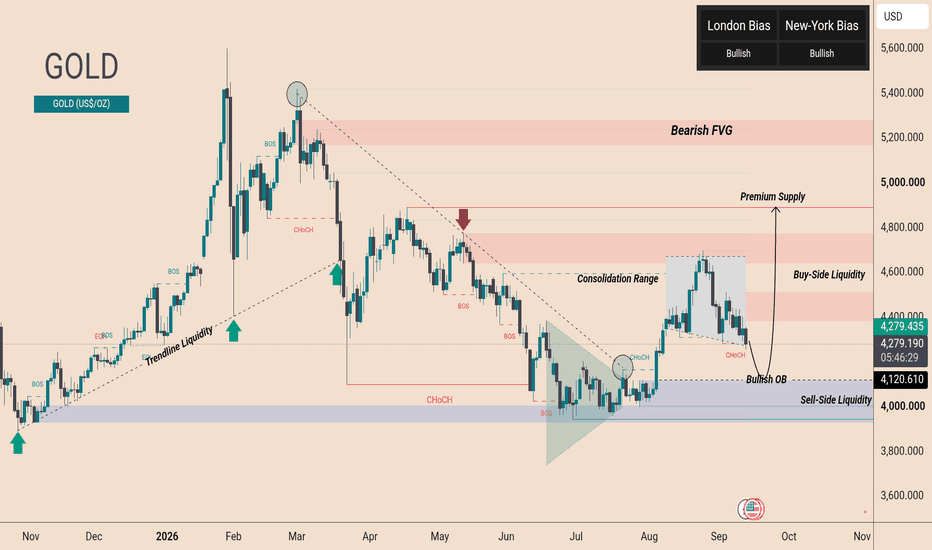
 Long
Long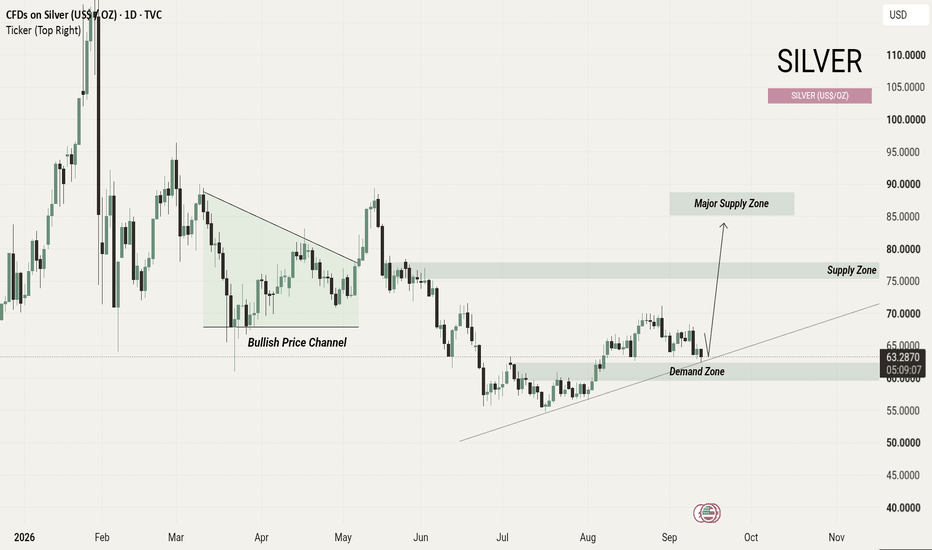
 Long
Long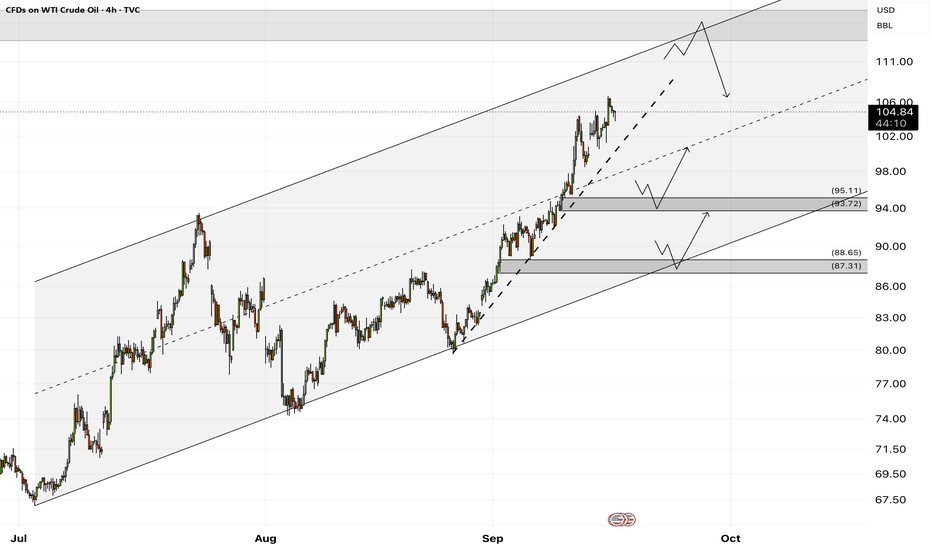
Long 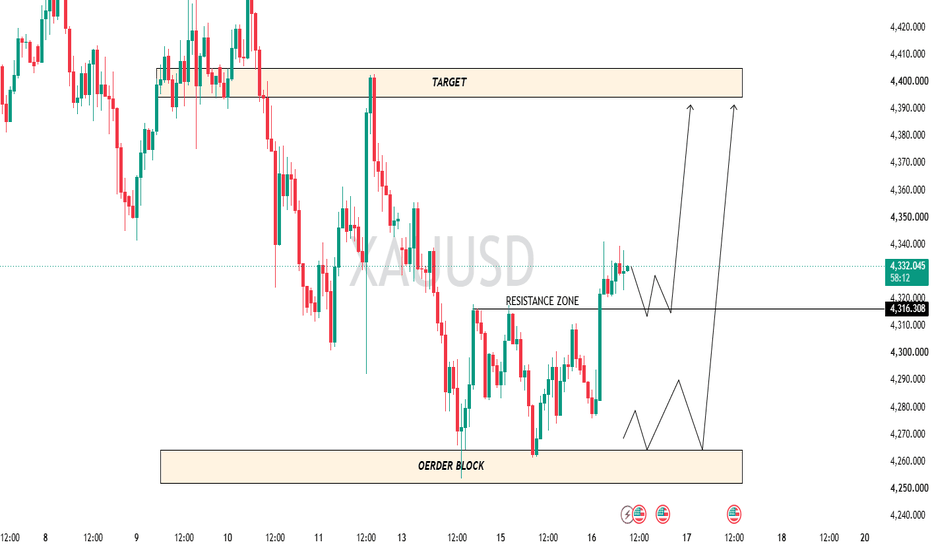
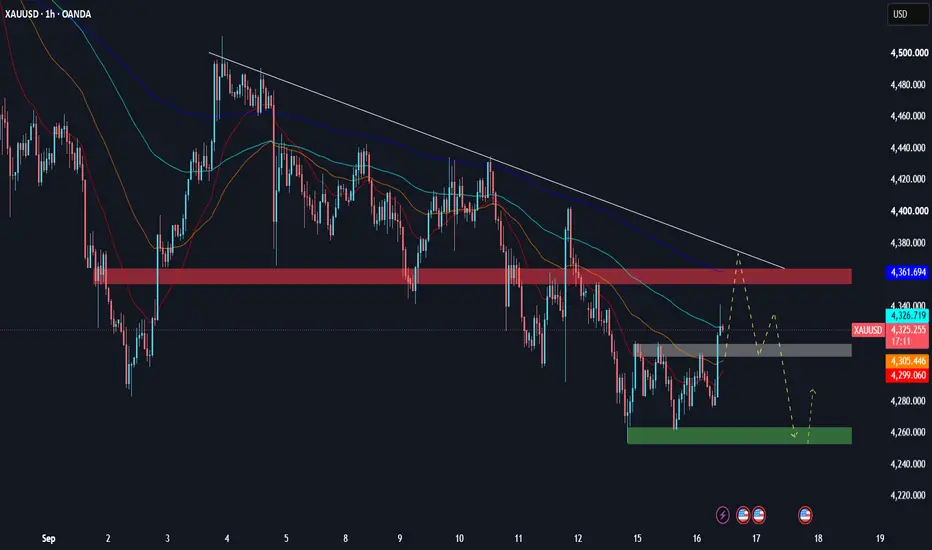
GOLD: Gold H1 Analysis – September 16📰 Fundamental News & Gold Price Action
Gold is recovering toward 4,328, but the market remains extremely cautious ahead of today’s FOMC meeting. Reuters reported that Gold was up around 0.8% as investors awaited the Fed’s decision, while the market is currently pricing in approximately a 92.4% probability of a 25 bps rate hike. The USD is also holding near multi-week highs amid expectations that the Fed will maintain a tighter monetary policy stance.
→ Therefore, the FOMC decision, and especially Powell’s remarks and the dot plot, will be the biggest catalysts of the day, potentially triggering significant volatility in XAUUSD.
📊 Key Resistance Levels & EMAs
🔴 SELL ZONE: 4,355 – 4,370
* This is an important supply zone on the chart.
* It is located near the long-term EMA around 4,362.
* The zone also sits below the descending trendline extending from the early-month high.
→ If price retraces into this zone and shows clear rejection, I would continue to prioritize SELL setups.
⚪ Zone: 4,315 – 4,305
* Price is currently trading around this area.
* It is located near the medium-term EMA around 4,306.
→ Since this zone is very close to the current price, the **risk-to-reward ratio (R:R)** is not particularly attractive. It is better suited for waiting for confirmation rather than chasing an entry.
🟢 BUY ZONE: 4,250 – 4,262
* This is a demand zone that has triggered multiple price reactions.
→ If Gold drops sharply into this area and forms a bullish rejection, a BUY setup could be considered.
→ If this zone is clearly broken, the bearish structure would be further reinforced.
📌 Summary
The H1 structure remains bearish, with 4,355–4,370 acting as a key SELL zone. The 4,315–4,305 area is too close to the current price, so the R:R is not particularly attractive. If Gold continues to decline, 4,250–4,262 will be an important BUY zone to watch.
👉 Key Levels: 4,365 / 4,350 / 4,325 / 4,300 / 4,260
Bias: 🔴 Bearish – prioritize SELL on rallies, but remain especially cautious ahead of the FOMC.
XAUUSD | Support & Resistance SetupGold is currently approaching a key support zone around 4,260–4,275.
If this zone holds and price shows bullish confirmation, the next area of interest is 4,340–4,360 resistance.
A clear rejection from resistance could bring bearish pressure back into the market.
A sustained breakout above 4,360 may strengthen the bullish scenario, while a break below 4,260 could indicate further downside.
Key levels:
Support: 4,260–4,275
Resistance: 4,340–4,360
This is a technical market analysis based on price structure and key levels, not financial advice. Long 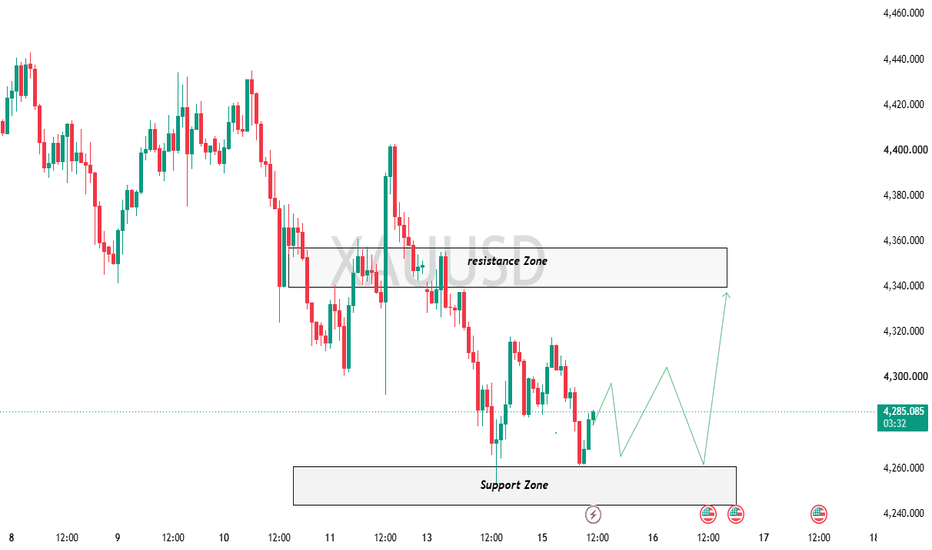
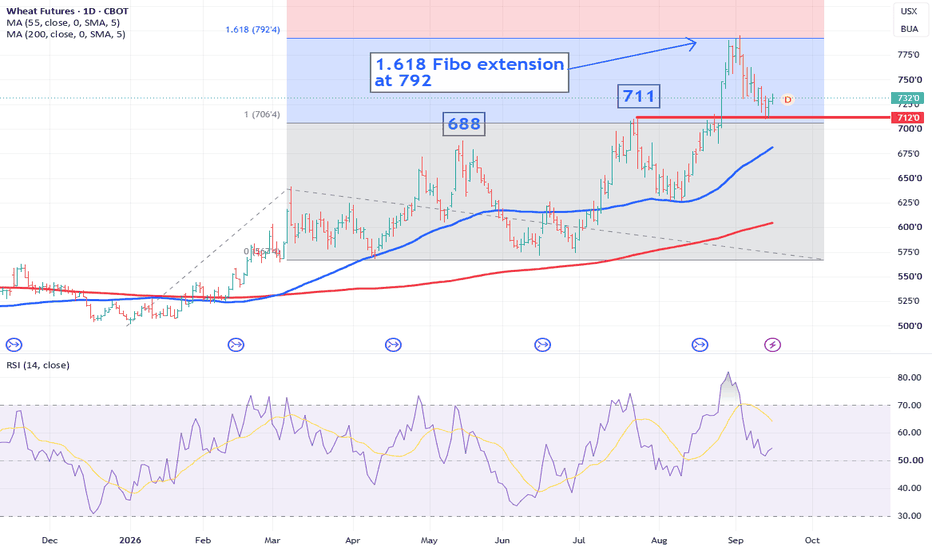
CBOT Wheat — Pullback Holds Support, Next Leg Higher in FocusWheat continues to behave beautifully from a technical standpoint.
We recently saw price fail almost exactly at the Fibonacci extension at 792. Since then, the pullback has retraced straight back to the first level of support at 711 — the July 2026 high — and that prior resistance is now acting as support. That's about as clean as technical structure gets.
This looks like the correction lower we were anticipating. A deeper pullback toward 688 (the May 2026 high) can't be ruled out, but as things stand, wheat looks well placed for another leg higher.
Key levels to watch:
Support: 711 (prior resistance, now support) / 688 (deeper support, May '26 high)
Upside target 1: 792–795 (recent high)
Upside target 2 (monthly): 825 — 38.2% retracement of the 2022–2025 decline
Long-term target: 928 — 50% retracement, reinforced by proximity to the 2011 (916) and 2012 (947) highs
Wheat is a cyclical market, and this looks like a structural bottom longer-term, with further upside potential. Definitely one to have on the radar.
Disclaimer:
The information posted on Trading View is for informative purposes and is not intended to constitute advice in any form, including but not limited to investment, accounting, tax, legal or regulatory advice. The information therefore has no regard to the specific investment objectives, financial situation or particular needs of any specific recipient. Opinions expressed are our current opinions as of the date appearing on Trading View only. All illustrations, forecasts or hypothetical data are for illustrative purposes only. The Society of Technical Analysts Ltd does not make representation that the information provided is appropriate for use in all jurisdictions or by all Investors or other potential Investors. Parties are therefore responsible for compliance with applicable local laws and regulations. The Society of Technical Analysts will not be held liable for any loss or damage resulting directly or indirectly from the use of any information on this site.
 Long
Long
 Short
Short
Short 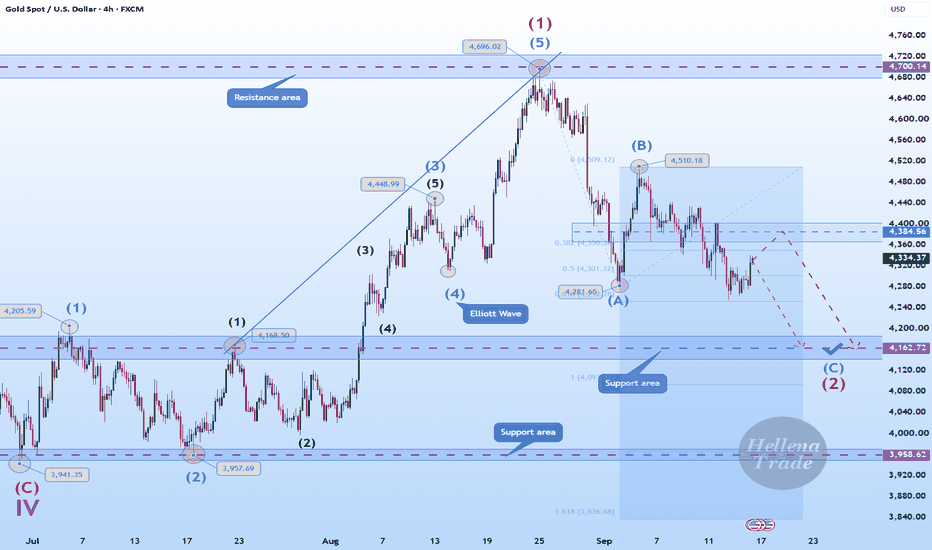
XAUUSD: Fed Day Puts 4,300 Support in FocusGold is attempting to stabilize after the recent selloff, but the broader short-term structure remains fragile ahead of today's Federal Reserve decision.
Spot XAUUSD has recovered into the 4,320-4,330 area after testing a one-month low earlier this week. The rebound is constructive, but it has not yet produced a decisive change in the recent bearish structure.
KEY LEVELS
Resistance: 4,350-4,370
Major resistance: 4,400
Immediate support: 4,300
Lower support: 4,260-4,280
BEARISH SCENARIO
As long as Gold remains below 4,350-4,370, sellers still have an opportunity to regain control. A clean break and acceptance below 4,300 would expose the 4,260-4,280 region. Losing that area would strengthen the case for a deeper correction.
BULLISH SCENARIO
If buyers defend 4,300 and price establishes itself above 4,350-4,370, the recovery could extend toward 4,400. A sustained reclaim above 4,400 would be a much stronger indication that the recent bearish momentum is weakening.
MACRO CONTEXT
Today's Federal Reserve decision is the main catalyst. Markets are pricing a very high probability of at least a 25 basis point rate increase. A hawkish decision or guidance could support Treasury yields and the US dollar, creating additional pressure on non-yielding Gold. Softer-than-expected guidance could instead trigger a stronger Gold recovery.
Middle East tensions remain an opposing force. Recent disruptions to Saudi oil infrastructure and shipping routes are keeping geopolitical and energy-supply risk elevated. That can support safe-haven demand for Gold, while high oil prices simultaneously increase inflation concerns and pressure bond yields higher.
DIRECTIONAL BIAS
Neutral to bearish below 4,350-4,370, with 4,300 as the key near-term pivot.
Below 4,300: focus shifts toward 4,260-4,280.
Above 4,370: recovery toward 4,400 becomes more likely.
With the Fed decision approaching, confirmation after the announcement is more important than anticipating the first move. Initial volatility can produce false breaks in both directions.
 Long
Long
Short 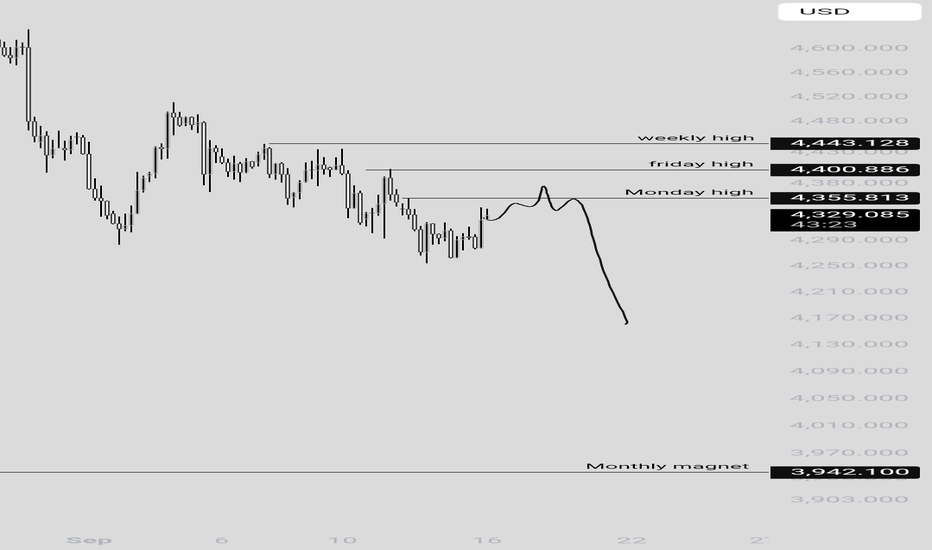
Short 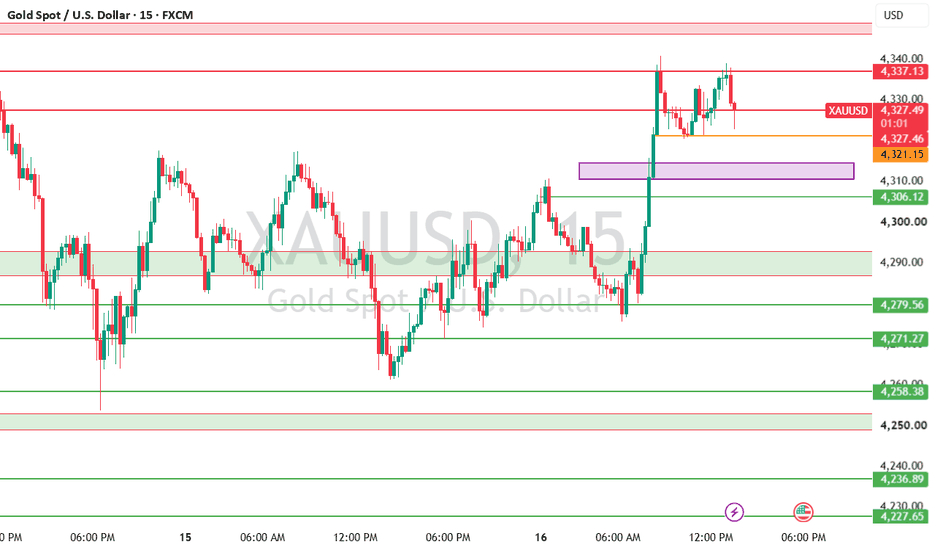
Long 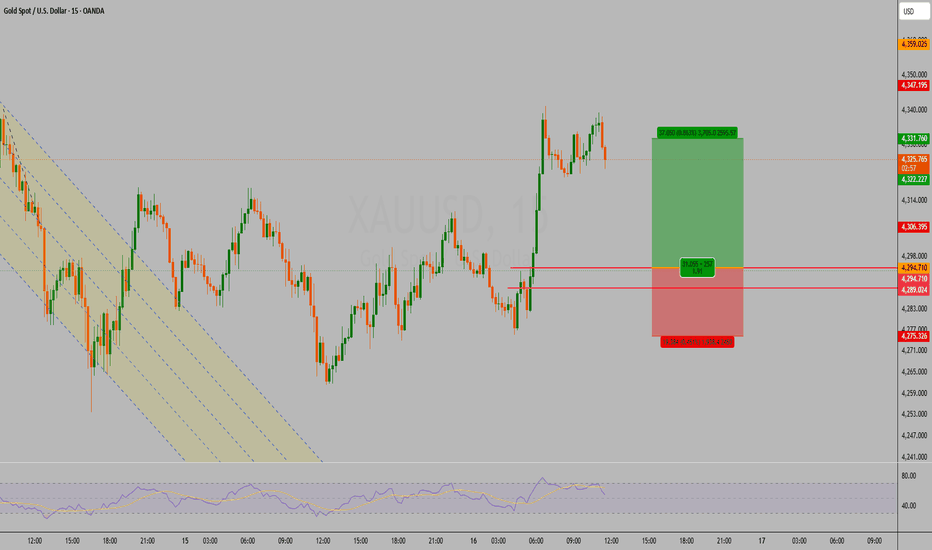
Long