MESZ Sep 18: Can 7680 Hold for a Bounce Toward 7738?MESZ is trading around 7,700 after a sharp short-term sell-off.
The first downside liquidity and reaction level I’m watching is around 7,680. Price could test that area before deciding on the next directional move.
If buyers defend 7,680, the first upside liquidity target sits around 7,738.
The more important downside level is 7,656. A confirmed 1-hour or 4-hour close below that area would invalidate my short-term bullish setup and shift the structure bearish.
Key levels
7,680 — first pullback / reaction level
7,738 — upside liquidity target
7,656 — bullish invalidation
Bullish scenario: Hold 7,680–7,656 → watch for continuation toward 7,738.
Bearish scenario: Lose 7,656 with confirmation → stop looking for the bullish bounce and respect further downside.
Not financial advice. No confirmation, no trade. CME_MINI:MESZ2026  Long
Long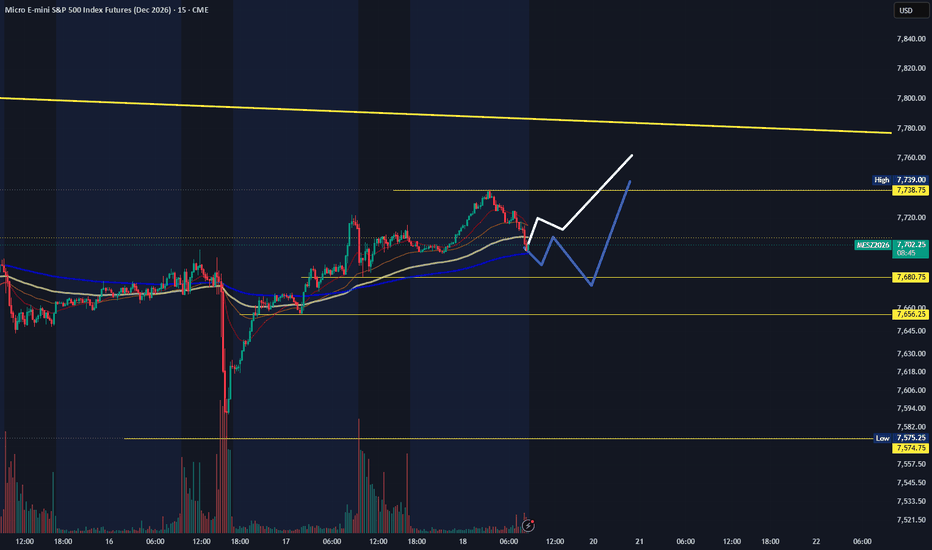
 Short
Short
 Short
Short
GOLD: Gold H1 Analysis – September 18📰 Gold Market News & Developments
Gold is staging a strong recovery following the sharp drop during the FOMC session. The Fed raised interest rates by 25 bps to the 3.75%–4.00% range and maintained a relatively hawkish stance, exerting pressure on Gold. However, on September 17, the USD and Treasury yields cooled off, and oil prices fell; this helped XAU/USD surge over 2% and return to the 4,350–4,360 range.
Currently, the market is in a tug-of-war: falling yields and a weaker USD are supporting Gold, while the Fed's hawkish outlook is capping the upside momentum.
📊 H1 Timeframe Analysis
After a sharp decline to the 4,240–4,260 zone, Gold has formed a series of higher lows and climbed back above 4,300.
However, the price has not yet broken through the 4,375–4,385 level, so a full bullish reversal cannot yet be confirmed.
→ Here are some trading zones to consider:
🔴 SELL zone: 4,370–4,385
- This is the immediate resistance zone where the price has reacted multiple times.
→ If the price reaches this zone but fails to break out, a correction may occur. We can look to Sell in this area if such a correction develops.
- Above this lies the 4,430–4,445 range, representing a stronger SELL zone on the chart.
🟢 BUY zone: 4,310–4,300
A key demand zone situated near the longer-term EMA.
→ If the price pulls back to this level and shows a bullish reaction, it becomes a notable area for BUY positions.
🟢 Lower BUY zone: 4,265–4,255
This is a stronger support zone that previously served as a bottom from which the price staged a significant rebound.
📈 EMA:
The price is currently trading above the cluster of short- and medium-term EMAs, indicating improved H1 momentum.
The EMAs around the 4,330–4,350 level are currently acting as dynamic support.
If XAUUSD holds above this EMA cluster, the recovery structure remains intact. XAUUSD GOLD — Limited-Time Sale? $4,110 in SightGOLD — Limited-Time Sale? $4,110 in Sight
Price TA:
Gold is bouncing, but the Daily correction still looks unfinished.
$4,440 is the key PONR;
below it, the path remains
$4,350 → $4,230 → $4,110. Around $4,110, reassess for the next bounce.
The important part is the route and the reaction points along the way — not expecting price to move in one straight line.
As price changes, the map adapts to the evidence. Check the updates for any changes to the route.
No narrative needed. No crystal ball — just the map. 😁
I’m not trying to predict the unknown.
I’m trying to chart it.
I’m trying to be a Chart Navigator.
---Cay7mon
Likes and comments are always welcome 😄
About this map:
This forecast map isn’t trying to predict the exact dollar. It maps the probable direction, route and reaction points so there’s a game plan ahead of time. Short 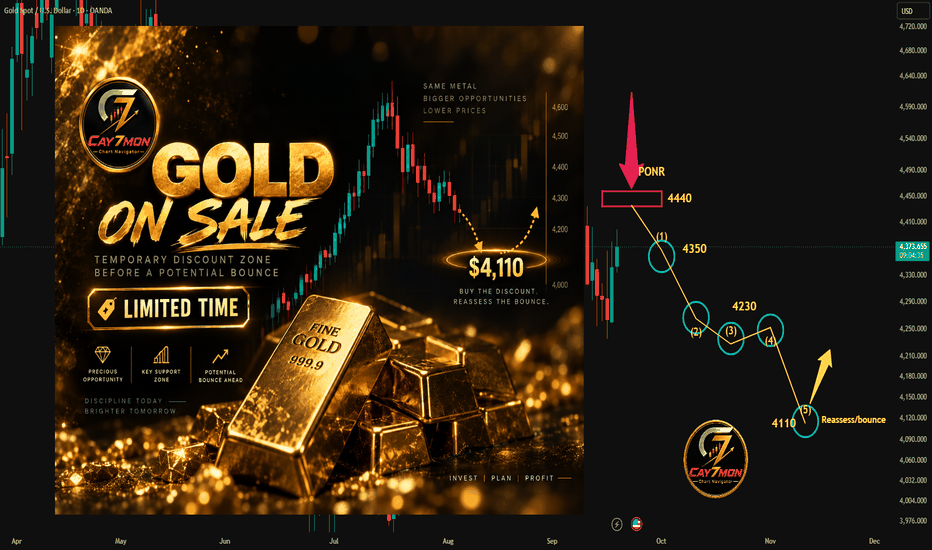
XAUUSD Bullish Recovery | Resistance Test (30M)
Gold is showing a recovery from the lower boundary of the descending channel and has reacted strongly from the key support area. Price is now attempting to stabilize above the recent low, while the descending trendline remains the main resistance to overcome.
🟦 First Support Objective: 4,280–4,290
🟦 Key Support Objective: 4,250–4,260
🟢 First Upside Objective: 4,340
🔵 Resistance Objective: 4,400–4,420
📈 Bias: Bullish recovery, but confirmation is still needed.
A sustained recovery above the 4,340 area could strengthen the bullish move and bring the 4,400–4,420 resistance zone into focus. If price fails to hold the current support and breaks below the recent low, the lower channel support around 4,250–4,260 becomes important. Long 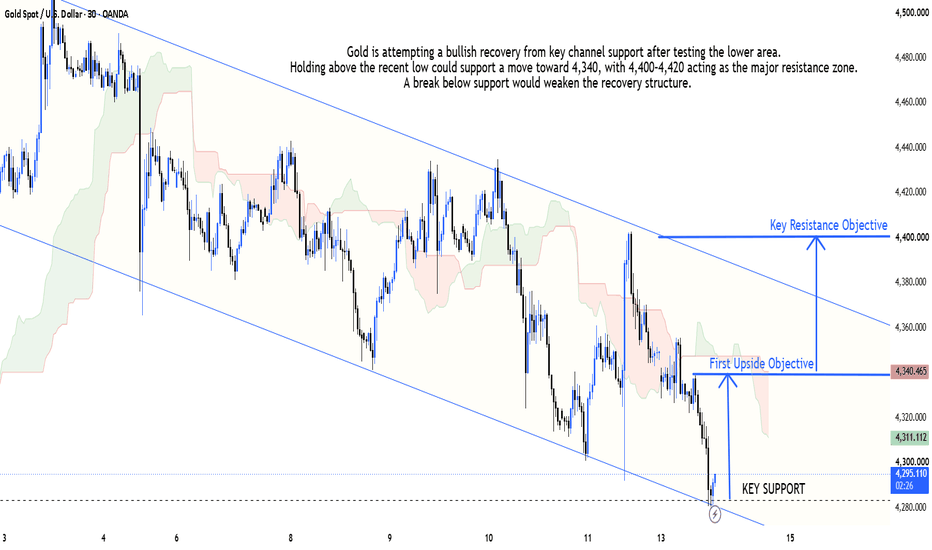
XAUUSD: Gold Is Climbing a Ladder. 4,380 Is the Missing StepGold has already done the difficult part.
It survived the violent move toward 4,235–4,260, rebuilt from the bottom and pushed back into the 4,350s.
But I would not call this a completed bullish reversal yet.
Look at today's H1 chart differently.
Forget the candles for a moment.
Gold is climbing a ladder.
4,305 → 4,320 → 4,333 → 4,350 → 4,380
The first four steps have already attracted buyers.
The last one has not been taken.
And that final step may decide whether Gold simply continues recovering — or makes a serious attempt at 4,415–4,435.
🪜 THE LADDER IS TELLING US WHERE BUYERS ARE HIDING
The recovery from approximately 4,260 has been surprisingly organized.
Instead of one vertical spike followed by an immediate collapse, Gold has created higher reactions while respecting several Fibonacci retracement levels.
The important ones on my chart are approximately:
4,305
4,320
4,333
4,350
Price has now returned above 4,350 after pulling back into the lower part of this ladder.
That matters.
The recent CHOCH around 4,365–4,370 also tells us that the market has already challenged the previous short-term bearish sequence.
But CHOCH alone is not enough for me.
There is still unfinished business above.
4,380 is the missing step.
🚪 4,380 IS NOT MY TARGET. IT IS MY PERMISSION LEVEL.
This distinction is important.
If Gold reaches 4,380 and immediately gets rejected, buyers have climbed the ladder but failed at the door.
I do not want to chase that.
What I want is an H1 candle closing above 4,380, followed by price holding the 4,370–4,380 area on a retest.
That would give me the cleaner continuation trade.
Breakout BUY Entry: 4,372–4,380 after H1 close above 4,380 + retest
Stop Loss: 4,350
TP1: 4,400
TP2: 4,415
TP3: 4,430–4,435
Why does TP3 matter?
Because the large zone around 4,415–4,435 is where the chart places the next major supply/target area.
If 4,380 becomes support, that zone stops looking distant.
It becomes the next destination.
🟢 BUT I DO NOT NEED 4,380 TO BUY
There is another trade I actually like more if Gold gives it to us.
A pullback.
Current price is sitting around the 4,350s, and underneath it we have a cluster around 4,330–4,350.
That is where I want to see whether today's buyers are real.
If Gold pulls back into 4,335–4,350, refuses to close below 4,330 and then reclaims 4,350, I would treat it as a continuation dip rather than the beginning of another sell-off.
Pullback BUY Entry: 4,340–4,350 after bullish H1 rejection
Stop Loss: 4,325
TP1: 4,370
TP2: 4,380
TP3: 4,415
This trade has one very simple condition:
4,330 must survive.
I do not want to buy a falling candle simply because Fibonacci says support is nearby.
Let the candle prove the level first.
🟥 NOW TURN THE LADDER UPSIDE DOWN
Here is where the chart becomes interesting.
The same levels helping buyers can become evidence against them.
Suppose Gold cannot break 4,380.
Price falls through 4,350.
Then 4,333 disappears too.
At that point, I am no longer looking at a healthy bullish pullback.
The ladder is breaking from the top down.
For me, an H1 close below 4,330 is the warning that today's bullish continuation idea has failed.
I would then wait for Gold to come back toward 4,330–4,340.
If that retest fails, I want the short.
SELL Entry: 4,330–4,340 after H1 breakdown + failed retest
Stop Loss: 4,355
TP1: 4,305
TP2: 4,282
TP3: 4,260
That last target is important.
4,260 is where this entire recovery began.
If price returns there after losing 4,330, buyers will have surrendered a large part of their progress.
🪤 THERE IS ONE TRADE I WILL NOT TAKE
Gold spikes to 4,375–4,380.
Everyone sees the breakout coming.
Then the H1 candle closes back below 4,365.
That is not my signal to BUY harder.
That is a potential trap.
If this happens, I would consider a rejection short:
Rejection SELL Entry: 4,365–4,375
Stop Loss: 4,388
TP1: 4,350
TP2: 4,333
TP3: 4,305
But this setup disappears immediately if Gold gets an H1 close above 4,380 and successfully holds the level.
I do not want to short strength after resistance has already become support.
🗺️ IF THE CHART LOOKS COMPLICATED, USE THIS MAP
You can ignore most of the drawings and remember just three numbers:
4,330 — the safety net.
Above it, the recovery remains healthy.
4,380 — the locked door.
Break and hold it, and buyers earn access to the upper target.
4,415–4,435 — the destination.
This is where I expect the next serious test if bullish continuation succeeds.
So today's market does not require a prediction.
It requires Gold to complete the ladder.
Hold 4,330 → reclaim 4,380 → 4,415–4,435 becomes available.
Or:
Lose 4,330 → fail the retest → 4,305, 4,282 and potentially 4,260 return to the map.
Right now, buyers have done enough to deserve attention.
They have not done enough to deserve blind trust.
The question for today: does Gold finally unlock 4,380 — or is the last step exactly where the ladder breaks? Long 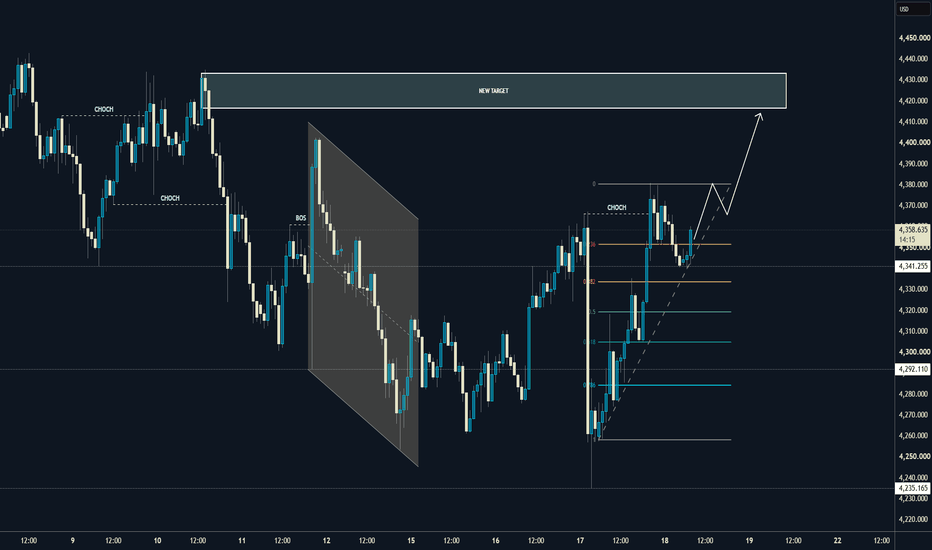
XAUUSD — DAILY SUPPORT TEST | LONG SETUPGold is now testing a major Daily support zone around 4,295, after pulling back from the recent highs above 4,600.
This is a much cleaner higher-timeframe setup than trying to trade every small intraday move.
Trade Setup
BUY: 4,295.075
SL: 4,221.032
TP: 4,439.586
Risk/Reward: ≈ 1:1.95
Why this level matters
🔹 Daily support zone: Price is sitting directly on a previously established support area.
🔹 Trendline confluence: The rising trendline from the August advance meets the current price structure.
🔹 Pullback: Gold has retraced significantly from the 4,600–4,700 region and is now reaching an important demand area.
🔹 Resistance above: The 4,439–4,500 region could become the next major upside objective if buyers regain control.
Confirmation I'm watching
Daily support holds → bullish rejection → buyers reclaim 4,295 → continuation toward 4,440.
A strong Daily close below the support zone would weaken the bullish thesis, while a break below 4,221 invalidates this setup.
📌 The Daily chart gives the bigger picture. Lower timeframes can then be used to refine the entry rather than letting short-term noise dictate the entire trade.
⚠️ Technical analysis only, not financial advice. Manage risk and position size appropriately.
Will Gold defend this Daily support and start the next leg toward 4,440? Long 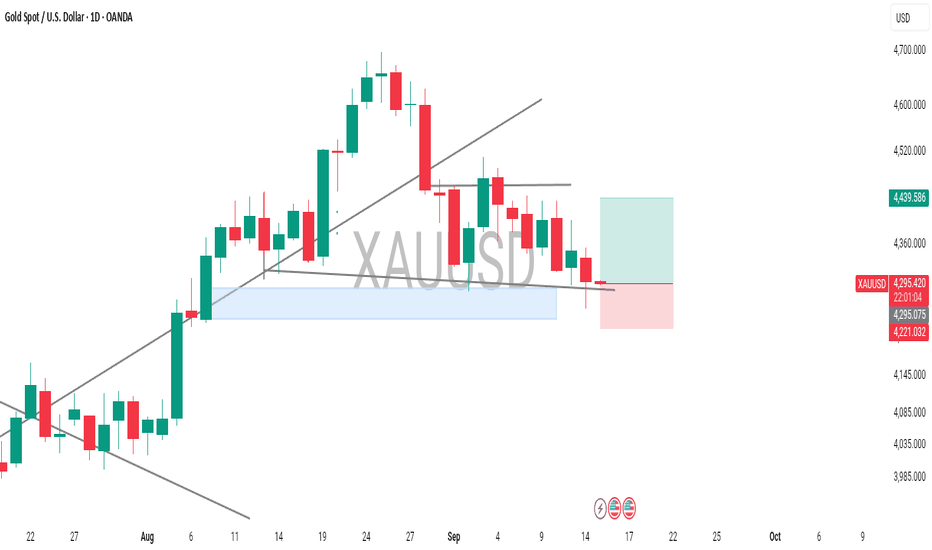
Bullish Recovery Toward Major Resistance
Fundamental Analysis
Gold is recovering after the Fed raised rates 25 bp to 3.75%–4.00%. A softer U.S. dollar and easing oil prices are supporting the rebound, although the Fed’s signal that further hikes may still come keeps the broader macro backdrop cautious for Gold.
Technical Analysis
On H1, Gold has recovered strongly from the 4,250–4,260 support area and pushed through the 4,350–4,360 OB Sell Zone.
Price is now near 4,373, showing improving bullish momentum. A short pullback toward the 4,305–4,328 FVG High Zone may provide a cleaner continuation area if buyers remain in control.
The main upside objective is the 4,390–4,405 Major Resistance / BSL.
Important Key Levels
4,390–4,405 — Major Resistance / BSL
4,350–4,360 — OB Sell Zone
4,305–4,328 — FVG High Zone
4,235–4,245 — OB Buy Zone + Support
Trading Scenario
Buy priority remains on a controlled pullback followed by bullish H1 confirmation.
Target: 4,390–4,405 BSL.
Invalidation: H1 acceptance below the FVG High Zone.
Overall View
Short-term momentum has shifted bullish, but chasing the current expansion is less attractive. A pullback into support could offer a cleaner continuation setup toward upper liquidity.
Will Gold retest the FVG first, or continue directly toward 4,400? Long 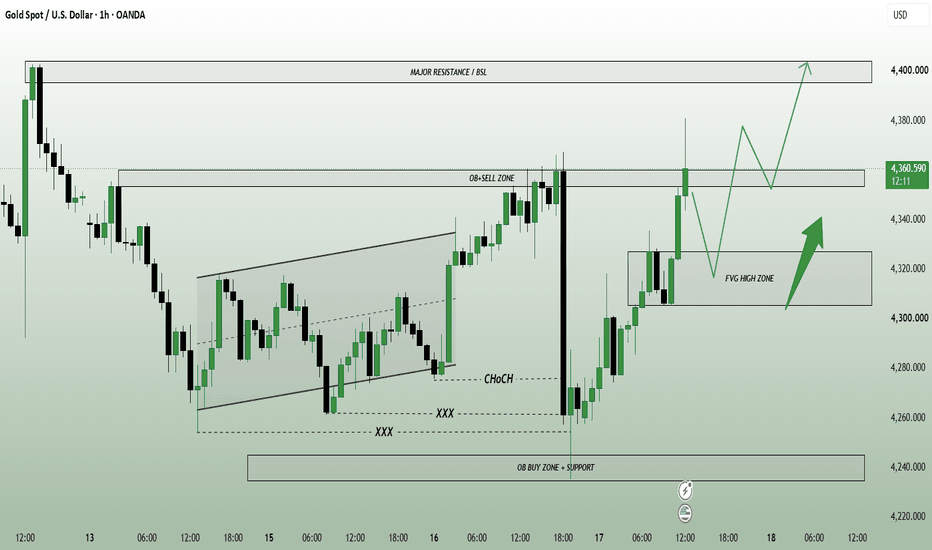
XAUUSD — 4H BULLISH CONTINUATION SETUP Gold is showing a bullish 4H structure after recovering from the marked demand zone. Price is now around 4,386, approaching the 4,400 resistance area.
The bigger picture shows price trading inside a broad structure, with the rising trendline supporting the recent recovery.
📌 Trade Idea — LONG
Entry: 4,399.773
Stop Loss: 4,219.139
Take Profit: 4,644.927
Risk/Reward: ≈ 1:1.36
🔎 Why I'm Watching This Setup
🔹 4H demand zone: Price previously reacted strongly from the blue demand area around 4,345–4,365.
🔹 Rising trendline: The ascending trendline continues to provide structural support beneath price.
🔹 Bullish recovery: Gold has moved upward from the demand zone and is now challenging the 4,400 region.
🔹 Breakout potential: A clean break and hold above 4,400 could open the way toward the higher resistance area.
🔹 Major upside target: 4,645 sits near the upper boundary of the broader structure.
🎯 Confirmation I'm Watching
Demand holds → bullish structure → break above 4,400 → retest → continuation toward 4,645.
If Gold fails to break 4,400 and falls back through the rising trendline, the setup needs to be reassessed.
Key Levels
🟢 Entry: 4,399.773
🎯 TP: 4,644.927
🔴 SL: 4,219.139
📍 Demand: ~4,345–4,365
📍 Resistance: ~4,400
The 4H chart gives a much clearer view of the larger move: instead of reacting to every small candle, we're watching how Gold behaves around major structure.
⚠️ Technical analysis only, not financial advice. Manage risk and position size carefully.
XAUUSD is approaching 4,400. Will this become the breakout that sends Gold toward 4,645? Long 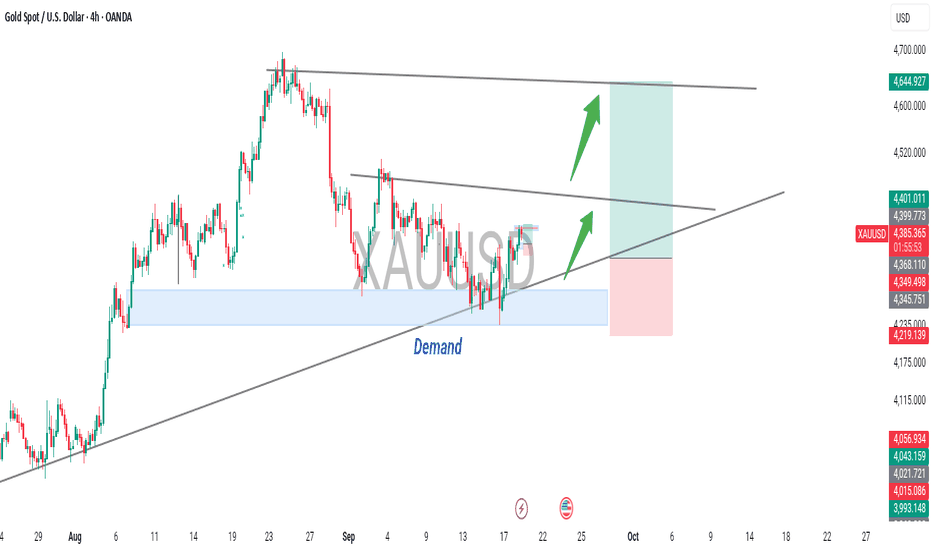
Gold Post-FOMC: Break 4,320 or Sweep 4,260?• Macro Driver: Spot Gold hovers near $4,313 on Wednesday, September 16, 2026, as global markets brace for today's pivotal FOMC Interest Rate Decision and the release of the updated Summary of Economic Projections (SEP / Dot Plot). While policy rates are widely projected to remain steady at 3.50%–3.75%, institutional desks are hyper-focused on Fed Chair Kevin Warsh's forward guidance regarding persistent underlying inflation and balance sheet velocity.
• Market Condition: Institutional order flow reflects a classic pre-FOMC volatility compression. After absorbing sell-side liquidity at the 4,260 Demand Zone, smart money is coiling price within a tight range between the 4,260 base and 4,320 Resistance Zone, preparing for an aggressive post-announcement directional expansion toward overhead channel resistance.
Technical Context
• Structure: Re-Accumulation within Bearish Descending Channel. On the 1H timeframe, Gold remains bound beneath the multi-week descending trendline from the 4,511.089 Strong High. Following multiple CHoCH and BOS downside sweeps, price printed a double-bottom absorption at the Demand Zone (4,260 – 4,275).
• Liquidity & Imbalance: Price delivery shows immediate rejection at the 4,310–4,320 Resistance Zone (current market price: 4,313.035). The technical roadmap anticipates a shallow corrective retest into the 4,260–4,275 Demand Zone to engineer final buy-side liquidity, followed by an impulsive breakout push piercing through 4,320 to target the Intermediate Supply Block (4,350 – 4,370) and test the descending channel ceiling.
Key Zones
• Macro Structural Ceiling (Strong High): 4,511.08
• Upper Supply Block: 4,420.00 – 4,435.00
• Intermediate Supply Target (Blue Box): 4,350.00 – 4,370.00
• Immediate Overhead Resistance Zone (Grey Box): 4,310.00 – 4,322.00
• Current Market Price: 4,313.03
• Structural Demand Zone Base (Grey Box): 4,260.00 – 4,275.00
Trading Plan (IF–THEN)
• IF price delivers a corrective liquidity tap into the 4,260 – 4,275 Demand Zone AND validates lower-timeframe (M5/M15) bullish displacement/CHoCH -> THEN look to execute Long positions targeting 4,315, expanding through 4,322 directly toward the 4,350.00 – 4,370.00 Intermediate Supply / trendline ceiling.
• IF price confirms a decisive 1H close below 4,250 during the FOMC rate release -> THEN the demand accumulation thesis is invalidated, unlocking a deeper sell-side flush toward 4,220.
MMFLOW View
• Bias: Pre-News Accumulation / Post-FOMC Bullish Expansion. Fading the range midpoint at 4,313 ahead of the Fed rate decision presents poor risk-to-reward; our mathematical edge favors buying verified liquidity defenses at the 4,260–4,275 demand floor to ride the expansion wave into descending channel resistance.
Are you positioning for a post-FOMC breakout toward 4,360, or expecting Kevin Warsh's press conference to push Gold below 4,260? Long 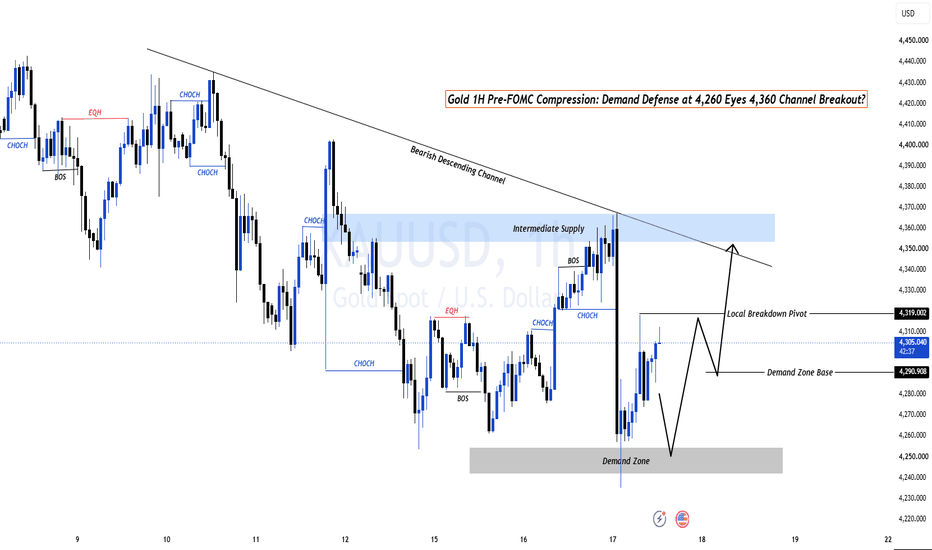
XAUUSD — 15M BEARISH REVERSAL SETUPGold has made a strong bullish move and is now testing a major supply/resistance zone around 4,390–4,401. Price has rejected the upper area and is currently pulling back.
The key level to watch is the 4,368 demand zone.
📌 Trade Setup — SHORT
Entry: 4,368.110
Stop Loss: 4,401.011
Take Profit: 4,349.498
R:R: ~1:0.57
🔎 Setup Breakdown
🔴 Supply zone: 4,390–4,401 is the major resistance area where price is currently struggling.
🔹 Rejection: Price pushed into the supply zone and failed to maintain the highs.
🔹 Demand: 4,368 is the immediate demand/support area. A break below this level could open the way toward the lower target.
🔹 Market structure: After the strong rally, Gold is showing short-term signs of exhaustion near resistance.
Confirmation
The cleaner bearish confirmation would be:
Supply rejection → break below 4,368 → retest → continuation lower.
If Gold reclaims 4,390–4,401 and holds above the supply zone, the bearish setup is invalidated.
⚠️ Risk/reward note: The chart's marked levels give less than 1:1 R:R, so this setup would require particularly strong confirmation or different risk/target placement to justify the trade.
Key levels:
🔴 Supply: 4,390–4,401
📍 Demand: 4,368
🎯 Target: 4,349
Gold is sitting between a major supply zone and nearby demand — the reaction around 4,368 should be important. Long 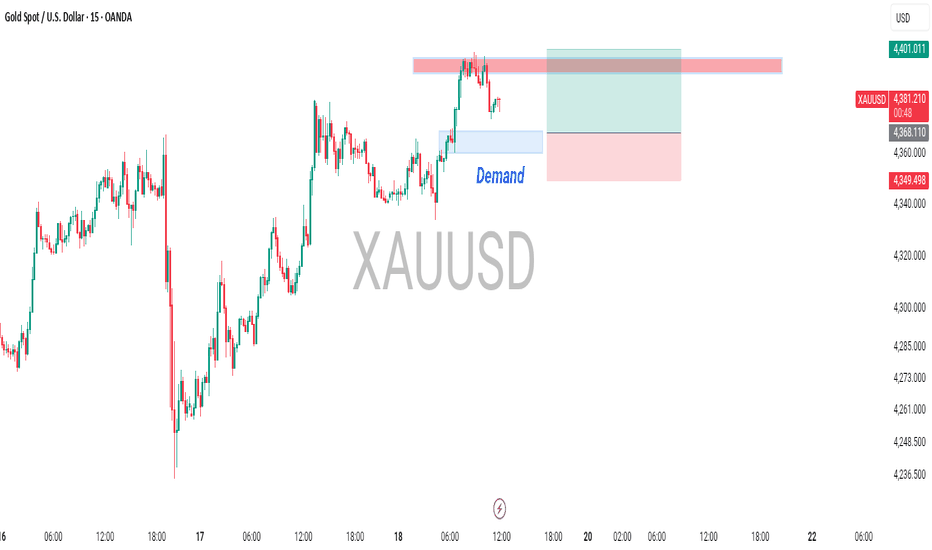
XAU/USD 2H — BULLISH LONG SETUP 🥇 XAU/USD 2H — BULLISH LONG SETUP 📈✨
🧭 Market Overview
Gold is currently trading around 4,284, sitting close to the major 4,225 support zone. The broader 2H structure is still bearish, but the current location is interesting for a potential counter-trend long if buyers defend support.
🟢 Long Scenario
The key area to watch is 4,225–4,250. This zone can act as a demand/liquidity area where buyers may step in.
Rather than entering immediately, the stronger setup would be:
Support sweep → bullish rejection → lower-timeframe CHoCH/BOS → LONG
📍 Entry Zone
4,225–4,250
A deeper liquidity sweep toward 4,200–4,225 can also be considered, but bullish confirmation is important.
🛑 Stop Loss
Below 4,200
A decisive break and acceptance below this level would invalidate the bullish idea.
🎯 Take Profit Targets
TP1: 4,320 🥇
TP2: 4,380 🥈
TP3: 4,400 🥉
Extended target: 4,450+ 🚀 if momentum becomes strong
🏦 Key Resistance / Order Block
The 4,320–4,380 region is an important order-block/resistance area. This is the first major zone where sellers could become active again.
Above 4,400, price would begin challenging the descending bearish trendline. A confirmed breakout and retest of that trendline could significantly strengthen the bullish reversal scenario.
🔥 Trade Management
If price reaches TP1, consider securing partial profit and moving SL toward breakeven. If price reaches TP2, protect the remaining position while watching the reaction around the order block.
⚠️ Invalidation
If Gold breaks 4,225 decisively and continues below 4,200, the long setup becomes invalid and bearish continuation toward lower levels becomes more likely.
📊 Bias: Bullish reaction from support
🟢 Preferred: LONG after confirmation
📍 Entry: 4,225–4,250
🛑 SL: < 4,200
🎯 TP: 4,320 → 4,380 → 4,400
Educational chart analysis only; wait for confirmation and manage risk before entering. Long 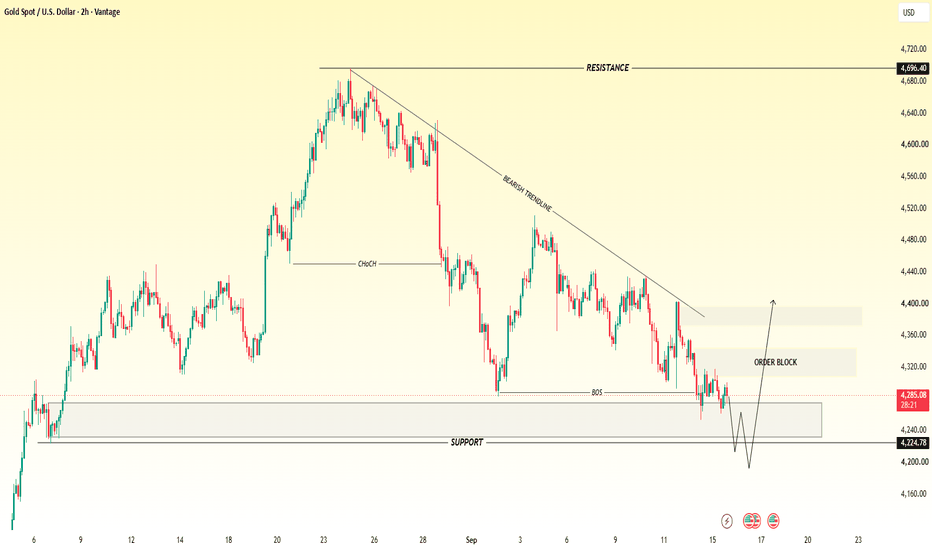
XAUUSD IDEAGold (XAUUSD) is currently undergoing a countertrend correction toward the 4,400–4,430 liquidity zone following the opening of the session. Despite the ongoing recovery, the broader market structure remains bearish, with the fundamental backdrop continuing to weigh on the precious metal.
The U.S. Dollar Index is consolidating after breaking above local resistance levels. A relatively hawkish Federal Reserve stance and elevated interest-rate expectations continue to provide underlying support for the dollar, maintaining medium-term pressure on gold and other precious metals.
At the same time, the recent correction in oil prices is providing some temporary relief for gold, allowing the metal to stabilize and retest key resistance areas. However, the upside remains constrained by the Fed's hawkish outlook, elevated yields, dollar strength, and ongoing geopolitical uncertainty.
Near-term price direction is likely to remain sensitive to the Bank of Japan's policy decision, U.S. economic data, movements in Treasury yields and the dollar, and developments in the Middle East.
Key Market Drivers
Upside catalysts
Further declines in crude oil prices
Lower U.S. Treasury yields
Softer-than-expected U.S. economic data
A more dovish BOJ outcome
De-escalation of geopolitical tensions
Downside catalysts
Escalation of tensions in the Middle East
A renewed rise in oil prices
A persistently hawkish Federal Reserve stance
Stronger U.S. dollar
Higher Treasury yields
Key Technical Levels
Resistance
4,402
4,435
4,495
Support
4,340
4,253
4,200
Technical Bias
Gold remains in a bearish broader structure while the current move represents a countertrend correction. The 4,400–4,435 resistance zone is therefore a critical area to monitor.
A temporary liquidity sweep or short squeeze above this zone could occur before sellers regain control. The key focus should be on price reaction and confirmation following any retest of the resistance area.
If a clear bearish reversal pattern develops after the retest, it could provide a technical setup for a move back toward the 4,340, 4,253, and potentially 4,200 support zones.
Conversely, a sustained breakout and acceptance above 4,435 would weaken the immediate bearish setup and shift attention toward the 4,495 resistance level.
Overall: Gold is attempting to stabilize, but the broader bearish structure remains intact unless price establishes sustained acceptance above the key resistance zone. Traders should focus on confirmation rather than anticipating the reversal, particularly around 4,400–4,435. Long 
Gold Continues to Recover, but 4,380 Remains Key Resistance📊 Market Overview:
XAU/USD is currently trading around 4,365 USD, continuing its strong recovery from the recent low near 4,235 USD.
The main drivers are a weaker USD and lower Treasury yields, while falling oil prices have partly eased inflation concerns. Reuters reported that gold rose more than 2% on September 17 and reached around 4,360 USD/oz, while the 10-year Treasury yield fell to around 4.94%.
However, it is worth noting that the Fed recently raised interest rates by 25 basis points to 3.75%–4.00%, while its policy signals remain relatively hawkish. 16 of 18 Fed officials expect at least one more rate hike in 2026, meaning gold could still face profit-taking pressure at higher levels.
📉 Technical Analysis:
Key Resistance:
- 4,375–4,385 USD
- 4,400–4,415 USD
Nearest Support:
- 4,345–4,335 USD
- 4,315–4,300 USD
EMA 09: Price is currently above the short-term EMA09, indicating that recovery momentum remains intact. However, after the strong rebound from 4,235 USD, the widening distance from EMA09 means a short-term correction remains possible.
Candlestick / Volume / Momentum: The short-term structure remains positive, with higher lows forming. The move back above 4,340–4,350 indicates improving buying pressure. However, 4,375–4,385 is a key area to monitor. If a rejection candle or strong bearish candle appears with rising selling volume, gold could correct toward the support zones below.
📌 Outlook:
Gold could continue rising in the short term if it holds above 4,345–4,350 USD and breaks through 4,375–4,385 USD. In that case, the 4,400–4,415 USD zone could become the next target.
On the other hand, if gold faces strong rejection at 4,375–4,385 and breaks below 4,335 USD, downside pressure could increase toward 4,315–4,300 USD.
💡 Suggested Trading Strategy:
🔻 SELL XAU/USD at: 4,382–4,385
🎯 TP: 40 / 80 / 200 / 300 pips
❌ SL: 4,390
🔺 BUY XAU/USD at: 4,338–4,335
🎯 TP: 40 / 80 / 200 / 300 pips
❌ SL: 4,330 Long 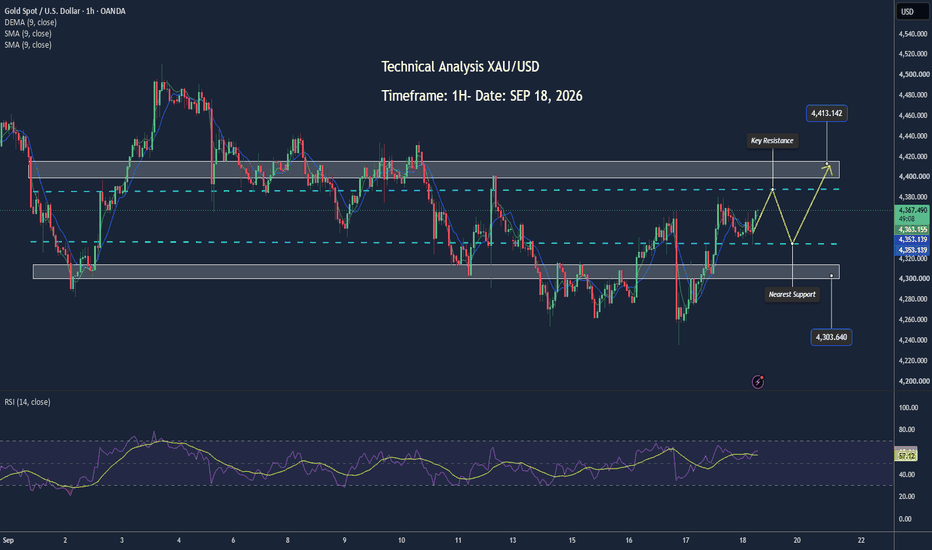
Short 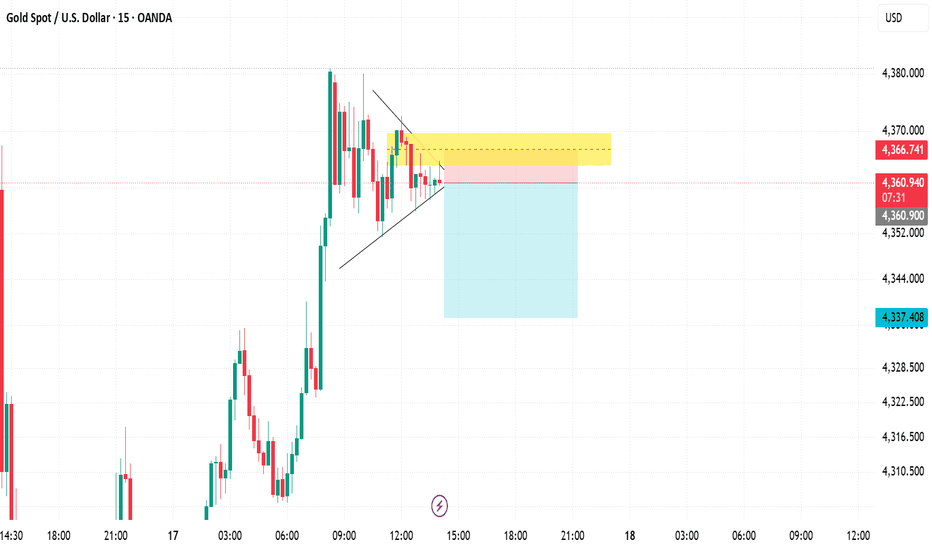
XAUUSD — MTF ANALYSIS 18/09/26🟠 XAUUSD — MTF ANALYSIS
━━━━━━━━━━━━━━
🧭 BULLISH · Medium
📊 H1: Bullish recovery · CONFIRMED > 4,360–4,375
⏱️ M15: Bullish continuation · CONFIRMED > 4,360–4,370
⚡ M5: Bearish correction · FORMING 4,384–4,388
🔴 R: 4,395–4,400 · 4,404–4,410
🟢 S: 4,384–4,388 · 4,375–4,380
🎯 Primary: Hold 4,384–4,388 + reclaim 4,392–4,396 → 4,395–4,400 → 4,404–4,410
🔄 Alternative: Lose 4,384 → 4,376–4,380 → 4,360–4,368
👀 Watch: break & hold outside 4,384–4,400 Long 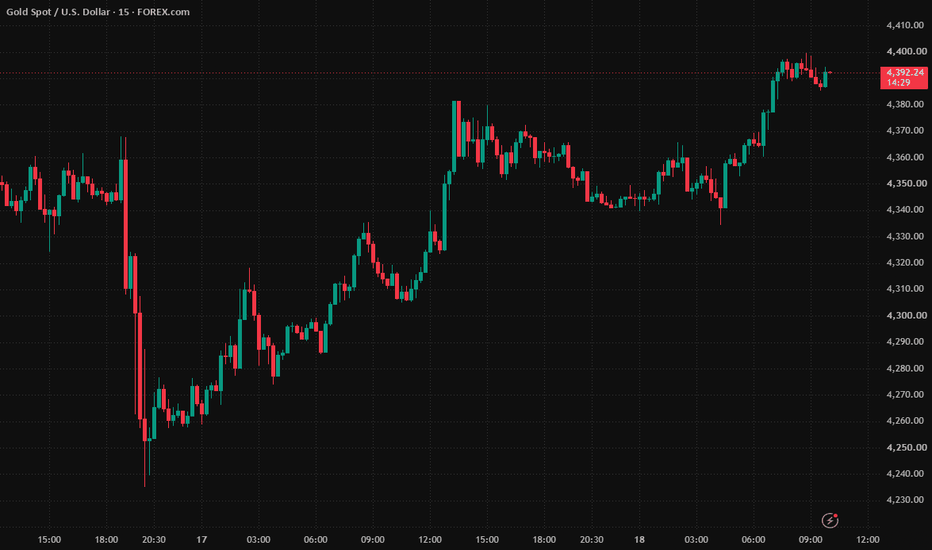
The Strategy Isn’t Failing — The Market Is Changing
One of the biggest mistakes traders make is assuming that a strategy has stopped working simply because it goes through a period of losses.
But there is a more important question to ask:
**Did the strategy actually fail, or did the market conditions change?**
The market is not static.
It continuously moves between different conditions such as:
* Trending markets
* Ranging markets
* High volatility
* Low volatility
* Expansion
* Contraction
* Strong liquidity
* Reduced liquidity
A strategy that performs well in one environment may perform very differently in another.
That does not automatically mean the strategy is broken.
## The Market Changes Its Behavior
Imagine a strategy based on:
**Breakout → Retest → Entry**
During a strong trending market, the sequence might look like:
Breakout → Retest → Continuation → TP
But during a ranging market, the same setup might become:
Breakout → Retest → Failure → Return into the range → SL
The rules did not change.
**The market did.**
This distinction is extremely important.
## A Losing Period Does Not Automatically Mean Failure
Suppose a strategy produces several winning trades and then experiences 5 or 6 consecutive losses.
The natural reaction for many traders is:
*"The strategy stopped working."*
Then they start changing everything:
* Moving the Stop Loss
* Changing the Take Profit
* Changing the Risk/Reward
* Adding more indicators
* Changing the timeframe
* Changing trading sessions
* Adding more filters
Eventually, the original strategy becomes something completely different.
At that point, the trader is no longer testing the original system.
They are simply trying to make the strategy fit the current market.
## Win Rate Is Not Constant
A strategy does not have to produce the same win rate every week or every month.
For example, a sequence could look like:
**Win → Win → Loss → Loss → Win → Loss → Loss → Win**
Another period could look like:
**Loss → Loss → Loss → Win → Loss → Win → Win**
Short-term results can vary significantly even when the underlying statistical edge remains the same.
This is why judging a strategy based on a small number of trades can be misleading.
The larger sample matters.
## Risk/Reward Depends on Market Conditions
Another important point is Risk/Reward.
A trader may expect every setup to produce 1:3 or even 1:5.
But the market does not always provide the same amount of movement.
If the available price range during a particular session is relatively small, expecting a very large movement may not be realistic.
For example, a setup might naturally produce:
**1:1**
under normal conditions,
while a stronger expansion may provide:
**1:2 or 1:3**
and an exceptional move could provide:
**1:5 or more.**
This does not necessarily mean that one RR is better than another.
It means that the achievable movement depends on the market environment.
**RR should be considered in relation to volatility, liquidity, and the available price range.**
## Before Changing the Strategy, Analyze the Market
When performance deteriorates, instead of immediately asking:
> **"Is my strategy failing?"**
Ask:
> **"Does the current market still have the characteristics that my strategy is designed to exploit?"**
Look at objective data such as:
* ATR and volatility
* Average price range
* Trend strength
* Liquidity conditions
* Session behavior
* Failed breakouts
* Distance between key levels
* Frequency of continuation after a retest
* Expansion versus consolidation
These measurements can help identify whether the market has entered a different **market regime**.
## Sometimes the Correct Trade Is No Trade
This is one of the most difficult concepts for traders to accept.
If a strategy is designed to perform during directional markets, it does not necessarily need to trade during every ranging market.
Sometimes the correct decision is simply:
**NO TRADE.**
Waiting is not a failure.
Avoiding low-quality conditions can be part of the strategy itself.
## Strategy Failure vs. Market Change
There is a major difference between:
**Strategy Failure**
and
**Market Change.**
A strategy has genuinely failed when its underlying hypothesis no longer demonstrates a statistical edge after appropriate testing over a sufficiently large and relevant sample.
A market change means that the current environment is different from the conditions in which the strategy normally performs.
You cannot reliably distinguish between these two situations from just a handful of trades.
You need data.
You need a meaningful sample size.
And you need to analyze the market conditions surrounding those trades.
## Don't Force the Strategy to Trade
A strategy should not be modified every time the market becomes difficult.
If the market changes from a clean trend into a highly compressed range, forcing a trend-following strategy to produce signals may actually make the system worse.
The objective is not to make the strategy trade all the time.
The objective is to identify **when the strategy's edge is present.**
## The Bottom Line
Markets change.
Volatility changes.
Liquidity changes.
Session behavior changes.
Price movement changes.
Therefore, the performance of a strategy can also change from one period to another.
When a strategy enters a losing period, don't immediately conclude:
**"My strategy is broken."**
First analyze the data.
Check the market regime.
Check volatility.
Check the available range.
Check whether the setups are occurring under the same conditions that originally gave the strategy its edge.
The strategy may have a problem.
Or the market may simply be behaving differently.
Sometimes the strategy does not need to be changed.
**The trader needs to understand when the strategy is designed to work — and when the market is offering a completely different environment.**
Before saying:
> **"My strategy is not working anymore."**
Ask yourself:
> **"Has my strategy failed, or has the market changed?"**
That question can make a significant difference in how you evaluate a trading system.
Fibo Retest Before the Next Bullish WaveFundamental Analysis
Gold is recovering as the U.S. dollar, Treasury yields and oil prices ease ahead of today’s Fed decision. Markets are pricing roughly a 93% probability of a 25 bp hike, so the Fed’s guidance may matter more than the rate move itself.
Technical Analysis
On H1, Gold has reacted strongly from the 4,250–4,265 SSL and confirmed a bullish CHoCH followed by BOS.
Price is now testing the 4,325–4,350 Fibo Zone. A controlled pullback into this area may offer the cleaner continuation setup.
If buyers defend the zone, the next upside focus is the 4,365–4,380 POC, followed by 4,400–4,415 BSL.
Important Key Levels
4,400–4,415 — BSL / Major Resistance
4,365–4,380 — POC
4,325–4,350 — Fibo Zone
4,250–4,265 — SSL / Main Support
Trading Scenario
Buy priority remains on a pullback into 4,325–4,350 followed by bullish H1 confirmation.
Target: 4,365–4,380 first, then 4,400–4,415.
Invalidation: H1 acceptance below the Fibo Zone.
Overall View
Short-term momentum has shifted toward recovery after the BOS. Rather than chase the current move, the cleaner plan is to wait for support to hold and follow the next bullish wave.
Will Gold retest the Fibo Zone before pushing toward 4,400? Long 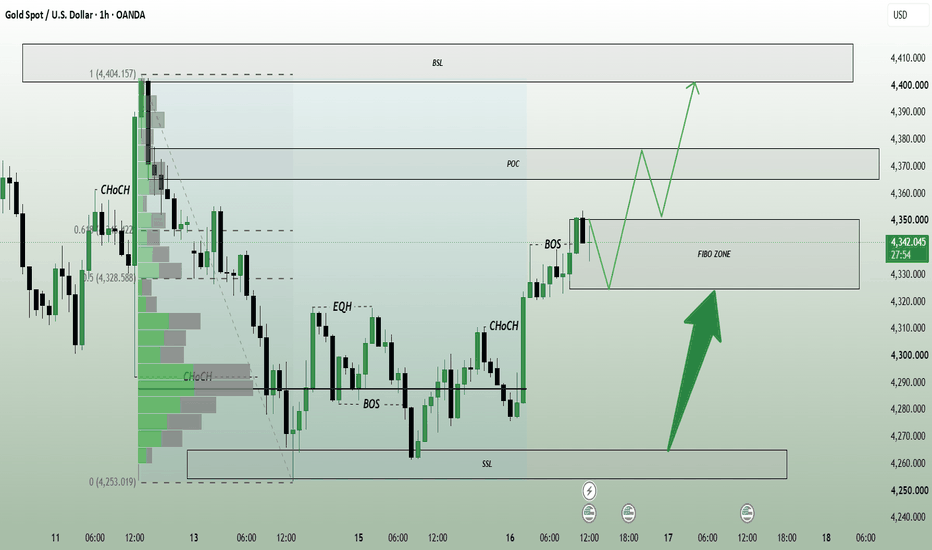
XAUUSD — 4,290 Retest Before the Next Push?
Gold is trading around 4,317 after a strong post-Fed recovery.
M30 structure is improving, but price is still sitting inside a near-term decision area.
A bounce is not enough.
The pullback will tell us more.
The simple read
The key zone today is 4,285–4,298.
If buyers defend this pullback area, Gold may recover toward 4,335 first, then challenge the major resistance around 4,357–4,367.
A clean breakout above that zone could open the way toward 4,396–4,399.
If 4,285 fails, the 4,277 OB becomes the next support.
Key price zones
4,285–4,298 — key pullback zone
4,277 — OB support
4,357–4,367 — major resistance
4,396–4,399 — upper target
4,236–4,245 — major support
The recovery structure is improving, but I prefer the pullback rather than chasing price.
Can 4,290 hold and send Gold toward 4,36x? Long 
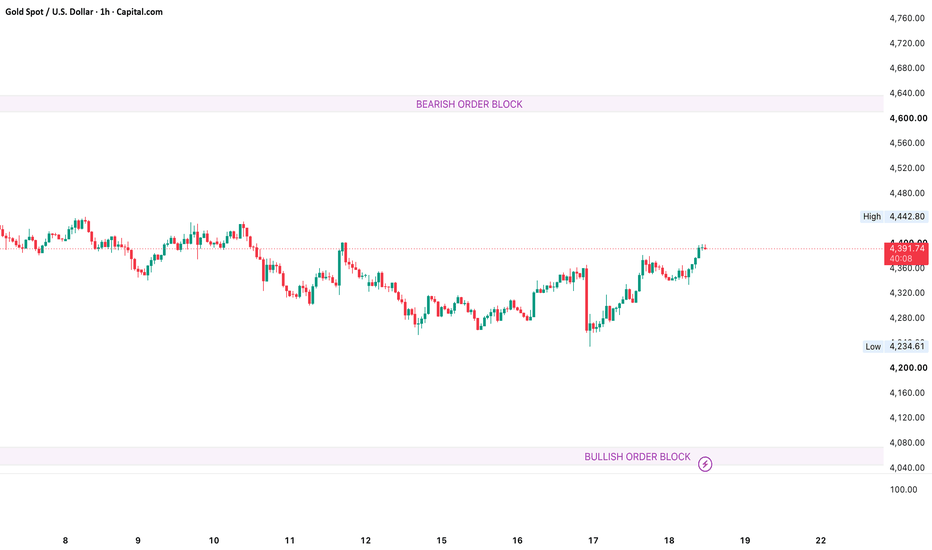
XAUUSD Reclaims 4,400 After the Fed Selloff - Can Buyers Hold ?Gold has staged a strong rebound after Wednesday's sharp post-Fed decline, recovering from the 4,240 area and pushing back toward/above 4,400. The recovery is constructive, but this remains an important decision area rather than a confirmed return to the broader uptrend.
DIRECTIONAL BIAS
Short-term: cautiously bullish while price holds above 4,350-4,370.
Broader confirmation: buyers still need sustained acceptance above 4,400-4,405 to strengthen the recovery structure.
KEY LEVELS
Resistance: 4,400-4,405 immediate breakout/acceptance zone; 4,430-4,450 next resistance area; 4,480 higher recovery objective if momentum expands.
Support: 4,350-4,370 first important support on a pullback; 4,300-4,320 key structural support; 4,260-4,280 major downside area if sellers regain control; 4,240 this week's post-Fed low region.
BULLISH SCENARIO
If Gold can establish acceptance above 4,400 rather than simply wick through it, the rebound can extend toward 4,430-4,450. A clean break and hold above that area would improve the structure further and expose the 4,480 region.
BEARISH SCENARIO
Failure to hold above 4,400 followed by a loss of 4,350-4,370 would suggest the current move is primarily a relief rally. In that case, 4,300-4,320 becomes the next important test. Losing 4,300 would put 4,260-4,280 back in focus, with the 4,240 post-Fed low becoming vulnerable again.
MACRO BACKDROP
The Federal Reserve raised rates by 25 basis points on September 16 to 3.75%-4.00% and signaled that additional tightening remains possible. Gold initially sold off sharply as the dollar and yields reacted to the hawkish message.
Since then, easing Treasury yields, a softer dollar and cooling oil prices have helped Gold recover strongly. Lower oil prices reduce some of the immediate inflation pressure that had been driving expectations for further tightening. At the same time, geopolitical risk in the Middle East remains an underlying source of safe-haven demand, although improving Saudi supply expectations have reduced some of the immediate energy-market stress.
CONCLUSION
The short-term picture has improved significantly after the recovery from 4,240, but 4,400 is the level that matters now. Holding above it would favor continuation of the rebound. Rejection from this area and a break back below 4,350 would shift attention toward 4,300 again.
For now, the bias is cautiously bullish above 4,350-4,370, with 4,400 acting as the key confirmation level.
Long