NQ1 Daily Technical AnalysisNQ1 - NASDAQ 100 E-mini Futures
Daily Technical Analysis
The NQ1 index continues to trade below its 21-day moving average (29,682).
With technical indicators remaining negative, we believe the index may test the 28,404 support level. If this support is broken to the downside, selling pressure could increase further.
The long-discussed AI bubble remains a potential risk in the market. The recent sharp declines in major technology stocks could be an early warning sign of a broader correction. Based on the current technical outlook, we believe selling pressure may continue.
Resistance: 28,909 – 29,160 – 30,077
Support: 28,404 – 28,227 – 27,542
This is not investment advice.
Futures market
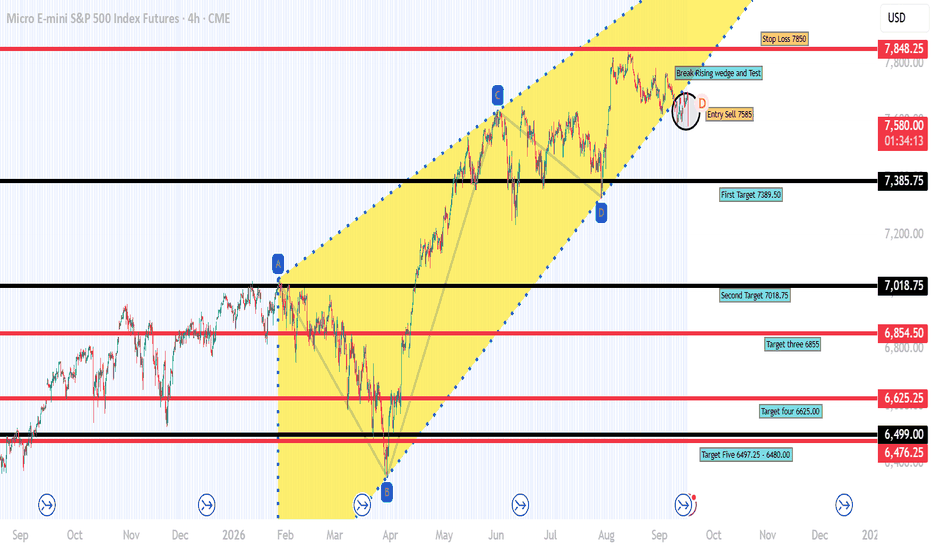
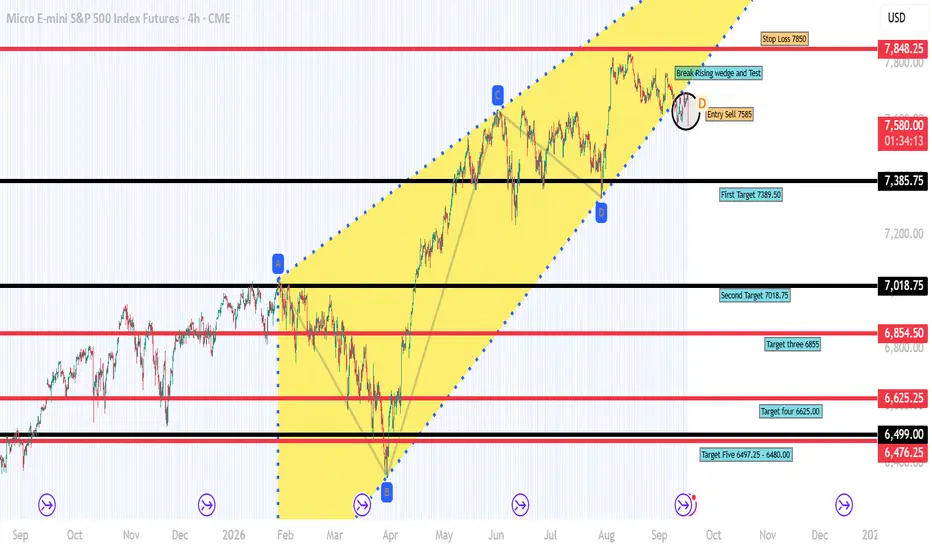
MES1 Daily Technical AnalysisMES1- Micro S&P 500 Index Futures
Daily Technical Analysis
The 21-day moving average (7,530), which was broken to the downside three days ago, continues to act as resistance and maintain selling pressure.
The MES1 index is currently testing the 7,468 support level. If this support is broken to the downside, the likelihood of increased selling pressure could rise significantly.
Looking at the technical indicators, they continue to point downward and have not yet reached oversold territory, suggesting that the selling pressure may continue.
Resistance: 7632 - 7648
Support: 7468 - 7390 - 7357
**This is not investment advice.**
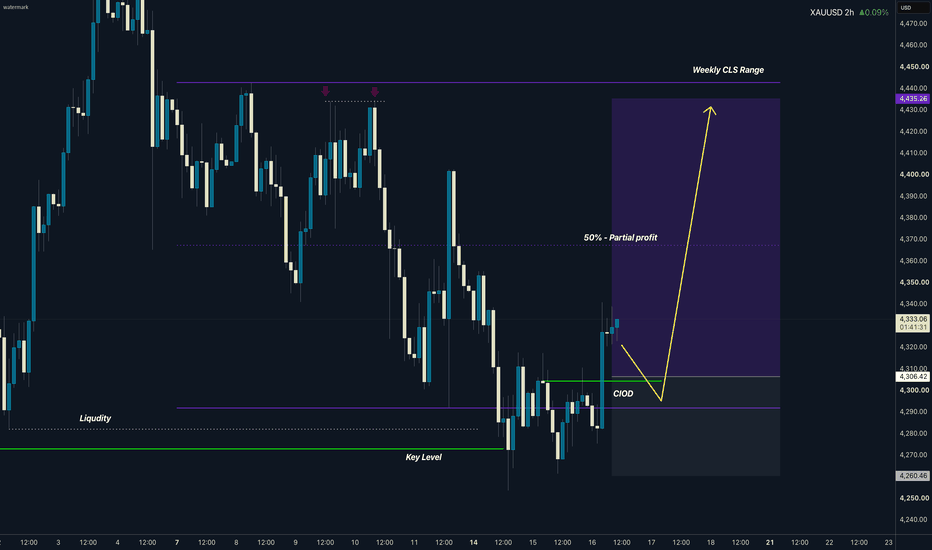
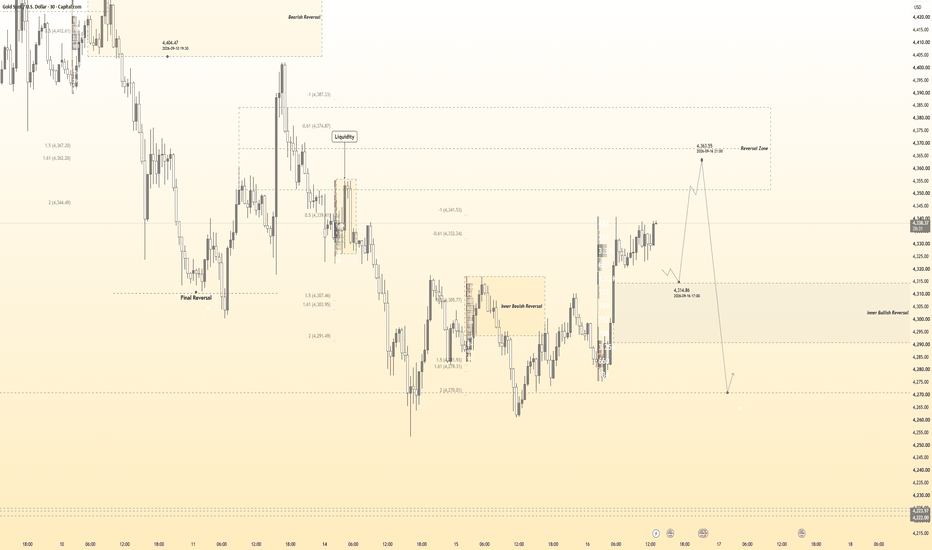
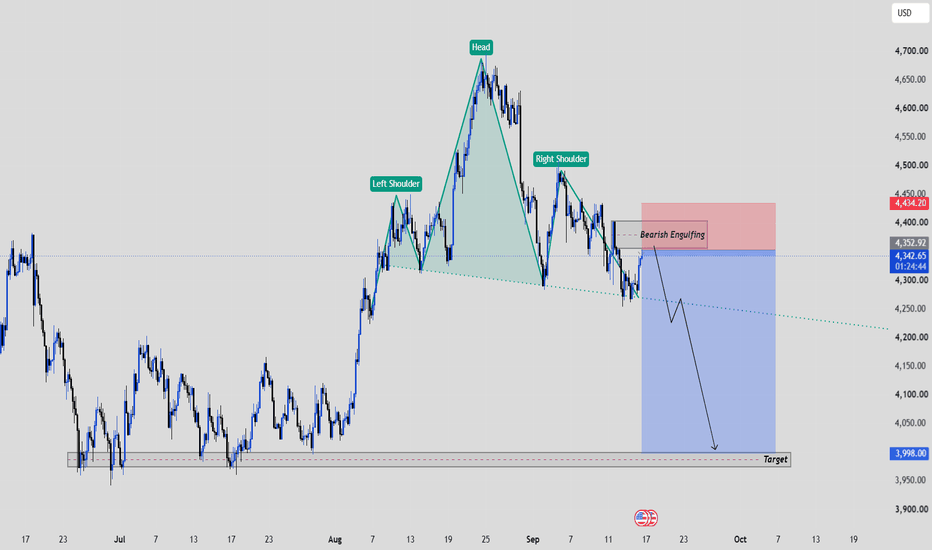
End of day trap but beginningThe reason why I took the cell is because the double top formation from the previous days New York session close,
It is led to believe that once market has gone One direction strongly it is expected for market controllers to distribute a double top formation of some sort to reverse the market.
It is further evident that this structure on The daily time frame poses a good sell momentum within the consolidated range
July 21, 2026 - XAUUSD Analysis and Potential Opportunity📊 Summary:
The weekly chart closed with a bearish candle, while the daily chart printed a strong bullish candle. On the 4H chart, gold formed a bullish outside bar (2B) around the 3960 support, keeping the bullish bias intact as long as 3960 holds.
Gold is currently consolidating within the 4000–4020 range. While price remains inside this range, the preferred approach is to sell near resistance and buy near support. A break and hold above 4020 would shift the strategy to buying pullbacks where support holds. If price breaks below 3998, short opportunities may emerge, but with nearby support levels, prioritize protecting profits and let only the remaining runner stay open.
🔍 Key Levels to Watch:
• 4065 – Resistance
• 4040–4043 – Resistance
• 4030 – Resistance
• 4020 – Resistance
• 3998–4002 – Support
• 3990 – Support
• 3983 – Support
• 3970 – Support
📈 Intraday Strategy:
SELL: If price breaks below 3998 → target 3995, with further downside toward 3990, 3984, 3975
BUY: If price holds above 4020 → target 4025, with further upside toward 4030, 4035, 4040
If you find this helpful or traded using this plan, a like would mean a lot and keep me motivated. Thanks for the support!
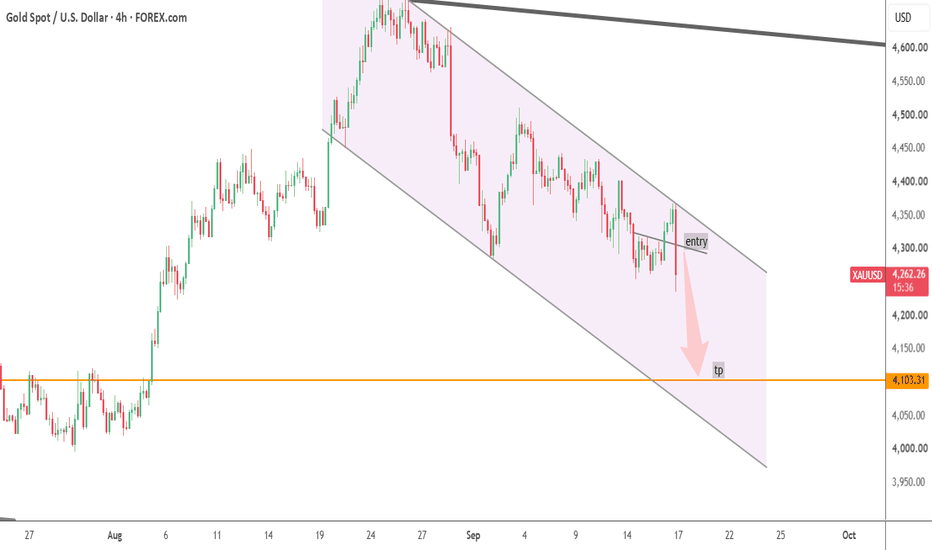
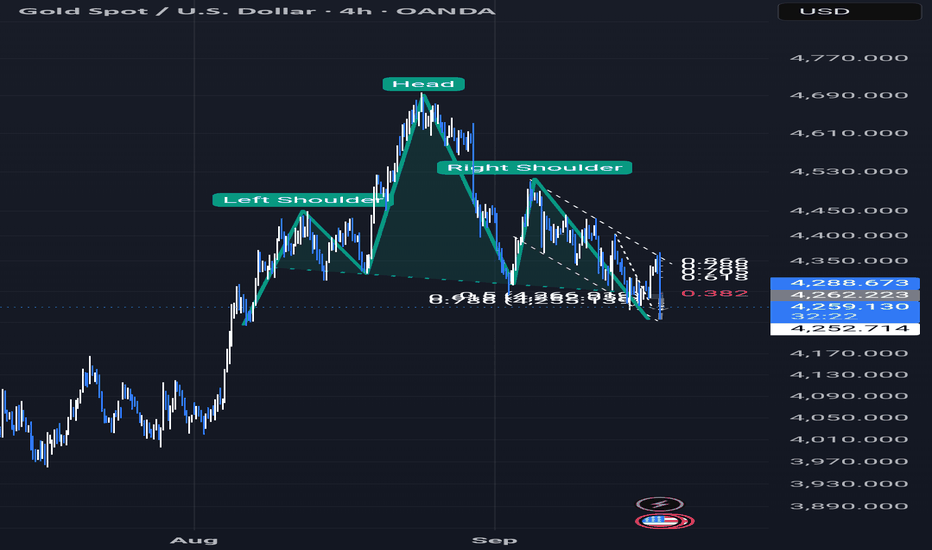
xauusd thoughtscurrently gold is price trapped at key psych level..4hr and 12hr bullish divergence we formed from friday lows at the same time we have a bearish trendline that has not broken and the daily 9ema was respected inside of a bearish daily orderblock to add further we have a death cross to the downside
Breakout Zones MGC 15m / 19 JulyKey Levels:
The identified range is bounded by Demand and Supply zones, defended respectively by buyers and sellers.
Strategy:
We are looking for a decisive breakout of the range with a tight stop-loss.
Trade Management:
Breakout to the upside → Long, targeting the Supply zone as TP.
Breakout to the downside → Short, targeting the Demand zone as TP.
Thanks to gold's volatility, a trade never lasts more than one day.
Drop a Boost if you like the idea and follow for daily setups 🚀
# NQ Notes from Recent High Frame Price Action — 7/20# NQ Notes from Recent High Frame Price Action — 7/20
## Key Observations
* NQ continues trading within the larger **higher-timeframe consolidation**, but the short-term trend has shifted decisively bearish after losing the rising support trendline that had been supporting price since mid-June.
* Price is now sitting directly above the major **28,653 demand zone**, one of the most important support areas on the entire chart.
* The overnight **7/21** session opens with sellers still controlling momentum, but they are beginning to test a level where buyers have previously stepped in aggressively.
---
## Technical Breakdown
### Resistance
**Immediate**
* 28,816
* 28,958
* 29,129
**Major**
* 29,193
* 29,265
* 29,690
* 29,955
### Support
**Immediate**
* 28,653
**Major**
* 28,090
* 27,413
* 27,378
---
## Volume & Trend Analysis
* Momentum continues favor the sellers after breaking beneath both the short-term moving averages and the rising trendline.
* Volume expanded into the recent selloff, suggesting institutions were active during the breakdown rather than this simply being profit taking.
* Despite the recent weakness, price is now entering a historically significant higher-timeframe demand zone where buyers have repeatedly defended over the past several months.
---
## Pattern Structure
The larger chart continues to resemble a **multi-week consolidation** inside a broad contracting structure.
The long-term trendline from the June highs remains overhead resistance, while **28,653** has become the key floor supporting the entire consolidation. The market is approaching a decision point where either buyers defend support and begin another rotation higher, or sellers finally force a breakdown that opens considerably more downside.
---
## Trading Plan
### Bullish Scenario
**Trigger**
* Hold above **28,653** and reclaim **28,816**.
* Acceptance above **28,958** would indicate buyers are regaining short-term control.
**Targets**
* PT1: 28,816
* PT2: 28,958
* PT3: 29,129
**Extended Targets**
* 29,193
* 29,265
* 29,690
* 29,955
**Invalidation**
* Sustained acceptance below **28,653**.
---
### Bearish Scenario
**Trigger**
* Lose **28,653** with continued acceptance below support.
**Targets**
* PT1: 28,090
**Extended Targets**
* 27,413
* 27,378
**Invalidation**
* Strong reclaim above **28,958** followed by acceptance above **29,129**.
---
## Conclusion
NQ enters the overnight **7/21** session at one of the most important technical levels on the chart. The short-term trend favors sellers after the recent breakdown, but price is now testing the major **28,653** higher-timeframe demand zone. Buyers need to defend this area to preserve the broader consolidation and set up another rotation back toward **29,129–29,690**. If sellers establish acceptance below **28,653**, however, the probability increases significantly for an extension toward **28,090**, with the potential for a much deeper move into the **27,400** region before meaningful higher-timeframe support is expected.
S&P500| Profit-Taking Pullback Before ContinuationES1! is still trading inside a strong bullish higher-timeframe structure, but price is currently sitting at a key decision area near the highs.
My read is that the market may need a deeper liquidity pullback before continuing higher.
Price has already pushed aggressively to the upside, and after this kind of expansion, I do not want to blindly buy the high. I want to see whether the market pulls back into a better discount area, sweeps liquidity, and then forms a cleaner continuation setup.
The area I am watching for a possible pullback is around the 7,000–6,800 region.
If price pulls into that zone and buyers defend, then I would expect a continuation move back toward the highs and potentially into new upside targets.
My main scenarios:
Bearish short-term case:
Price rejects from the current high area and pulls back toward the 7,000–6,800 liquidity zone.
Bullish continuation case:
After that pullback, if buyers defend the zone, I expect price to rotate higher and continue the broader bullish trend.
Invalidation / reassessment:
If price breaks and holds above the current high without giving the pullback, then the short-term pullback idea is delayed, and I would reassess the structure.
Gold / US Market Theory
My theory is that while this short-term ES pullback is in play, some investors may secure profits from the U.S. equity market and rotate attention toward gold.
Gold has remained attractive in a risk-sensitive environment, and if equities pause or retrace from the highs, capital may temporarily favor safer or more defensive assets. That does not mean equities are bearish long-term. It simply means the market may be going through a profit-taking and liquidity-rebalancing phase before the next major move.
So for now, I am watching for a possible short-term ES pullback while gold remains an important market to monitor.
Mindset
For me, this setup is not about calling a crash.
The higher-timeframe structure is still bullish.
This is about recognizing that even bullish markets need pullbacks. Strong trends often retrace, collect liquidity, trap late buyers, and then continue.
My job is not to force the market to drop.
My job is to wait for the reaction, respect the invalidation, and only act if the structure confirms.
If price gives the pullback and buyers defend, I look for continuation.
If price refuses to pull back and breaks higher, I step aside and remap.
No ego.
No forcing.
No prediction.
Just structure, liquidity, and execution.
This is my personal chart read and not financial advice.
Crude Oil MCX Fut Intraday Technical Analysis for 21st July, 26MCX:CRUDEOIL1!
Crude Oil Futures (MCX) | Intraday Structure | July 21, 2026
Crude Oil is trading around 8,002, holding slightly above the 7,994 Zero Line after stabilizing following a sharp pullback from the 8,196 high. The contract has reclaimed its central inflection zone and is building a tight base as buyers attempt to regain control.
Price action enters the new session compressed near its primary pivot. Institutional desks are watching closely to see if price can hold above the Zero Line and build acceptance toward the higher targets, or if resistance cap pressure triggers another leg down. Wait for a high-volume 15-minute candle to break away from this cluster before committing capital.
Bullish Triggers
Long Entry: Above 8,020 (strongly validated if price holds structural footing above the 7,965 Add Long Pos. band).
Targets: 8,280 - 8,456
Risk Control: Structure weakens below 7,965. Hard exit below 7,866.
Bearish Triggers
Short Entry: Below 7,910 (validated if liquidity pushes fail to maintain the 7,994 Zero Line, turning it into a rigid distribution ceiling).
Targets: 7,708 - 7,532
Risk Control: Cover immediately above 8,064. Bias remains structurally protected below 8,196.
No-Trade Chop Zone: 7,866 - 8,020
Expect rotational, choppy price action within this decision range as commercial participants balance risk. Avoid chasing early morning whipsaws inside this block; let a clean 15-minute structural candle breakout provide execution confirmation.
Execution Rule: Structure first, confirmation next. Zero anticipation.
Hit Boost and drop your view in the comments if you're tracking these levels today.
#CrudeOil
Latest Gold Price Analysis on July 20
🟡 Gold Weekly Analysis | July 20
Market Review & Next Week Trading Plan 📊
Dear traders, happy weekend! ☀️
This week, gold experienced a typical roller-coaster market, with strong volatility between bulls and bears.
Gold opened near:
🔥 4120 USD
Weekly movement:
📈 High: 4120 USD
📉 Low: 3959 USD
Total volatility exceeded:
🔥 160 USD
The weekly candle closed with a large bearish body and a long lower wick, showing strong selling pressure but also clear buying support near lower levels.
🌍 Weekly Market Review
Gold followed a repeated cycle:
📉 Selling pressure release
+
📈 Lower-level buying support
Monday: Sharp Decline
Gold opened weak and dropped nearly:
🔥 119 USD
The price broke below:
📌 4000 USD
Main factors:
• Geopolitical risks were already priced in
• Market increased expectations of higher-for-longer interest rates
• Funds moved back into USD assets and US Treasuries
Tuesday: Technical Rebound
After becoming oversold, gold attracted buying interest.
Price rebounded to:
🎯 4103 USD
This recovered part of Monday’s losses.
Wednesday: Consolidation
Gold moved sideways above:
📌 4050 USD
The market waited for:
🏦 Fed comments
📊 Monetary policy signals
Thursday & Friday: Bearish Pressure Returned
Hawkish Fed comments and stronger US economic data increased expectations that:
⚠️ High interest rates may continue longer.
As a result:
📈 Treasury yields rose
📈 Dollar strengthened
Gold fell sharply:
🔥 Thursday dropped nearly 82 USD
and broke below:
📌 4000 USD
On Friday, gold tested:
🔥 3960 USD
However, buying from institutions and bargain hunters helped gold recover above:
📌 4000 USD
This shows:
✅ Buyers remain active
✅ Bears have not fully taken control
📈 Technical Analysis
Weekly Chart
Gold remains below medium-term moving averages.
Bollinger Bands continue pointing downward, meaning:
📉 Medium-term structure remains weak.
The long lower wick indicates:
➡️ Downside momentum is slowing
➡️ But no confirmed bullish reversal yet
🔑 Important Price Levels
🔴 Resistance
4080-4100 USD
This is the key bullish/bearish dividing zone.
A sustained breakout above this area could improve market sentiment and open further upside potential.
🟢 Support
3940-3960 USD
This is the lower boundary of the recent two-month range.
A breakdown below this zone may open the way toward:
🎯 3880 USD
🎯 3830 USD
📊 Daily Outlook
Technical indicators show:
• MACD bearish momentum is weakening
• Gold is entering an oversold area
This suggests:
➡️ Short-term rebound potential exists.
However, current rebounds are still viewed as:
⚠️ Technical corrections inside a weak trend.
Moving averages above price continue creating resistance, so a strong bullish reversal has not been confirmed.
🌍 Key Factors Next Week
1️⃣ Federal Reserve Policy
Watch:
🏦 Fed speeches
📊 Inflation data
📊 Employment data
If US data remains strong:
➡️ Rate-cut expectations may weaken
➡️ Gold upside could remain limited
2️⃣ Geopolitical Risks
Middle East developments remain important.
Escalation could:
🌍 Push energy prices higher
🌍 Increase inflation concerns
🌍 Support safe-haven demand
A calmer situation could reduce gold support.
🔥 Next Week Trading Plan
Overall:
Gold is likely to remain in a consolidation range.
Main range:
📌 3960-4080 USD
Before a clear breakout:
⬇️ Below 3940
or
⬆️ Above 4080-4100
the market may continue sideways.
Trading Strategy
Avoid chasing price.
Focus on key areas:
🔴 Sell Opportunities
Resistance:
• 4020-4030 USD
• 4050-4060 USD (strong resistance)
• 4080-4100 USD (trend reversal zone)
If price shows rejection:
First, look for selling opportunities around 4020-4030. If the price breaks through this area strongly, choose to wait and focus on 4040-4060 to look for short selling opportunities.
Sell zone:
🔥 4050-4060
Stop loss:
⚠️ 4075
Targets:
🎯 4030 / 4000
🟢 Buy Opportunities
Support:
🔥 3940-3960 USD
If this area holds, short-term rebound opportunities may appear.
💬 Final Thoughts
Gold is currently at a critical decision point.
Future direction depends on:
🏦 Fed policy
💵 Dollar strength
📈 Treasury yields
🌍 Geopolitical developments
Stay patient, follow the trend, and wait for high-quality opportunities.
Thank you for your support and trust.
Next week, we continue our gold trading journey together. 🚀
💰 Trade smart
📈 Stay disciplined
🏆 Build consistent results
CRUDE OIL Short
CRUDE OIL SELL LIMIT ORDER : 84.01
Stop Loss: 87.17
Remove risk/Partials @ : 81.18
Take profit: 80.06
Trade Plan: Short
Bias: BEARISH short term.
Entry reason: Price will most likely test key TPO area. The short-term valuation tool also shows temporarily overvalued against the competing index
Stop Loss: Above nearest high.
First target: 81.18
Please refer to WTI for CFDs symbols
XAUUSD Analysis TodayToday's gold overall belongs to a technically oversold rebound within a broader bearish consolidation trend. Geopolitical safe-haven flows only deliver short-lived, impulsive recovery; tightening interest rate expectations remain the dominant driver. For the day, price action is expected to follow a "rally-then-pullback, range-bound with downside bias" pattern with no room for a one-sided bullish surge.
Key Technical Levels:
Support Levels
Immediate near-term support: 3998–4000 (psychological level, intraday bull-bear pivot)
Strong support: 3970–3980 (today's intraday low zone; a break below signals the rebound is over)
Ultimate defensive support: 3950–3960 (key weekly bottom; a break opens downside toward 3900)
Resistance Levels
Immediate near-term resistance: 4028–4030 (intraday high, current rebound ceiling)
Medium-term strong resistance: 4045–4050 (dense moving average cluster; unlikely to break in a single move today)
Trend reversal resistance: 4080 (only a sustained close above this level reverses the short-term downtrend structure)
Trading Strategy:
Sell 4025 – 4030
SL 4045
TP 4000 – 3995 – 3975
Buy 3970 – 3980
SL 3950
TP 4000 – 4010 – 4025
Oil Tests 50-MA as Iran Tensions Keep Bulls HopefulOil prices are once again testing a crucial technical level as WTI trades around its 50-day moving average, with the 50-day moving average near USD 85 acting as a major resistance. A decisive break above this zone could reignite bullish momentum and attract additional buying interest. However, failure to overcome this level may result in another move lower.
The geopolitical backdrop remains a key driver. Reports of renewed tensions involving Iran have increased concerns over potential supply disruptions in the Middle East, adding a risk premium back into crude prices. Any further escalation or disruptions to major shipping routes could quickly push oil higher.
Fundamental factors also support increased volatility. OPEC+ continues to manage production carefully, while global inventories remain relatively tight in several regions. At the same time, expectations of lower interest rates later this year could improve the outlook for global economic growth and, in turn, increase demand for crude oil.
On the other hand, downside risks remain significant. If geopolitical tensions ease or negotiations reduce the risk of supply disruptions, much of the current risk premium could disappear. Slowing global growth, weaker manufacturing activity, and disappointing demand from China would also weigh on prices.
Technically, the USD 85 area remains the key battleground. A sustained break above the 50-day moving average could trigger another leg higher, while rejection at this resistance may send WTI back toward the USD 70 region, where stronger long-term support is expected.
USOIL/CRUDEOIL - Will it break the Triple Confluence Resistance?TF: Daily
CMP: $82
The recovery from 67 odd levels is now facing resistance at this $82-R83 zone.
Falling trendline from the top
The GAP Zone
Rising trendline connecting March and April lows of this year (the Black line)
Taking a bullish bet at this juncture isn't advisable and I expect the price to pullback towards the $70 mark at the least.
Bias will be invalid if it starts to trade above $86 on Daily Closing Basis
Disclaimer: I am not a SEBI registered Analyst and this is not a trading advise. Views are personal and for educational purpose only. Please consult your Financial Advisor for any investment decisions. Please consider my views only to get a different perspective (FOR or AGAINST your views). Please don't trade FNO based on my views. If you like my analysis and learnt something from it, please give a BOOST. Feel free to express your thoughts and questions in the comments section.
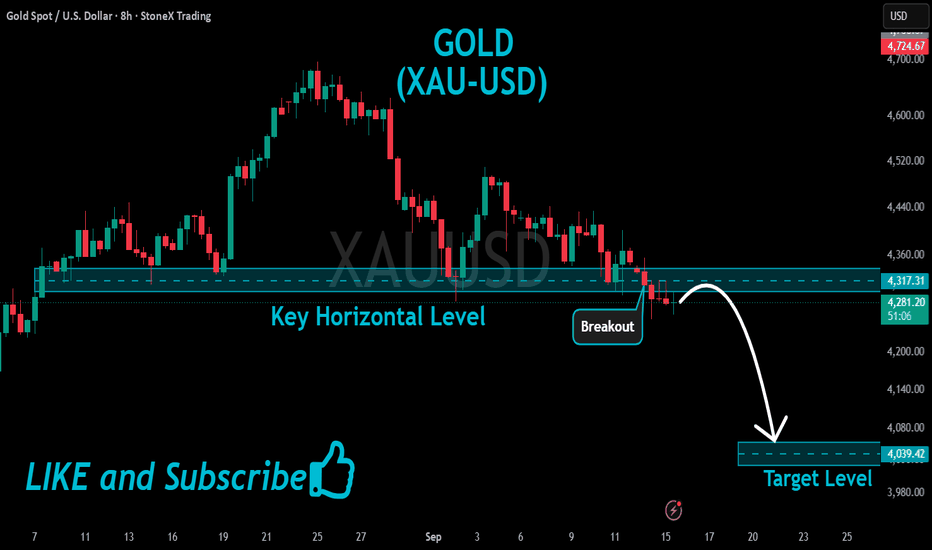
Gold Technical Analysis | Sell Setup Below ResistanceMarket Analysis
Gold is trading below a key resistance zone after several failed breakout attempts. Price continues to respect this supply area, indicating that sellers remain in control. Unless buyers achieve a strong close above resistance, the market favors a bearish continuation toward lower support levels.
Key Levels
Current Price: 4,017.50
Resistance: 4,045.00
Support: 3,975.00
Target 1: 3,975.00
Target 2: 3,935.00
Trading Plan
Bias: Bearish below 4,045.00.
Look for short opportunities on rejection from the resistance zone or after a confirmed break below 4,000.00. A sustained move above 4,045.00 would invalidate the bearish outlook.
Conclusion
The market structure remains bearish while trading below resistance. A rejection from the current zone could trigger a move toward 3,975.00, with 3,935.00 as the next downside objective. Wait for confirmation before entering and always apply proper risk management.
Gold Buy Setup | Gap Fill Complete, Buyers Eye 4060XAU/USD (Gold) 15-Minute Technical Analysis
Bias: 🟢 Bullish (Buy on Support)
The chart shows price pulling back after breaking below the rising channel, creating a potential fake breakdown/liquidity sweep near support. Buyers appear to be defending the 3985.80 demand zone, increasing the probability of a bullish rebound if this level continues to hold.
Key Technical Observations
Channel Breakdown: Price slipped below the ascending channel, but momentum remains limited, suggesting a possible false breakout.
Liquidity Grab: The circled area highlights where liquidity was likely taken before the market moved lower.
Support Zone: 3985.80 is the immediate demand area where buyers may re-enter.
Resistance Levels:
4010–4015 (first obstacle)
4020–4025 (recent swing high)
4060.30 (major bullish target)
Trading Plan (Bullish Scenario)
Entry: 3986–3992 (after bullish confirmation/rejection candle)
Stop Loss: 3969.25 (below support)
Take Profit 1: 4010
Take Profit 2: 4025
Take Profit 3: 4045
Take Profit 4: 4060.30
Invalidation
A strong 15-minute candle closing below 3969.25 would invalidate the bullish setup and could expose the market to deeper downside toward 3955 and 3940.
Conclusion
The overall structure favors a buy-the-dip strategy while price remains above 3969.25. Holding the 3985 support zone could trigger a recovery toward 4060, offering an attractive risk-to-reward opportunity. Wait for bullish price action confirmation before entering rather than buying immediately.
GOLD NEW ANALYSIS BEARISH(READ CAPTION) Bearish Continuation Setup Toward 3,941
The market continues to respect the descending trendline, signaling that sellers remain in control despite the recent bounce. Price is approaching a critical resistance area where bearish momentum could resume.
Key Levels
Resistance: 4,081
Short-Term Resistance: 4,045
Support: 3,986
Target: 3,941
Technical Outlook
After rejecting from the upper trendline, the market remains within a bearish structure. The current recovery is likely a retest of resistance before the next downside leg.
My preferred scenario is:
Price retests the 4,045–4,081 resistance zone.
Sellers defend the area and create a lower high.
A break below 3,986 support confirms bearish continuation.
Momentum extends toward the 3,941 target zone.
Bearish Scenario
Rejection from 4,045–4,081
Maintain lower-high structure
Break below 3,986
Decline toward 3,941
Alternative Scenario
If price breaks and closes above 4,081, the bearish outlook would be invalidated, increasing the probability of a stronger bullish recovery.
Trading Idea
The descending trendline remains the key technical barrier. As long as price trades below 4,081, rallies may provide selling opportunities with 3,941 as the primary downside objective.
Bias: Bearish below 4,081
Invalidation: Sustained close above 4,081
Downside Target: 3,941
Take Action🚨 **XAUUSD SIGNAL** 🚨
📉 **Market Bias: DOWNTREND**
The market remains in a bearish trend. Focus on **SELL** opportunities while following your trading strategy and wait for proper confirmation before entering. Avoid FOMO trades.
✅ Trend: Bearish
🎯 Focus: SELL
⚠️ Risk only 1–2% of your capital per trade.
📊 *Trade with the trend, not against it.*
**Disclaimer:** This is not financial advice. Always conduct your own analysis before making any trading decisions.
#XAUUSD #Gold #Forex #Trading #SmartMoney #SMC #PriceAction #GoldSignal
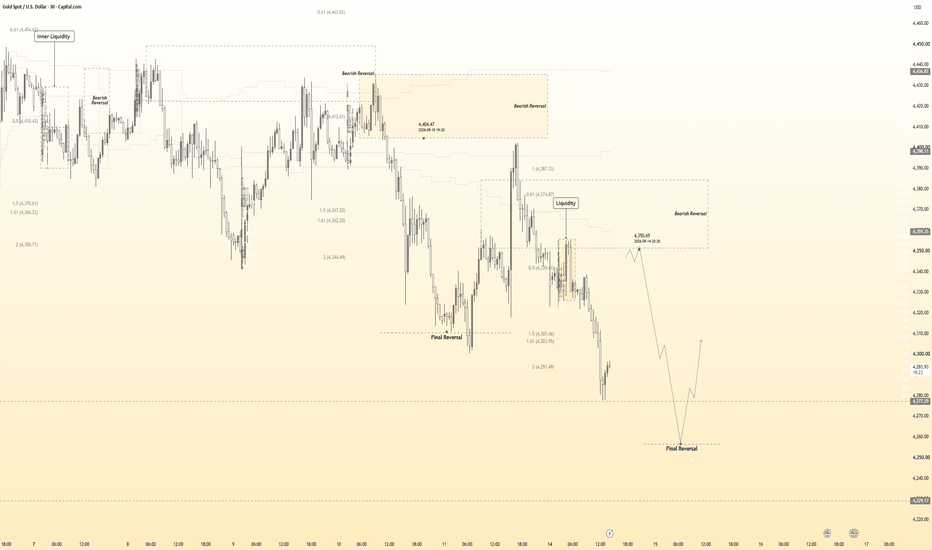
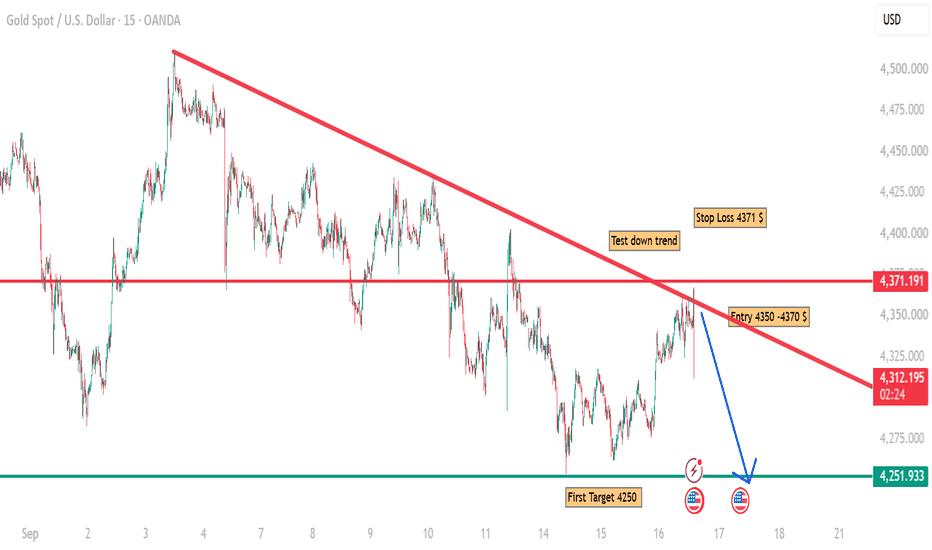
XAUUSD: Bearish Structure – Multiple Selling Opportunities AheadMarket Structure Overview:
Gold remains in a clear downtrend on the higher timeframes. We are seeing consistent lower highs and lower lows, with sellers dominating the price action.
Key Selling Zones: Immediate Selling Zone: 4350 – 4370
Strong Bearish Order Block in the current downtrend. High probability for short entries with good risk-reward.
Break & Sell Setup: 3945 – 3950
If price breaks the bullish trendline, this level becomes a strong retest area for aggressive shorts.
Long-Term Buying Zone (Counter-Trend):
3430 – 3470
Fibonacci Extension Zone – Major demand area for potential long-term reversal or deep pullback bounce.
Trade Plan Summary: Focus on shorts from 4350-4370 with trend alignment
Watch for trendline break to add more short positions at 3945-3950
Keep 3430-3470 on watchlist for long-term buying opportunity
Bias: Bearish (with clear counter-trend level at lower Fib zone)
This is not financial advice. Always manage your risk properly and confirm with your own analysis.
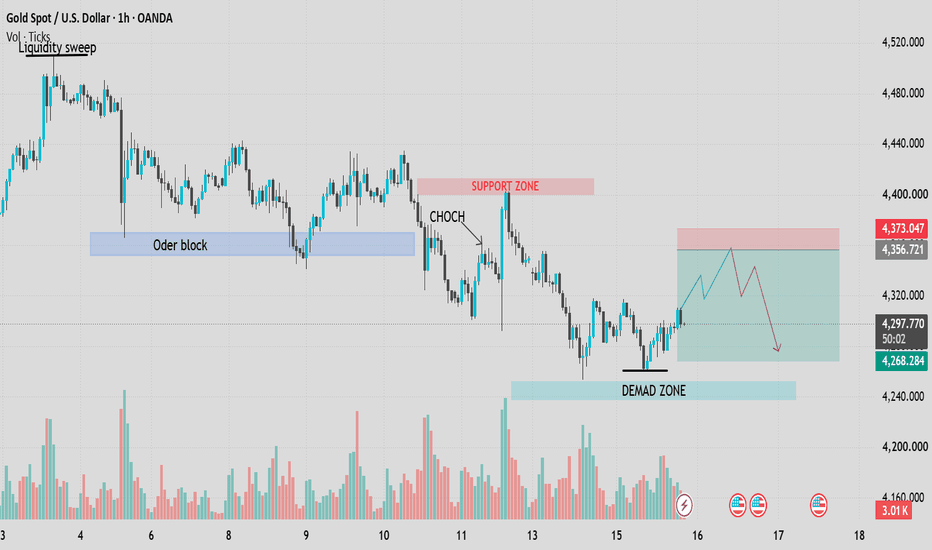
Gold H1 | Bullish Bounce In PlayBased on the H1 chart analysis, we can see that the price has bounced off our buy entry level at 4,004.09, which is a pullback support.
Our stop loss is set at 3,964.78, which is a pullback support.
Our take profit is set at 4,037.69, which is an overlap resistance.
High Risk Investment Warning
Stratos Markets Limited fxcm.com Stratos Europe Ltd, fxcm.com CFDs are complex instruments and come with a high risk of losing money rapidly due to leverage. 69% of retail investor accounts lose money when trading CFDs with this provider. You should consider whether you understand how CFDs work and whether you can afford to take the high risk of losing your money.
Stratos Global LLC fxcm.com Losses can exceed deposits.
Please be advised that the information presented on TradingView is provided to FXCM (‘Company’, ‘we’) by a third-party provider (‘TFA Global Pte Ltd’). Please be reminded that you are solely responsible for the trading decisions on your account. Any information and/or content is intended entirely for research, educational and informational purposes only and does not constitute investment or consultation advice or investment strategy. The information is not tailored to the investment needs of any specific person and therefore does not involve a consideration of any of the investment objectives, financial situation or needs of any viewer that may receive it. Past performance is not a reliable indicator of future results. Actual results may differ materially from those anticipated in forward-looking or past performance statements. We assume no liability as to the accuracy or completeness of any of the information and/or content provided herein and the Company cannot be held responsible for any omission, mistake nor for any loss or damage including without limitation to any loss of profit which may arise from reliance on any information supplied by TFA Global Pte Ltd.
Stratos Trading Pty. Limited fxcm.com Trading FX/CFDs carries significant risks. FXCM AU (AFSL 309763), please read the Financial Services Guide, Product Disclosure Statement, Target Market Determination and Terms of Business at fxcm.com