Long
Long
 Short
Short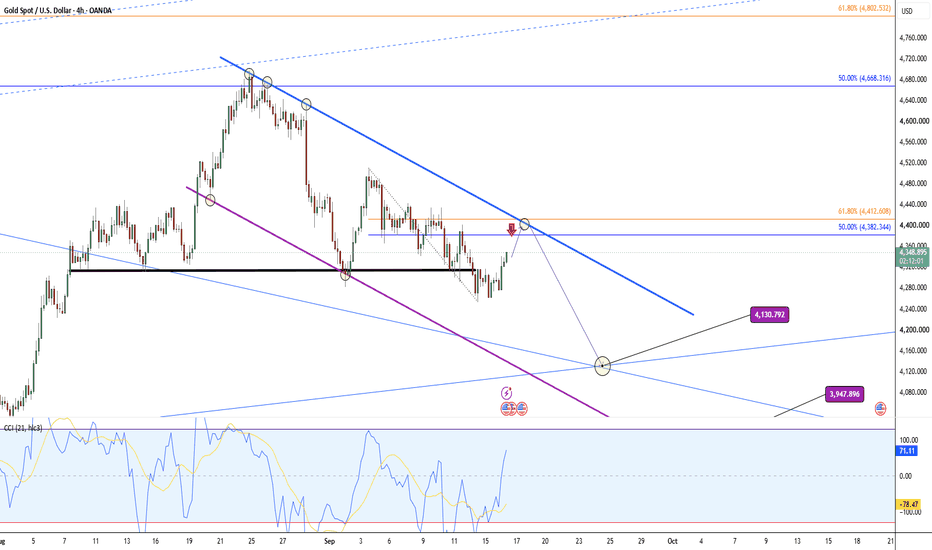
Long 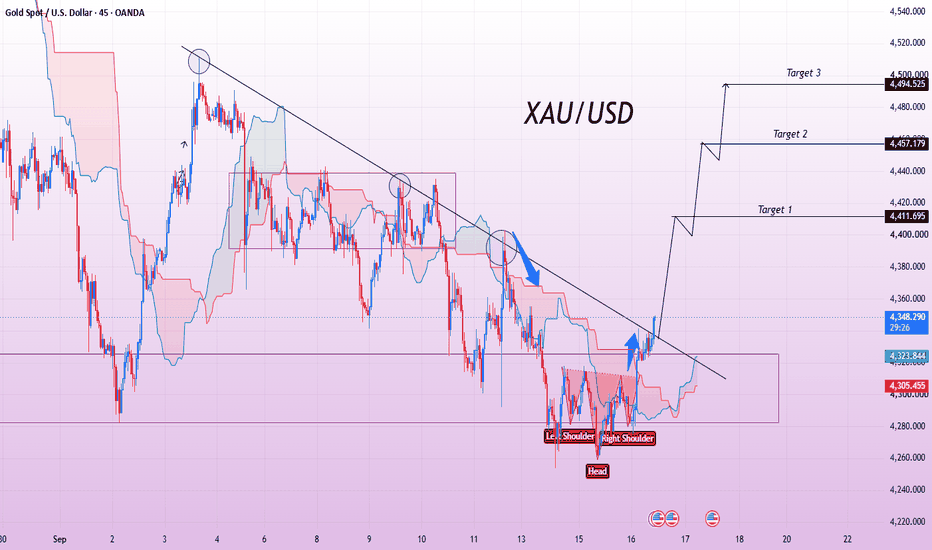
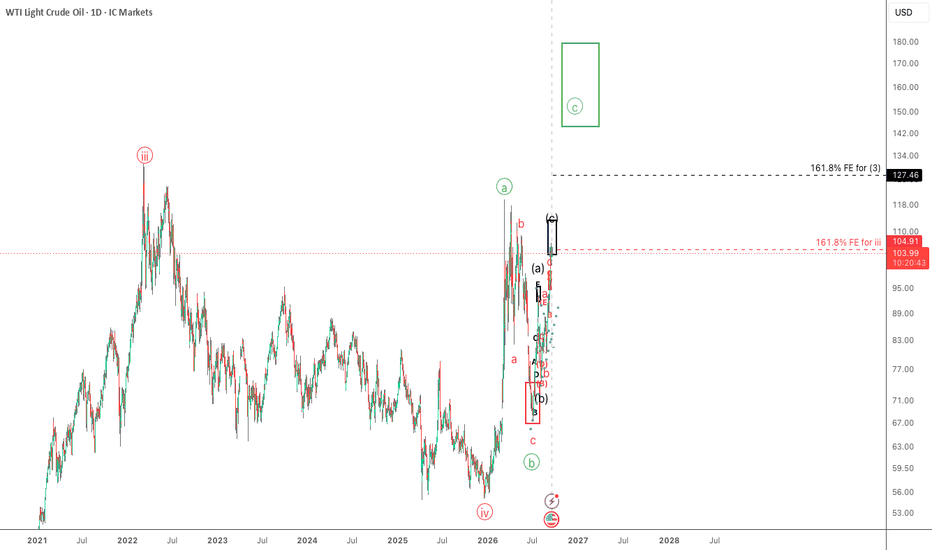
DXY, Gold (XAUUSD), & WTI Crude: Macro Elliott Wave OutlookMarket Bias: Bullish (DXY), Neutral/Bearish (XAUUSD Macro), Bullish (WTI Crude)
Analysis Breakdown:
DXY (US Dollar Index):
Macro Structure: Following the major cycle peak, DXY has carved out a solid multi-month accumulation base. We are breaking out from a large ascending triangle structure, signalling a long-term bottom.
Targets & Near-Term: A breakout above the intermediate resistance box targets 103.90, with an extended macro target between 105.00 – 105.50. Near term, expect possible pullbacks to test Fibonacci retracement levels (23.6%, 38.2%, or 50%) before continuation, particularly with upcoming FOMC and retail sales data. A favorable 12:1 R:R long setup remains valid above the base.
Gold (XAUUSD):
Tactical Wave Play: Gold broke out of the corrective descending channel following a flush-out. Tactically, we are completing a micro 5-wave triangle/diagonal structure into wave (E).
Targets: Anticipating a rally toward the $4,396 – $4,400+ liquidity zone to finish intermediate wave (B).
Macro Outlook: The larger timeframe suggests this bounce feeds a broader ABC correction or complex structure, with long-term lower targets down near $4,100 – $4,050 once wave (C) unfolds.
WTI Crude Oil (XTIOIL):
Macro Impulse: Oil has held higher lows throughout 2026 and is showing explosive upside momentum.
Projections: Currently testing intermediate resistance near $104. A minor consolidation or shallow pullback here is expected, followed by a powerful Wave (3) impulse targeting previous structural highs of $130 – $132, with Fibonacci extension targets stretching toward $144+.
Short 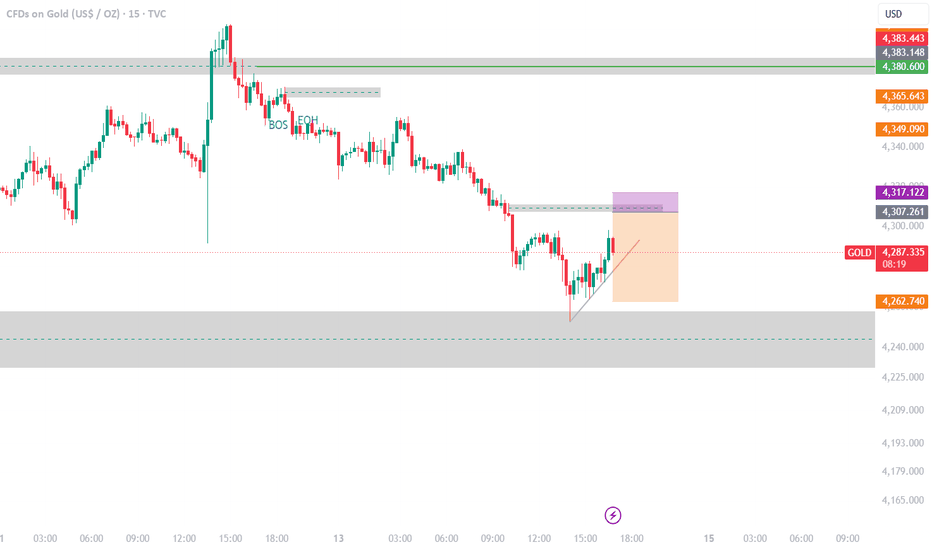
XAUUSD — 4,371 Opens the Recovery XAUUSD — 4,371 Opens the Recovery
Gold is sitting in a very important decision area right now. Price is trading around 4,346, just below the short-term resistance zone, while the market waits for the Fed rate decision. This is not a clean bullish reversal yet, but the chart is starting to show that buyers are trying to build a recovery from the lower side of the structure.
From the SMC view, the larger trend is still damaged. Gold dropped strongly from the late-August high, then moved inside a bearish correction channel. That tells me sellers still have control in the bigger picture. But price is now trying to push out from the lower part of that channel, and that is why this area deserves attention.
The key short-term level is 4,361 - 4,371. If gold can break and hold above this zone, it would show that the current bounce is not just a weak reaction from the lows. It would open the path back toward the bearish FVG around 4,430 - 4,455. This is the first real test for buyers.
For newer traders, the idea is simple: gold may recover in the short term, but that does not mean the full trend has turned bullish. When price is still below major supply, every rally must be tested carefully. A move into FVG or OB can become a rejection zone if sellers step back in.
My main view is bullish for a corrective recovery while gold stays above the 4,326 - 4,330 support area. This level matters because price is holding near the 100-day SMA, and buyers are trying to defend that base. If the market respects this support and breaks above 4,371, the next target becomes 4,430 - 4,455.
Above that, the bigger resistance is 4,480 - 4,515. This is marked as a Bearish OB / BSL Raid zone on the chart. If gold reaches that area, I would be very careful with late buying because sellers may use that liquidity to push price lower again.
The wider bullish recovery only becomes stronger if gold reclaims 4,505 and holds above it. Until then, I still treat this as a recovery move inside a larger bearish structure. The 200-day SMA around 4,540 also remains a major ceiling for the broader trend.
If gold fails to break 4,361 - 4,371 and loses 4,326, then the recovery idea becomes weak. In that case, price may return toward the lower part of the channel around 4,280 - 4,300, where buyers may try to react again.
Key Price Zones to Watch
Current reaction area: 4,340 - 4,350
First breakout resistance: 4,361 - 4,371
Main support / 100-day SMA area: 4,326 - 4,330
Bearish FVG / mitigation zone: 4,430 - 4,455
Bearish OB / BSL raid zone: 4,480 - 4,515
Major upper resistance / 200-day SMA area: 4,540 - 4,560
HTF Premium PD Array: 4,600 - 4,635
Lower demand if support fails: 4,280 - 4,300
Bullish confirmation: clean reclaim above 4,371
Stronger recovery confirmation: hold above 4,505
Invalidation: clean break and hold below 4,326
Do you think gold can reclaim 4,371 before the Fed decision, or does the market still need one more sweep lower before buyers step in?
Long 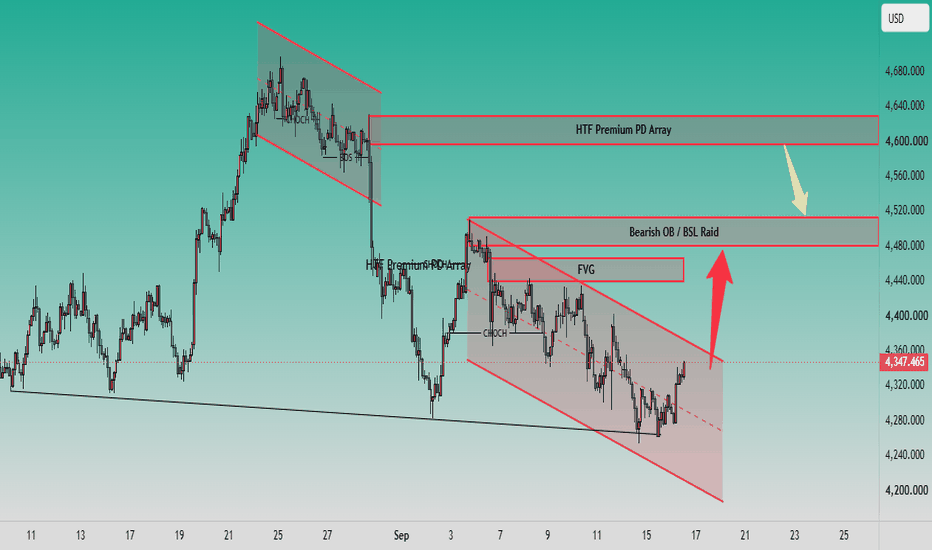
XAUUSD Market Structure Education | Trendline FVG & Liquidity This chart explains Gold price action through market structure, FVGs, liquidity, trendlines, support/resistance, and candle behavior. Each candle provides information about the balance between buyers and sellers, while groups of candles reveal the larger market intention.
1. Initial Accumulation — Buyer Preparation
At the beginning of the chart, price moves sideways with relatively small candles. These candles show indecision and accumulation, as neither buyers nor sellers have complete control.
Repeated lower wicks show that sellers are attempting to push price lower, but buyers are absorbing the selling pressure. The reason for the later bullish move is visible here: price repeatedly holds the lower area instead of breaking down.
2. Bullish Expansion — Strong Buyer Control
Once buyers gain control, consecutive bullish candles begin forming higher highs and higher lows. The larger bullish candle bodies indicate strong buying momentum.
The rapid upward movement creates displacement and leaves several Fair Value Gaps (FVGs) behind. These gaps represent areas where price moved quickly and may later return for rebalancing.
3. Break of Structure — Trend Confirmation
As price breaks above previous swing highs, the candles confirm a Bullish Break of Structure (BOS).
The reason behind this move is the successful removal of previous resistance and increased demand. Pullback candles remain relatively controlled, showing that sellers are unable to create a meaningful reversal.
4. Strong Rally Toward the Swing High
The next sequence contains multiple bullish candles with higher closes. Each successful close above the previous candle's high confirms continued buyer strength.
Small bearish candles during this rally represent temporary profit-taking rather than immediate reversal because buyers continue to defend the previous structure.
5. Swing High Formation — Selling Pressure Appears
Near the major swing high, bullish candles become smaller and upper wicks become more visible. This behavior indicates that buying momentum is weakening.
The rejection from the upper area suggests that sellers are becoming active around premium pricing. This is the first important warning that the bullish expansion may enter a correction.
6. Bearish Reversal — Change in Momentum
After the swing high, stronger bearish candles appear. These candles push price below previous short-term support levels.
The reason for the decline is a shift in order flow: sellers begin producing lower highs and lower lows. The descending trendline then acts as dynamic resistance and reinforces the bearish structure.
7. Corrective Decline — Lower Highs and Lower Lows
During the downward phase, candles repeatedly fail near the descending trendline. Upper-wick rejections show sellers defending that area.
Each lower high provides confirmation that the correction is still active. Bearish displacement also creates additional imbalance/FVG areas that can become reaction zones.
8. Demand Reaction — Buyers Defend Support
When price approaches the lower structural area, bearish candles begin losing momentum. Long lower wicks show rejection from the downside.
This reaction indicates that buyers are defending the 4,228 area, which is marked as the swing low of structure. The candles here are important because a strong break below this level would change the structure significantly.
9. Current Consolidation — Market Decision Zone
The latest candles are moving inside a relatively narrow range beneath the descending trendline. This represents a decision area between buyers attempting recovery and sellers defending resistance.
The current price around 4,293 is positioned between the key support at 4,228 and resistance around 4,359–4,448.
10. Bullish Scenario
If bullish candles break and close above the descending trendline and then reclaim 4,359, the structure can strengthen toward 4,448.
A confirmed breakout above 4,448 would increase the probability of a move toward 4,630, followed by the higher liquidity area around 4,799.
11. Bearish Scenario
If price continues producing rejection candles from the descending trendline and breaks below 4,228, sellers may regain control.
A confirmed breakdown can expose the next structural area around 4,156, where the lower FVG/demand zones may provide another reaction.
Educational Takeaway
The important lesson from these candles is that one candle should not be analyzed in isolation. The reason behind a candle becomes clearer when it is combined with:
Candle body & wick → buying/selling pressure
BOS → structure confirmation
FVG → price imbalance
Trendline → dynamic resistance/support
Swing high → liquidity and rejection area
Swing low → structural protection
4,448 → key breakout confirmation
4,228 → key structural support
4,156 → lower demand/target area
This is an educational market-structure study, showing how candle behavior, liquidity and FVGs can be combined to understand Gold price action rather than relying on a single indicator or candle. Long 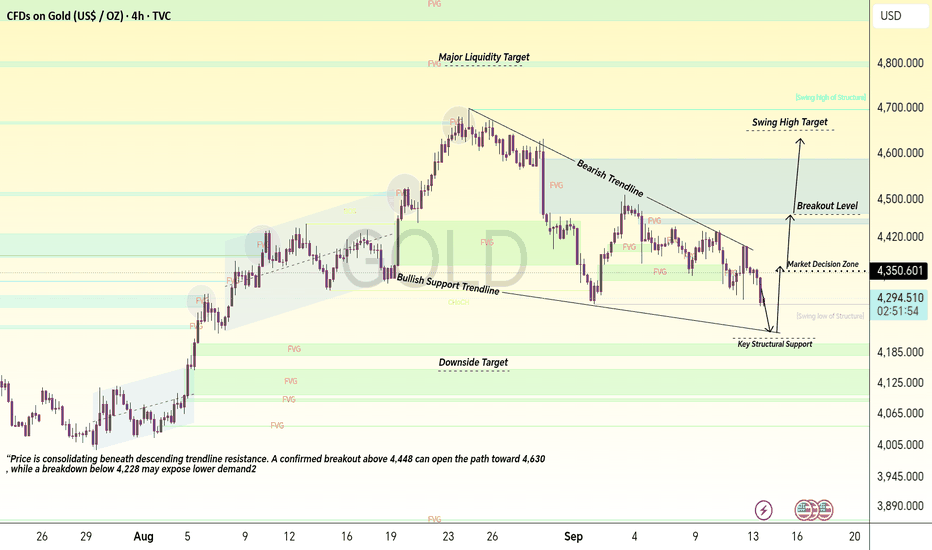
Education 
Short 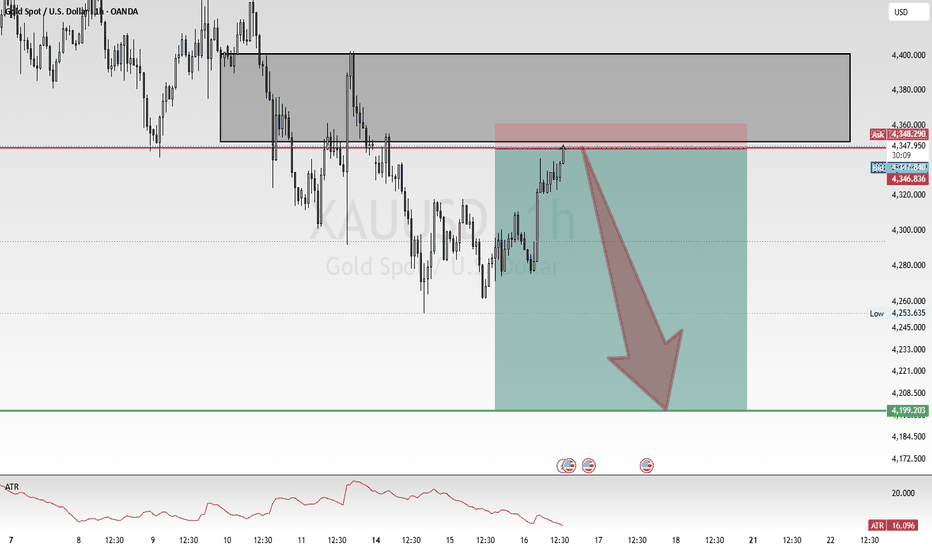
Asian Session Sweep & Institutional Structure"Retail chases green candles at the highs; Smart Money waits for liquidity sweeps and structural mitigation before taking action."
Following yesterday's strong bullish expansion, Gold (XAUUSD) pushed higher through the Asian session, testing key multi-week highs near the $4,340 – $4,350 zone. Driven by falling Treasury yields and a softening US Dollar, the macro backdrop favors bullion, but technical price action is now testing Premium Supply and consolidating around mid-range equilibrium.
📊 1. Top-Down Technical Breakdown (H1 Structure)
Market State: Bullish Expansion / Intraday Range Digestion.
Key Observations: After sweeping liquidity below, price impulsed upward, breaking internal structure and printing a structural shift. It is now re-mitigating mid-range equilibrium around $4,335 – $4,345.
Institutional Insight: Avoid chasing breakouts mid-range. Wait for a clean reaction at the outer structural borders (Premium Supply or Discount Demand).
🎯 Actionable Trading Plan (XAUUSD H1)
🟢 Plan A: Bullish Re-Mitigation (Primary Strategy)
Market Thesis: A controlled intraday pullback to re-mitigate lower demand/FVG before continuing higher to sweep liquidity.
Entry Zone: $4,260.00 – $4,280.00 (Discount Demand / Support Floor)
Stop Loss: $4,248.00 (Below recent swing low)
Take Profit 1 (TP1): $4,310.00 (Intraday Pivot)
Take Profit 2 (TP2): $4,345.00 (Current Range High / Equilibrium)
Take Profit 3 (TP3): $4,400.00 (Major Premium Supply Ceiling)
🔴 Plan B: Supply Rejection & Scalp (Alternative Strategy)
Market Thesis: Rejection off current premium highs leading to a corrective pullback toward range support.
Entry Zone: $4,400.00 – $4,420.00 (Premium Supply)
Stop Loss: $4,435.00 (Above local structural high)
Take Profit 1 (TP1): $4,345.00 (Mid-Range Equilibrium)
Take Profit 2 (TP2): $4,280.00 (Discount Support)
💡 Execution Rule: Wait for lower-timeframe confirmation (M15/M5 CHoCH or rejection wicks) inside your zones before pulling the trigger. Risk management first!  Long
Long
Long 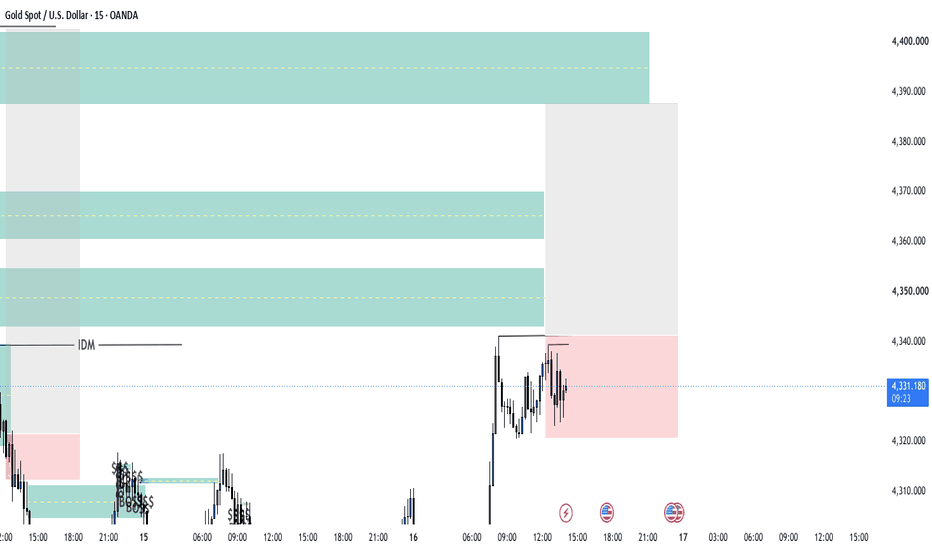
XAUUSD — Sell the H1 Fibonacci RetestFundamental Analysis
Gold remains under pressure ahead of the September 15–16 Fed meeting. Markets are pricing roughly a 92% probability of a 25 bp rate hike, while a firmer U.S. dollar and rising Treasury yields continue to raise the opportunity cost of holding gold.
The macro backdrop is also being complicated by oil prices above $100 and renewed Middle East supply concerns. U.S. Treasury yields have pushed to fresh multi-year highs, with the 10-year recently moving above 5%, reinforcing the higher-for-longer pressure on precious metals.
Technical Analysis
On the H1 chart, XAUUSD is trading near 4,277 after rebounding from the 4,253.64 low but failing to establish a sustained bullish structure.
Price remains below the broader bearish structure, while the latest Fibonacci retracement identifies 4,293–4,305 as the most attractive short-term sell area. This zone combines the 0.618–0.786 retracement, previous structure, and nearby H1 imbalance.
A deeper recovery could test 4,318, but acceptance above that level would weaken the immediate bearish setup.
If sellers defend the Fibonacci zone, price may rotate back toward 4,278, followed by 4,268–4,270 and eventually the 4,253–4,255 liquidity low.
Important Key Levels
4,378–4,390 — Major H1 FVG
4,305–4,318 — Upper resistance
4,293–4,305 — Main sell zone
4,278 — First downside pivot
4,268–4,270 — Lower demand
4,253–4,255 — Main liquidity target
Trading Scenario
Main Sell Setup
Entry: 4,293–4,305
Stop Loss: 4,322
Take Profit 1: 4,278
Take Profit 2: 4,268–4,270
Take Profit 3: 4,253–4,255
Sell Condition
Wait for price to retrace into 4,293–4,305 and show bearish confirmation. A rejection wick, bearish engulfing candle, failed reclaim above 4,305, or H1 close back below 4,293 may confirm renewed seller pressure.
A sustained break above 4,318–4,322 would invalidate the immediate sell idea.
Overall View
The H1 bias remains bearish while XAUUSD trades below 4,318. With price already near lower support, chasing shorts around 4,277 offers poor positioning. The preferred plan is to wait for a corrective rebound into 4,293–4,305, then look for confirmation toward 4,278, 4,268, and potentially a retest of the 4,253 liquidity low.
The Fed decision is now the main volatility risk, and the tone of the policy statement may be as important as the expected rate hike itself.
Do you expect gold to retest 4,293–4,305 before sellers attack 4,253 again? Short 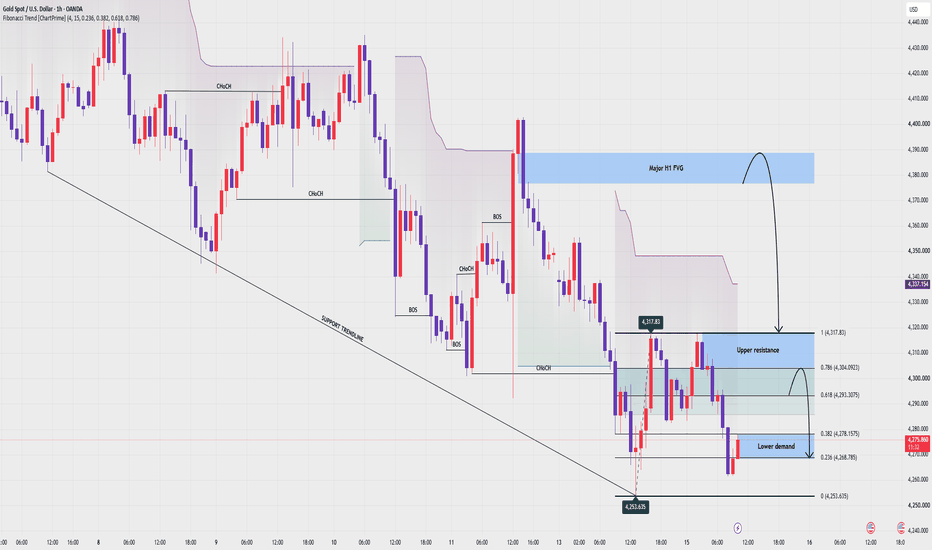
Long 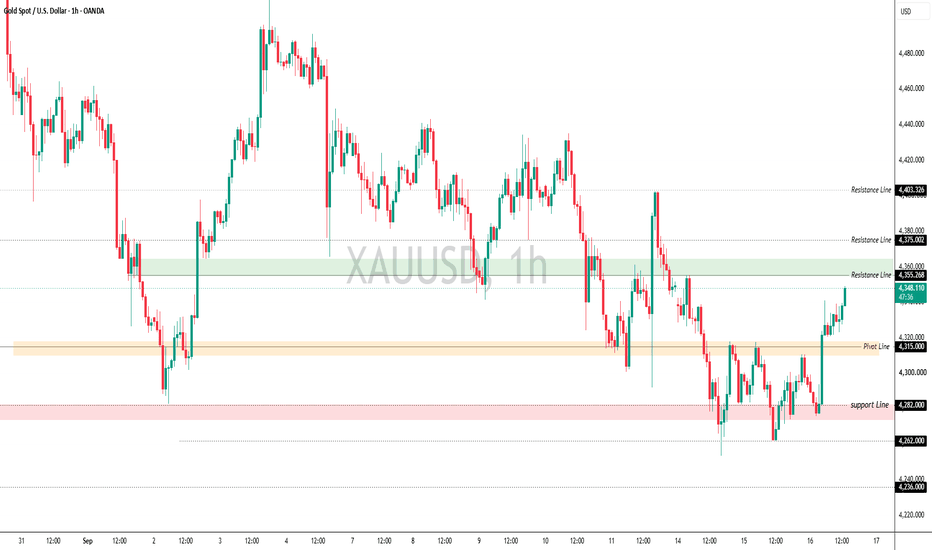
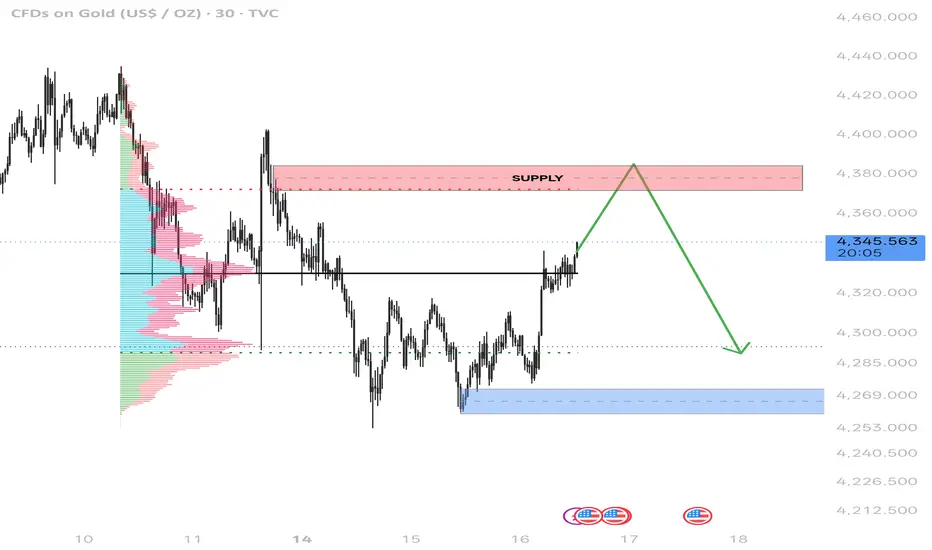
Bearish reversal at the VAHGold is currently reclaiming the 4,330–4,340 area, but the main resistance remains the 4,370–4,385 supply zone. My scenario is for price to continue higher into that supply, where I’ll watch for rejection/absorption and failed acceptance above value.
If sellers defend the zone, the downside target is the 4,290 area, with the deeper demand around 4,258–4,270. A clean acceptance above 4,385 would invalidate this bearish-reversion scenario XAU/USD: Sell on rallies!Gold prices edged higher on Wednesday, currently trading near $4,340. The Federal Reserve is expected to raise interest rates by 25 basis points at this meeting; market focus has shifted to updated economic projections (including the "dot plot") and the press conference by Chair Kevin Warsh. Risks of energy-driven inflation support expectations for further Fed tightening, a global bond sell-off has pushed the 10-year US Treasury yield above 5% (a high since 2007), and escalating tensions in the Middle East are bolstering the US Dollar Index—factors that may limit gold's gains.
Technically, gold has peaked and pulled back on the daily chart, falling below the 20-day moving average (MA20); the short-term bullish structure has been compromised. The MACD bullish histogram is contracting, indicating some release of bearish momentum, though a one-sided downtrend has not yet formed. The RSI has retreated to the neutral zone without entering deeply oversold territory, leaving room for a potential correction of the recent decline. On the four-hour chart, bulls and bears are locked in a tug-of-war; heavy selling pressure follows rebounds, and bullish counter-attacks lack sufficient strength, leaving the market in a state of fluctuation as it seeks a support base. For the New York session, the key level to watch is $4,350; failure to break above this level could trigger a bearish counter-attack, whereas stabilizing above $4,350 would lead to a test of the $4,402 resistance. On the downside, watch for support at $4,300, $4,280, and $4,255.
Overall Analysis: The primary recommendation is to sell on rallies.
My recommendations:
SELL: 4338-4345
SELL: 4387-4395
BUY: 4303-4294
BUY: 4257-4262 Short 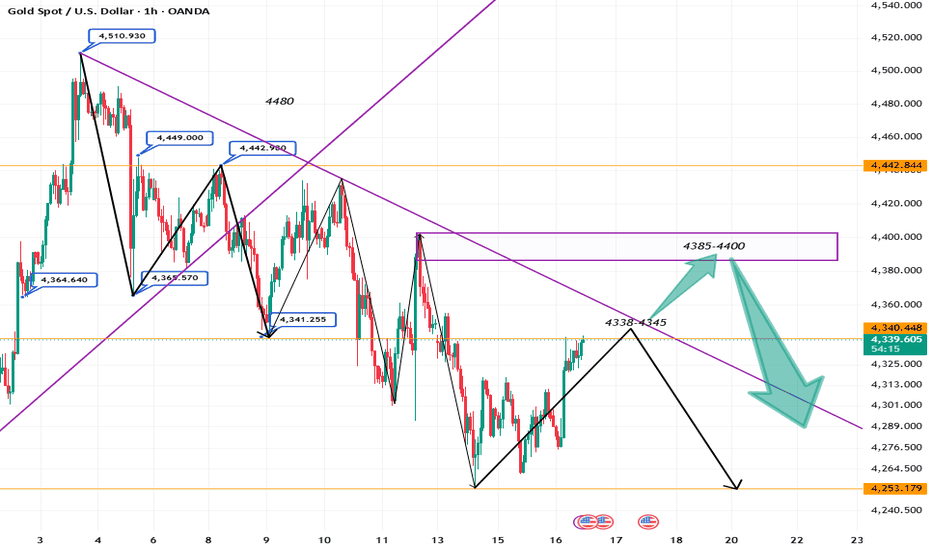
Excellent Profits past #2-session horizon on SellsAs discussed throughout my Monday's session commentary: 'Technical analysis: Gold is showcasing underlying Bearish trend (Intra-day basis of course) and is comfortably Trading below #4,302.80 psychological barrier throughout the session (Xau-Usd Spot prices as always in my focus). The pullback can extend as High as the Resistance (former Support now turned to Resistance) on Hourly 1 chart which is currently seen Trading at #4,308.80 and #4,315.80 and in case it gets invalidated, I do expect #4,327.80 test in extension before new Short-term Buyers appear. The real market news should soon enough be digested by market and due Monday's session (usually Monday's sessions brings fake-outs to trap as more Traders as possible), current session most likely won’t reveal any clues since rarely such sessions offer any Short-term conclusions. If #4,282.80 Support fails to hold, #4,257.80 - #4,262.80 is the next Support zone to be filled and expect a Lower High’s Upper zone to be met there, re-Buy zone if #4,252.80 benchmark / possible Double Bottom holds. Even though current sequence can be distinguished as an Buying opportunity, however I will not any more wild bets on the markets since know reasons and Gold can continue the decline as well towards Lower values (has decent chances). Also on the contrary, Gold is bound to give one more Lower High's before the Bullish Medium-term trend resumes. As DX is on decent recovery and Bond Yields still Trading above the Resistance zone, I am expecting further downside momentum to continue throughout the session. Gold has time to fall until October #5, that is when new Bullish Medium-term trend starts.'
My position: Gold has delivered excellent re-Sell opportunities throughout past #2-session horizon and if you took my advice (as you can see above), you would be in excellent Profits as I am, re-Selling both sessions especially Gap on Tuesday's Asian session opening (#4,302.80 - #4,282.80). Yesterday's session was a bit slower than Monday's one however still #5 out of #5 re-Sells ended up in decent Profits (already near my weekly Profit Target quota as I was last week in this time). The Price-action swings currently inside a #4,327.80 - #4,342.80 soft Rectangle on Hourly 4 chart and comprehensibly Neutral values across all Hourly and Minute charts. I am uninterested on the extra Risk involving Trading outside my breakout points as current session might deliver aggressive spikes on both sides without major break-out due FOMC later on throughout the session. If you decide to Trade today, Buy Gold as long as we are above #4,327.80 Support for the fractal. I will take it easy throughout the session, monitoring how Gold will digest the news. Long 
Excellent Profits past #2-session horizon on SellsAs discussed throughout my Monday's session commentary: 'Technical analysis: Gold is showcasing underlying Bearish trend (Intra-day basis of course) and is comfortably Trading below #4,302.80 psychological barrier throughout the session (Xau-Usd Spot prices as always in my focus). The pullback can extend as High as the Resistance (former Support now turned to Resistance) on Hourly 1 chart which is currently seen Trading at #4,308.80 and #4,315.80 and in case it gets invalidated, I do expect #4,327.80 test in extension before new Short-term Buyers appear. The real market news should soon enough be digested by market and due Monday's session (usually Monday's sessions brings fake-outs to trap as more Traders as possible), current session most likely won’t reveal any clues since rarely such sessions offer any Short-term conclusions. If #4,282.80 Support fails to hold, #4,257.80 - #4,262.80 is the next Support zone to be filled and expect a Lower High’s Upper zone to be met there, re-Buy zone if #4,252.80 benchmark / possible Double Bottom holds. Even though current sequence can be distinguished as an Buying opportunity, however I will not any more wild bets on the markets since know reasons and Gold can continue the decline as well towards Lower values (has decent chances). Also on the contrary, Gold is bound to give one more Lower High's before the Bullish Medium-term trend resumes. As DX is on decent recovery and Bond Yields still Trading above the Resistance zone, I am expecting further downside momentum to continue throughout the session. Gold has time to fall until October #5, that is when new Bullish Medium-term trend starts.'
My position: Gold has delivered excellent re-Sell opportunities throughout past #2-session horizon and if you took my advice (as you can see above), you would be in excellent Profits as I am, re-Selling both sessions especially Gap on Tuesday's Asian session opening (#4,302.80 - #4,282.80). Yesterday's session was a bit slower than Monday's one however still #5 out of #5 re-Sells ended up in decent Profits (already near my weekly Profit Target quota as I was last week in this time). The Price-action swings currently inside a #4,327.80 - #4,342.80 soft Rectangle on Hourly 4 chart and comprehensibly Neutral values across all Hourly and Minute charts. I am uninterested on the extra Risk involving Trading outside my breakout points as current session might deliver aggressive spikes on both sides without major break-out due FOMC later on throughout the session. If you decide to Trade today, Buy Gold as long as we are above #4,327.80 Support for the fractal. I will take it easy throughout the session, monitoring how Gold will digest the news. Short 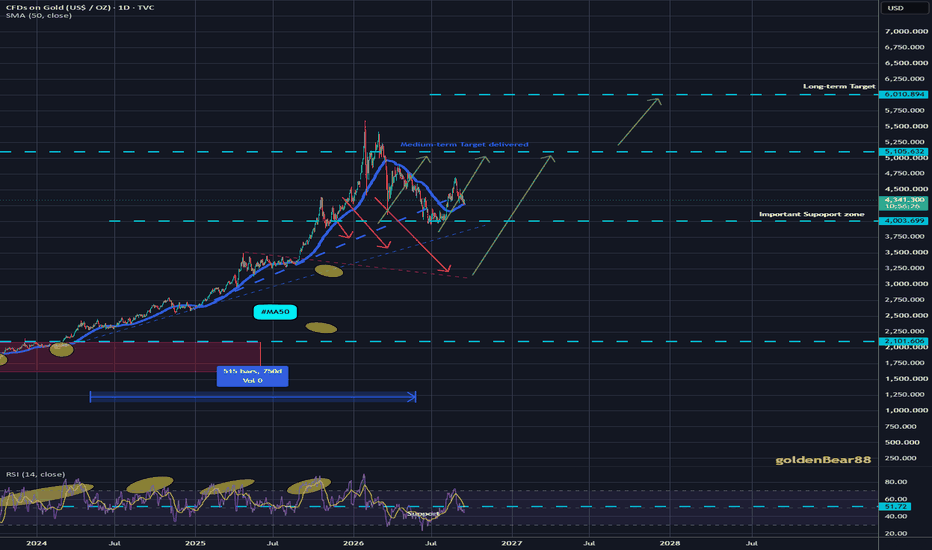
XAU/USD: THE $4,335 BREAKOUT RETEST & $4,420 EXPANSION! 🚀
Testing trendline flip demand near 4,338.925! Are you panic-selling this shallow pullback into new structural support, or locked in for the multi-wave expansion surge to the macro resistance line? 🤔
Gold has executed a clean breakout above its inner descending Resistance line on this 1-hour OANDA chart. Spot gold is trading around 4,338.925, coming back down to retest the broken trendline boundary and green demand block near $4,330.00 - $4,335.00 as newly established support. Institutional buyers are stepping in along this key flip zone to absorb short-seller liquidity and launch the next multi-wave expansion leg up toward the upper macro Resistance line. 📈💥
Look closely at the black blueprint trajectory mapping out the coming sessions. The algorithm projects a textbook multi-wave retest, validation, and expansion sequence:
• A localized retest dipping into the green support block around $4,330.00 - $4,335.00 to sweep shallow retail stops and validate broken trendline support. ⚡
• An initial impulse rebound off the green zone driving price up to test $4,350.00 - $4,355.00. 🧱
• A healthy higher-low pullback dipping back toward $4,345.00 to solidify structure and absorb remaining sell liquidity. 🌊
• A secondary expansion wave surging through intermediate hurdles to reach the $4,385.00 region. 🧱
• A minor consolidation retest dipping back to $4,375.00 to lock in secondary launchpad support. ⚡
• Final acceleration surge driving straight up to target the macro overhead descending Resistance line ceiling near 4,415.000 - 4,420.000. 🎯🏹
Maintaining technical patience and aligning with confirmed trendline breakouts is your ultimate superpower in this setup. Trying to short directly into a broken-resistance-turned-support zone while price builds a higher-low base is a fast track to getting caught on the wrong side of an aggressive breakout squeeze. Smart money is using this retest into the green demand zone to build long position blocks before driving price up to the macro ceiling. 🧘♂️⚡
🛠 Trade Parameters:
🛒 Long Zone: 4,330.00 - 4,340.00 🛍️
🛑 Stop-Loss: 1h close below 4,310.00 ❌
💰 Take-Profit: 4,418.00 🎯
The retail bears attempting to short into this broken trendline retest are about to get caught offside as institutional buy volume takes total control. Stay focused, strictly manage your risk, and let the algorithm carry the trade up to our target.
Maintain your composure through the waves, and we will see you up at the 4,418 resistance target ceiling! 🚀💎 Long 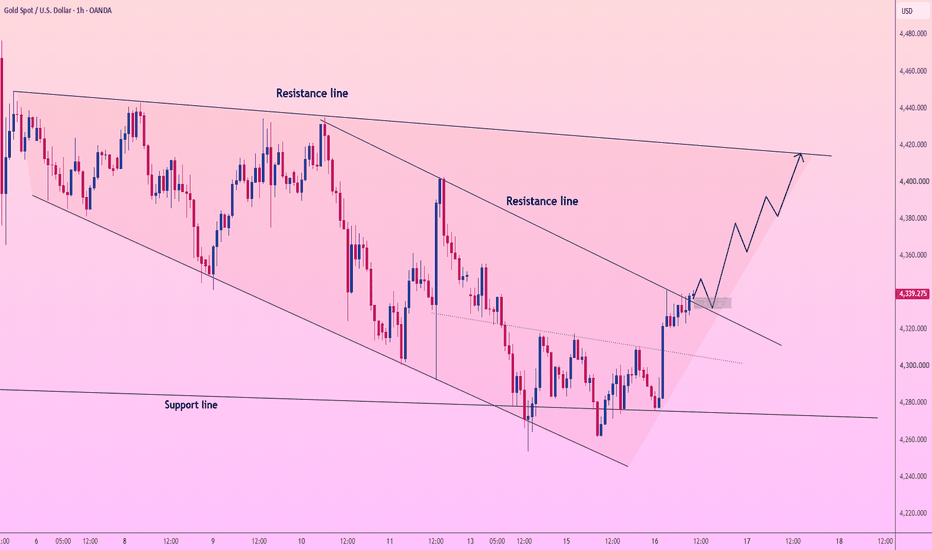
 Short
Short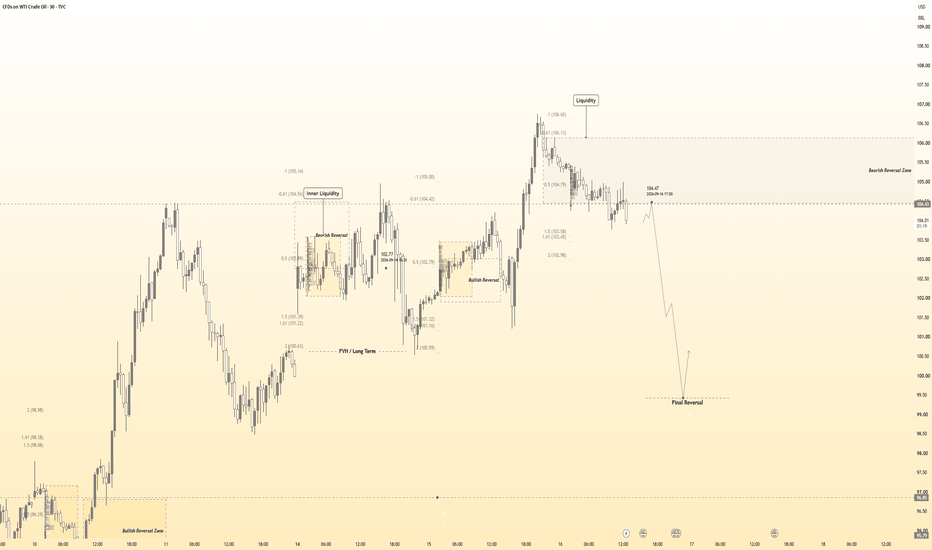
Gold 1H: Bounce Off Zone Buy Eyes Target 1 NextGold has bottomed out at a key demand area and is now working its way back up — and this chart offers a clean look at how SMC structure guides that recovery step by step.
The decline began after gold rejected from the Resistance Zone, dropping through a Demand Zone near 4,395–4,430. That zone showed some internal activity — a CHoCH along with EQH/EQL liquidity pockets — before ultimately failing and sending price lower. From there, gold broke down further, eventually landing in the Zone Buy around 4,257–4,281.
This is where the story turns. Price found support at that zone, confirmed by a fresh CHoCH, and buyers started stepping back in. Since then, gold has built a small recovery, forming an EQH liquidity pocket just above the lows — often a sign that price is gathering strength before pushing higher.
Currently trading around 4,336, gold is now working toward what's marked on the chart as Target 1, sitting near 4,400–4,420 — notably the same area as the old Demand Zone that failed earlier. Revisiting a former demand zone from below often turns it into resistance first, so some hesitation there wouldn't be surprising.
If gold clears Target 1 with conviction, the next logical objective becomes a retest of the Strong High near 4,510 — essentially retracing the full recent decline.
The risk to this recovery is straightforward: a break back down below the Zone Buy (under 4,257) would suggest the bounce has failed and reopen the door to further downside.
For beginners: notice how a broken support zone (the old Demand Zone) often becomes resistance once price approaches it again from below — that flip is one of the most practical SMC concepts to watch for.
💬 Do you think gold clears Target 1 and pushes on toward the Strong High, or does the old Demand Zone hold it back first? Long 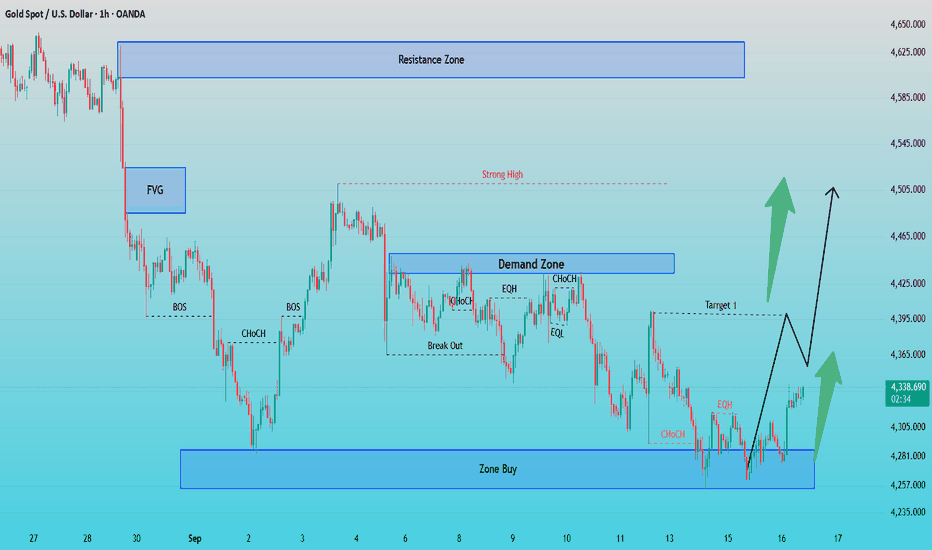
Long 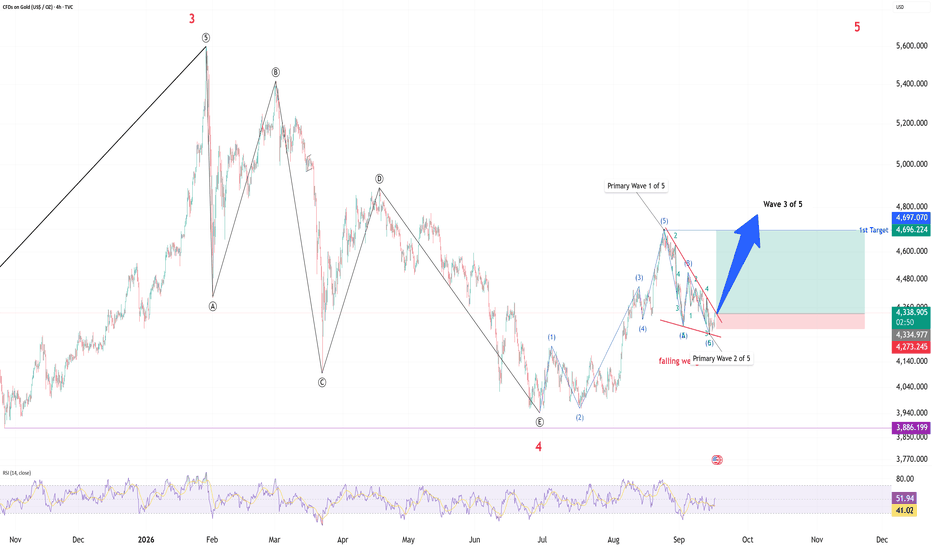
XAUUSD | TRADING PLAN H1 16/09/2026✅ XAUUSD/H1
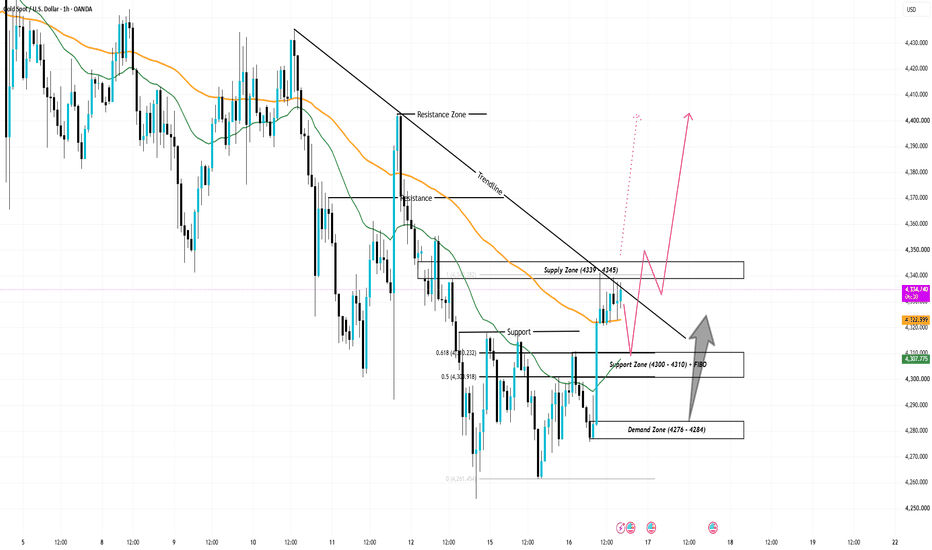
Gold is currently recovering after bouncing from the 427x Support area. However, price is approaching and reacting around the Supply Zone (4339 - 4345), while also facing the descending trendline. Therefore, we need to wait for a clear reaction around this price area before setting up a trade.
1. BUY SCENARIO
- Price is currently consolidating in a sideways range after the strong bullish move. If buying momentum continues and price breaks out of the Supply Zone (4339 - 4345) while also breaking the descending trendline, a continuation buy setup could target 437x - 440x.
- If price fails to break out of the Supply Zone (4339 - 4345) and pulls back to the Support Zone (4300 - 4310) + FIBO, but fails to break below it and buying pressure returns, a continuation buy setup could target 432x → Supply Zone (4339 - 4345) → 440x.
- If the Support Zone (4300 - 4310) breaks down, the next area to watch is the Demand Zone (4276 - 4284).
2. SELL SCENARIO
- If price approaches the Supply Zone (4339 - 4345) and shows rejection, a short-term sell setup could be considered toward the current sideways range. However, caution is needed because of the strong bullish move; it is safer to wait for clearer confirmation before entering.
- If price breaks out and closes a candle below the Support (4322 - 4325), a short-term sell setup could target the Support Zone (4300 - 4310).
🔴 KEY LEVELS
Supply Zone (4339 - 4345)
Resistance 437x
Resistance Zone (4400 - 4410)
Support 432x
Support Zone (4300 - 4310) + FIBO + EMA
Demand Zone (4276 - 4284) Long