Short
Short
XAUUSD 4H | Institutional Price Action & Liquidity StructureXAUUSD 4H | Institutional Price Action & Liquidity Structure
This 4H Gold chart presents a detailed educational analysis of candle-by-candle price action, market structure, liquidity, Fair Value Gaps (FVG), BOS, CHoCH, EQH/EQL, supply, demand and key reaction levels.
The objective of this analysis is to understand not only where price moved, but why each candle sequence produced a particular reaction and how the reaction developed into the next market-structure phase.
Initial Accumulation & Liquidity Formation
At the beginning of the chart, Gold trades around the 4,000–4,100 region.
The early candles are relatively small and mixed, showing that neither buyers nor sellers have complete control. Repeated candles form around similar highs and lows, creating EQL/EQH liquidity.
The candles with lower wicks indicate that sellers are attempting to push price lower, but buyers repeatedly absorb that selling pressure.
When a candle closes back above the previous candle's range, it shows that the downside move is losing momentum.
This explains why the lower region becomes an important demand and liquidity area.
Bullish Displacement
After liquidity develops below the previous lows, Gold produces a sequence of stronger bullish candles.
The larger bullish bodies show aggressive buying pressure.
The reason these candles are important is that they do not simply move higher—they begin breaking previous short-term highs.
This creates the first meaningful BOS, confirming that bullish order flow is becoming stronger.
Small bearish candles appearing between the bullish candles represent temporary pullbacks rather than immediate trend reversal because price continues to hold higher lows.
FVG Formation
The strong bullish displacement creates several Bullish FVGs.
These gaps/imbalances are produced because price moves rapidly through an area without significant two-sided trading.
The following candles provide an important educational lesson: price does not necessarily return immediately to every FVG.
Some imbalances remain open while price continues expanding.
Therefore, an FVG should be treated as a potential reaction area, not an automatic entry signal.
Mid-Range Consolidation
As Gold approaches the 4,300–4,400 region, candle bodies become smaller.
Several candles alternate between bullish and bearish closes.
This indicates temporary consolidation and a balance between buyers and sellers.
The repeated reactions around the same area create additional liquidity.
When price briefly breaks a previous high and then closes back inside the range, the wick shows rejection and possible liquidity collection.
Strong Bullish Expansion
Around the middle of the chart, Gold begins producing consecutive bullish candles with stronger bodies.
The reason for this expansion is visible through the structure: buyers successfully push price above previous reaction highs.
The sequence becomes:
Higher Low → Bullish Displacement → BOS → Higher High
The candles with small upper wicks demonstrate that buyers are maintaining control into the close.
This is stronger evidence than a single bullish candle because multiple candles confirm continuation.
Major High & Rejection
Gold eventually reaches the upper 4,600–4,700 region.
Here, candle behavior changes.
Instead of continuous large bullish bodies, several candles begin showing upper wicks and smaller bodies.
The reason is that buyers are still attempting to move higher, but sellers begin responding aggressively around the major resistance/supply area.
The 4,700 region therefore becomes an important Major Swing High.
The visible weak-high structure also indicates that liquidity has developed around the previous high.
CHoCH & Bearish Displacement
After the high is established, Gold begins printing weaker candles followed by stronger bearish candles.
The first bearish candles alone do not confirm a full reversal.
However, when price breaks an important previous higher-low structure, the move becomes more significant.
This creates the CHoCH/MSS-type transition visible on the chart.
The following bearish candles increase in size, showing that sellers are gaining momentum.
This is important because the market is transitioning from bullish expansion into bearish correction.
BOS & Downside Expansion
The next bearish displacement breaks important structural levels.
The strong bearish candle is significant because it closes below the previous support rather than merely creating a wick.
That confirms a bearish BOS.
The following candles attempt small bullish retracements, but sellers continue to defend the lower highs.
This creates:
Lower High → Bearish Displacement → BOS → Lower Low
The bearish candles also leave behind an FVG, showing inefficient downside movement.
Reaction Around 4,286
Gold eventually reaches the 4,286.854 area.
This level is important because it corresponds with a previous structural swing-low region and the blue demand/FVG area.
The candles approaching this level become increasingly important.
When bearish candles begin developing longer lower wicks, it indicates that sellers are pushing price lower but buyers are absorbing supply.
A strong bullish reaction from this area would provide evidence that demand is returning.
Bullish Recovery From Support
After reaching the lower support region, Gold produces bullish candles.
The first bullish candle represents an initial reaction.
The following candles are more important because they begin closing progressively higher.
A sequence of higher highs and higher lows indicates that the recovery is gaining structure.
The bullish candles also begin reclaiming previous short-term resistance levels.
This is why the recovery should be monitored for a potential MSS/CHoCH confirmation rather than relying on one candle alone.
4,400–4,450 Decision Zone
Gold then moves back toward the 4,400–4,450 region.
Here, the candles again become mixed.
Some bullish candles push upward, while bearish candles immediately reject higher prices.
This demonstrates a decision zone where buyers are attempting continuation but sellers are defending the upper area.
The FVG around this region becomes important because price is interacting with an earlier imbalance.
A clean bullish close above the zone would provide stronger continuation evidence.
Repeated upper-wick rejection would instead suggest another corrective move.
Recent Bearish Pullback
The recent candles show another short-term bearish reaction.
Price repeatedly tests the upper region but fails to maintain higher closes.
The bearish candles push price back toward the 4,286.854 support.
However, the important point is that the market has not yet produced a decisive breakdown of the major lower structure.
Therefore, this move should be treated as a potential retracement until stronger confirmation appears.
Current Price — 4,347.760
The current price around 4,347.760 sits inside an important decision area.
The recent candles show two-sided order flow.
Bullish candles indicate attempts to recover the upper range, while bearish candles indicate sellers are still defending resistance.
The next candle closes are therefore important for determining whether Gold develops another bullish expansion or revisits lower support.
Key Bullish Scenario
The first major confirmation area is 4,440.629.
If Gold produces a strong 4H candle close above this level and follows through with additional bullish candles, it would strengthen the bullish continuation scenario.
The next important areas become:
4,512.218 → Key Resistance
4,604.758 → Major Resistance
4,700.000 → Major Swing High
A breakout should be evaluated using the candle close and follow-through, not simply a temporary wick above resistance.
Bearish Scenario
If price repeatedly rejects the upper resistance area and produces strong bearish displacement, attention returns toward 4,286.854.
A decisive bearish close below this support would weaken the current bullish recovery structure.
The next areas of interest would then be the lower 4,225.355 support and the deeper demand/FVG regions.
This demonstrates an important technical principle:
Support holding is not confirmation by itself; the reaction candle and subsequent structure provide the confirmation.
Complete Market Structure
The complete 4H sequence can be interpreted as:
Accumulation → Liquidity Formation → Bullish Displacement → BOS → FVG Formation → Bullish Expansion → Major High → CHoCH → Bearish Displacement → BOS → Demand Reaction → Bullish Recovery → Consolidation → Current Decision Zone
The most important educational lesson from this chart is that individual candles should never be analyzed in isolation.
Each candle gains meaning from:
Previous Candle → Wick Rejection → Candle Body → Closing Position → Liquidity → FVG → Swing Structure → BOS/CHoCH → Next Candle Confirmation
A single bullish candle does not guarantee continuation, and a single bearish candle does not guarantee reversal. The highest-quality analysis comes from combining candle behavior with market structure and liquidity.
Key Levels
4,700.000 — Major Swing High
4,604.758 — Major Resistance
4,512.218 — Key Resistance
4,440.629 — Key Decision Level
4,347.760 — Current Price
4,286.854 — Key Support / Swing Low
4,225.355 — Major Support
4,100–4,000 — Major Demand Region
Educational Disclaimer: This chart is strictly for educational and informational purposes and does not constitute financial, investment, or trading advice. Market conditions can change rapidly. No breakout, target, support, resistance, direction or market scenario is guaranteed. Always conduct your own analysis, wait for proper confirmation and apply appropriate risk management before making any trading decision.  Long
Long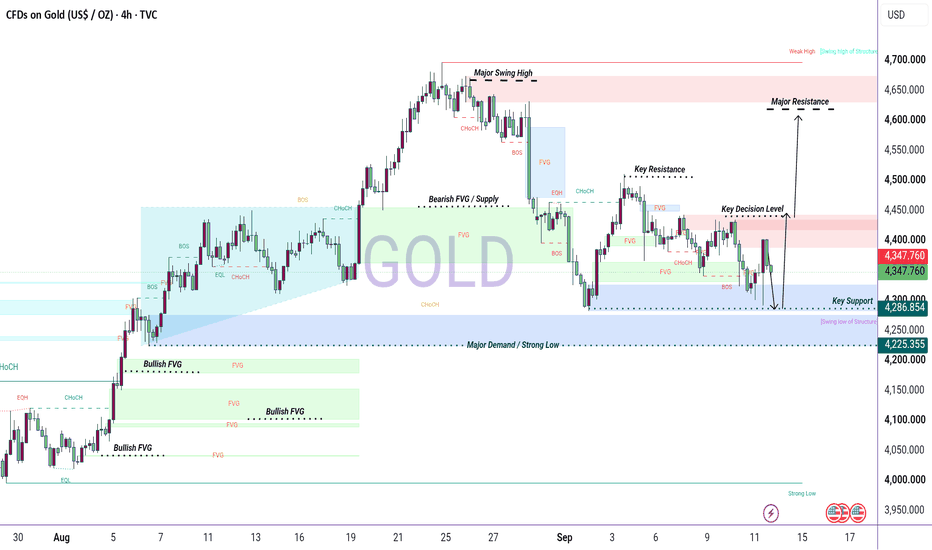
 Long
Long
Long 
XAUUSD – Gold Stays Heavy Below 4,328 XAUUSD – Gold Stays Heavy Below 4,328
Gold is still trading under pressure near 4,283 after failing to build any meaningful recovery from the recent lows.
The chart shows price moving inside a wider descending structure, with the short-term downtrend line still controlling the market. Buyers tried to react from the lower channel area, but the recovery remains weak while price stays below 4,318 – 4,328.
From the market side, gold is still facing pressure from stronger Fed rate expectations, elevated U.S. yields, and safe-haven demand for the U.S. dollar. Geopolitical risk may create short-term reactions, but for now it is not strong enough to change the bearish technical structure.
Technical view:
Gold is trading near the lower part of the descending channel.
The current reaction area is around 4,280 – 4,295.
The first resistance is 4,318 – 4,328.
As long as gold stays below this zone, sellers still have short-term control.
The next stronger resistance is around 4,368, where the downtrend line and Fibonacci structure meet.
A clean break above 4,368 would be needed to confirm a stronger recovery.
If gold fails to reclaim 4,318 – 4,328, price may retest the lower support area again.
Key levels to watch:
Current price: 4,283
Short-term reaction zone: 4,280 – 4,295
First resistance: 4,318 – 4,328
Strong resistance: 4,368
Lower channel support: 4,250 – 4,260
Bearish invalidation: above 4,368
Main scenario:
If gold holds above 4,280 and breaks back above 4,318 – 4,328, buyers may attempt a recovery toward 4,368.
However, this recovery still needs confirmation. A weak reaction below 4,328 may only be a corrective pullback before sellers return.
Alternative scenario:
If gold rejects from 4,318 – 4,328 and loses 4,280 again, the bearish pressure may continue.
In that case, price may retest 4,250 – 4,260, which is close to the lower channel support.
Hannah’s view:
Gold is still not showing a clean bullish reversal.
The market is trying to stabilize near support, but the recovery lacks strength while price remains below 4,328. For buyers, the first job is simple: reclaim 4,328 and hold above it. Without that, the downside risk remains open.
Main view: gold stays weak below 4,318 – 4,328. A rejection from this area supports another move toward 4,280 and possibly 4,250. A real recovery only becomes clearer above 4,368. No confirmation means no trade.
Do you think gold can reclaim 4,328, or will sellers keep control inside this downtrend channel?
Long 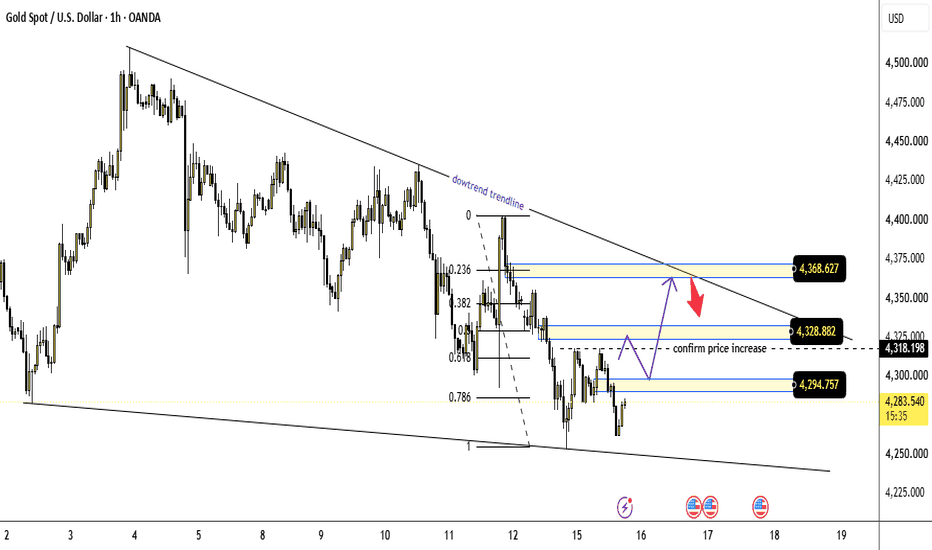
Long 
XAUUSD — Bearish Wave Toward 4,160
Gold is still moving inside a clear bearish channel after failing to break above the descending trendline. From Kelly’s view, the current chart suggests that XAUUSD remains under downside pressure, and the latest recovery may only be a short correction before another bearish Elliott Wave leg continues.
The key idea is simple: gold is trading below the FVG sell zone, and if buyers cannot reclaim this resistance, sellers may continue pushing price toward the lower support and final target area.
⟡ Market structure
Gold is currently trading around 4,283, still inside the descending channel. The short-term recovery is being capped below the 4,288–4,300 FVG sell zone, which is now the key resistance area.
The market is still forming lower highs, and price action remains weak below the trendline. If gold rejects from the sell zone again, the first downside area to watch is the strong support near 4,255–4,265.
A clean break below this support may open the next bearish move toward 4,225–4,235. If sellers keep control, the final Elliott Wave target remains around 4,155–4,165.
➤ Key levels
◌ Current price area: 4,283
◌ FVG sell zone: 4,288–4,300
◌ Short-term resistance: 4,300–4,320
◌ Strong support: 4,255–4,265
◌ Buy reaction zone: 4,225–4,235
◌ Main bearish target: 4,155–4,165
◌ Bearish invalidation: above 4,320
⌁ Elliott Wave view
The chart shows a possible bearish Elliott Wave continuation.
Wave (1) started after gold rejected from the upper channel area.
Wave (2) created a short corrective rebound into the FVG sell zone.
If price fails below 4,300, wave (3) may continue lower toward 4,225–4,235.
Wave (4) may create a small recovery from the lower reaction zone.
Wave (5) may complete the bearish structure near 4,155–4,165.
This is why Kelly is not chasing buys at the current price. The cleaner plan is to wait for price to reject the FVG sell zone or break below strong support with clear bearish momentum.
▸ Trading scenario
Preferred bearish scenario
Entry: Sell around 4,288–4,300 if price gives bearish rejection
Stop Loss: Above 4,320
Take Profit 1: 4,255–4,265
Take Profit 2: 4,225–4,235
Take Profit 3: 4,155–4,165
Alternative entry
If gold breaks below 4,255 and retests this level weakly, sellers may look for continuation toward 4,225–4,235 and then 4,155–4,165.
◌ Invalidation
The bearish view becomes weaker if gold breaks above 4,320 and holds above the descending trendline. In that case, the current bearish wave structure may be delayed, and price could attempt a stronger recovery first.
⌁ Kelly’s view
Kelly’s main view remains bearish while gold stays below the 4,288–4,300 FVG sell zone. The structure still favors selling rallies rather than chasing short-term rebounds.
If sellers defend the sell zone, gold may continue toward 4,255–4,265, then 4,225–4,235. The larger bearish target remains near 4,155–4,165 if wave (5) extends.
Do you think gold will reject from the FVG sell zone first, or break strong support directly? Short 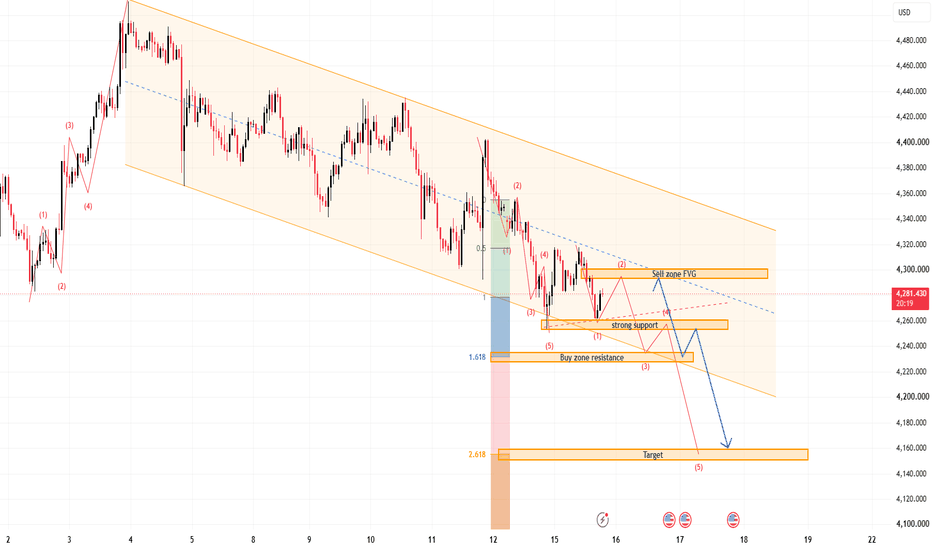
Long 
Long 
 Short
Short
Oil Fuels Rate Hike Bets — Dollar Stays Firm
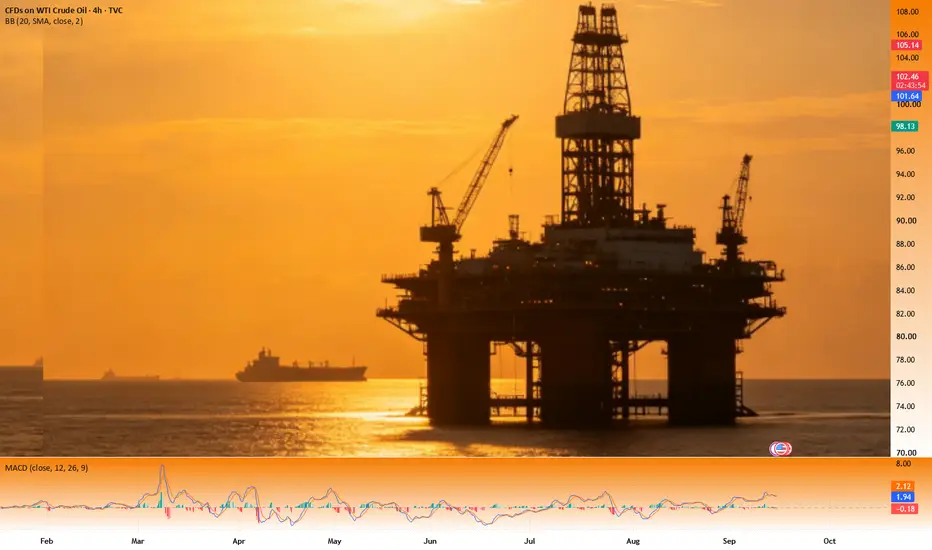
Oil prices held steady above $100, ignoring comments from Trump; expectations of a Federal Reserve rate hike intensified, raising the likelihood of disappointment at tomorrow's meeting; risk appetite waned, and the dollar's rally continued; gold prices remained under pressure.
Oil prices remain elevated, hovering in triple-digit territory, with the December WTI crude futures contract trading at $93. The recent surge in prices prompted a response overnight from U.S. President Trump. His remarks—suggesting the U.S.-Iran conflict would not last long (a stark contrast to last week's claim that it would drag on until the U.S. midterm elections in early November) and announcing that Russia and Ukraine had agreed not to attack oil facilities (a proposal that, according to the Ukrainian president, has yet to be approved)—appeared to cap the rally in oil prices.
However, these comments failed to drive prices down, as investors remained focused on the damaged Saudi Arabian oil pipeline—which could take weeks to fully resume operations following repeated attacks—and the fact that, despite months of deliberation, much of the Strait of Hormuz remains closed and littered with Iranian-laid mines.
Trump has grown increasingly anxious about oil prices as U.S. consumers begin to feel the sting of rising energy costs. Having won the 2024 presidential election by capitalizing on voter anger over runaway post-pandemic inflation, he now faces a similar—and potentially costly—problem. Losing a majority in either chamber of Congress (with the Senate being the focal point) would leave the administration severely hamstrung for the next two years.
With oil prices dampening risk appetite and U.S. stock index futures surrendering most of yesterday's gains, the dollar remained in demand after a strong start to the week. USD/JPY edged tentatively higher as investors positioned themselves for Friday's Bank of Japan meeting, while GBP/USD declined despite decent employment and income data released earlier in the day.
Notably, risk-sensitive currencies such as the New Zealand dollar and the Australian dollar underperformed. With a light U.S. data calendar today—and a 20-year Treasury auction (a less favored maturity on the yield curve) taking place—investors remain focused on tomorrow's Federal Reserve meeting. Markets have rapidly adjusted expectations: a 25-basis-point hike tomorrow (Wednesday) is fully priced in, with similar-sized hikes anticipated for December and March 2027. Although the repricing of Fed expectations has been aggressive, the outlook for the European Central Bank is even more hawkish; beyond last week's hike, markets anticipate nearly 70 basis points of cumulative tightening by March 2027.
That said, despite continued hawkish rhetoric from ECB officials, EUR/USD is trading lower today, testing support formed by yesterday's low of 1.1522 and the 50-day simple moving average (SMA). Should the Fed meet hawkish expectations tomorrow, the lower bound of the broad trading range established since June 2025 could face a retest.
Spot gold continues to decline—down nearly 9% from its late-August high—as it awaits the Fed meeting.
TVC:USOIL PURPLETRADING:USOIL IG:USOIL IG:USOIL XAUUSD: This Bounce Has a Job to Do Before I Trust ItGold is bouncing.
That does not mean Gold is bullish.
There is an important difference between price recovering from a low and the market actually changing direction. On the H1 chart, XAUUSD is currently showing the first one, but I do not see enough evidence for the second yet.
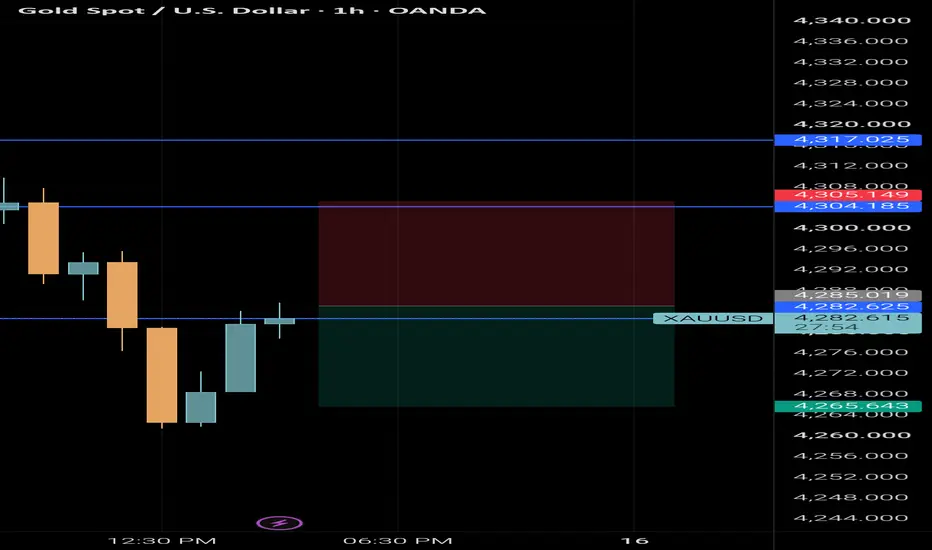
Price defended the 4,266 area and has recovered toward 4,310, but look at what is sitting above it: several Fibonacci retracement levels, the EMA cluster, and a descending structure that has been producing lower highs.
So instead of asking “How high can Gold bounce?”, I am asking a different question:
How far does Gold need to climb before this bounce becomes dangerous for sellers?
THE RECOVERY LADDER
I am treating the current rebound like a ladder.
The first step is 4,310–4,315.
Above that, buyers run into 4,328–4,345, where the 0.5 Fibonacci level and moving-average resistance begin to matter.
Then comes 4,368–4,375.
This is the area I care about most.
Why?
Because getting above 4,310 is only a recovery. Getting through 4,340 improves that recovery. But reclaiming and holding above 4,370 would begin to challenge the bearish H1 structure itself.
That distinction keeps me from buying too early.
🟢 THE BUY I WANT TO SEE
I am not interested in buying Gold just because it bounced from 4,266.
My bullish trade requires price to prove that this recovery has enough strength to survive the resistance sitting overhead.
I want an H1 close above 4,370, followed by a pullback that stays above approximately 4,360.
If that happens, the market has done something meaningful: it has pushed through the retracement resistance and recovered above an important part of the EMA structure.
BUY Entry: 4,362–4,372 after breakout and successful retest
Stop Loss: 4,342
TP1: 4,400
TP2: 4,430
TP3: 4,490–4,500
The final target is ambitious, but that is where the major resistance zone on the chart becomes relevant again.
No hold above 4,370, no reason for me to chase the bullish story.
🔴 WHERE I WOULD RATHER MEET THE SELLERS
The short side does not require Gold to collapse immediately.
In fact, a larger bounce could create the better trade.
If price climbs into 4,328–4,345 and produces a clear H1 rejection, I would treat that move as a failed recovery inside the broader descending structure.
That is where I would start looking for sellers to return.
SELL Entry: 4,330–4,345 after H1 bearish rejection
Stop Loss: 4,372
TP1: 4,300
TP2: 4,280
TP3: 4,266
And 4,266 is not just another target.
It is today's floor.
If Gold closes an H1 candle below 4,266, I would stop waiting for the larger retracement and switch to a breakdown setup.
A retest of 4,266–4,275 from below would become my second sell opportunity.
Breakdown SELL Entry: 4,266–4,275 after failed retest
Stop Loss: 4,292
TP1: 4,245
TP2: 4,225
ONE CHART, THREE DIFFERENT MARKETS
This is how I simplify the chart:
Below 4,266: bearish continuation territory.
Between 4,266 and 4,370: recovery territory, but sellers still have the structural advantage.
Above 4,370 and holding: buyers finally have something worth defending.
That is why I do not want to label Gold bullish or bearish based on one green candle.
Right now, buyers are climbing the ladder.
The question is whether they reach the top—or give sellers a better place to push them back down.
Which comes first from here: 4,370 or another test of 4,266? Short 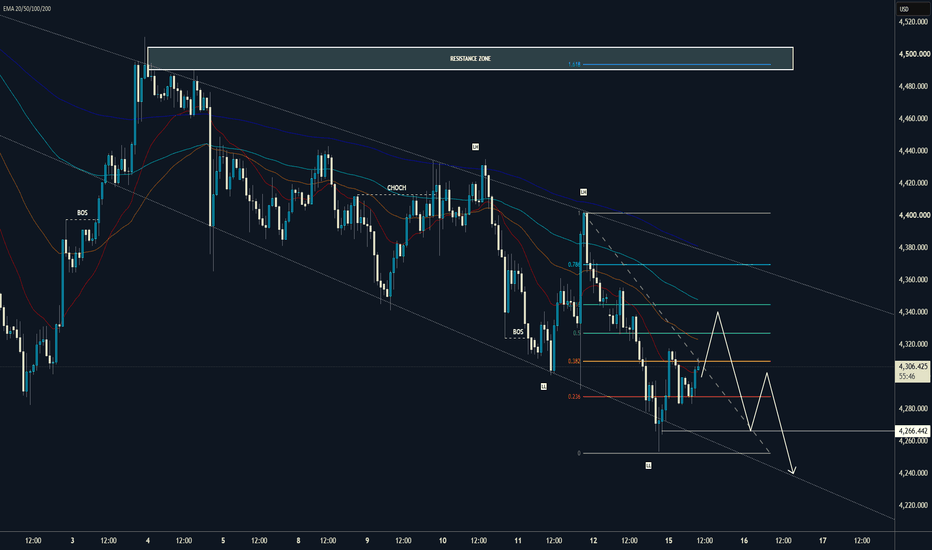
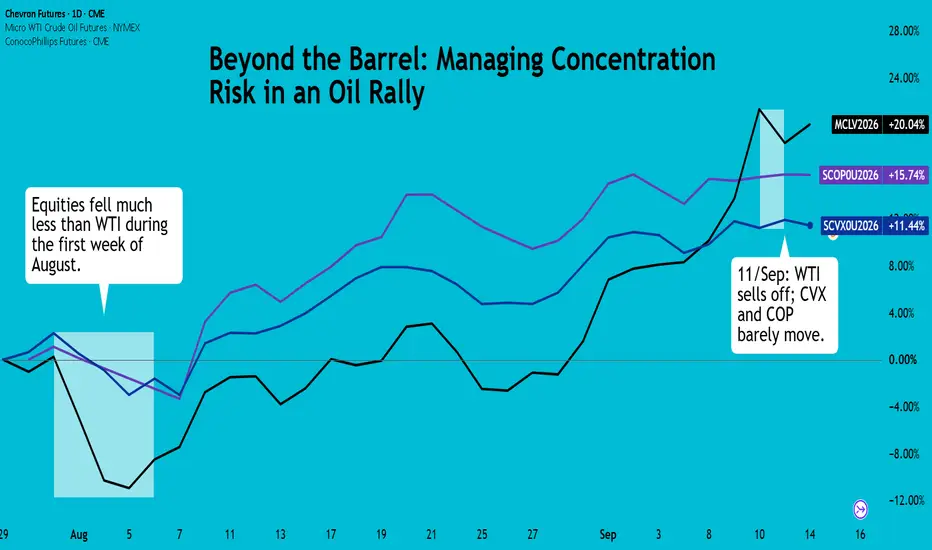
Beyond the Barrel: Managing Concentration Risk in an Oil RallyCrude’s move since August has been driven by a series of escalating flashpoints, not a single event. WTI gained nearly 30% from the start of August and crossed USD 100/bbl on 10/Sep.
Crude oil initially fell 7.7% during the first week of August as hopes of an Iran-Oman arrangement to ease Strait of Hormuz disruptions grew. Those hopes quickly faded, sending it up 5.1% on 10/Aug (Mon) as talks broke down. The push and pull continued through August, but the broader uptrend remained, with WTI ending the month up 2.2%.
A second front was already developing in the Red Sea. On 22/Jul, Houthi forces attacked two Saudi tankers near the Bab al Mandab, threatening another key oil shipping route. The attacks and subsequent Saudi-Houthi escalation added to concerns over regional supply security.
The decisive escalation came in early September, when the U.S. and Iran began directly targeting each other’s military and oil assets. On 5/Sep, the U.S. destroyed and disabled three Iranian oil tankers after the IRGC launched ballistic missiles at two U.S. Navy warships. On 8/Sep, the U.S. destroyed five more Iranian tankers after another missile attack on a U.S. warship.
WTI rose 3.25% on 9/Sep before surging another 6.7% on 10/Sep, reaching an intraday high of USD 104.04/barrel. Although WTI prices fell by 2.4% on 11/Sep, it closed the week 9.7% higher.
Major U.S. Oil Producers Uptrend is Measured
Oil majors rarely move one-for-one with crude, particularly during geopolitical spikes. Investors tend to discount the rally if they see it as temporary, while spending and returns are based on longer-term oil prices.
At the same time, inflation and rate concerns can offset some of the earnings benefit, leaving energy stocks well behind the commodity.
Why WTI Alone Isn't Always the Answer
WTI’s strength is also its weakness: with no business underneath it, the contract captures the full impact of a supply shock but can reverse just as quickly when sentiment changes. September’s move above USD 100 could unwind on the next headline.
Oil majors offer a different trade. Their earnings are diversified across crude, refining and chemicals, while buybacks and dividends provide additional support. As a result, their shares tend to move less sharply than WTI. That slower reaction also offers a useful signal: it reflects whether investors see higher oil prices as a lasting earnings shift or a temporary geopolitical spike.
The trade-off is clear : less upside torque than WTI, but greater downside protection and a better read on market conviction.
WTI Leads, but Equities Apply a Reality Check
CME’s Single Stock Futures suite launched on 27/Jul with 55 standard and 22 micro contracts covering more than 50 U.S. stocks. Of the oil names, the standard contracts cover ExxonMobil, Chevron and ConocoPhillips, while only Exxon is also available as a micro contract.
Trading nearly 23 hours a day allows investors to reprice these stocks continuously as geopolitical headlines unfold, rather than waiting for the equity market to reopen. CME has also launched 24/7 WTI futures, which we covered in our previous paper .
Source: ExxonMobil , Chevron , and ConocoPhillips
Exxon and Chevron may appear relatively insulated from crude because upstream contributes only around a quarter of revenue. But refining still depends on crude as a key input, so higher oil prices affect them through both feedstock costs and refining margins.
ConocoPhillips offers a cleaner read on crude with its entirely upstream business. Yet even it lagged significantly: WTI gained 25% while COP rose 15%. This suggests business mix is only part of the story. Equity risk appetite, doubts over the durability of the oil spike and company-specific factors also shape the response.
That same lag cuts both ways. On the downside, it can work in the investor’s favour: an instrument that captures less of the upside can also absorb less of the drawdown.
Historical Trade Example
By June, regional tensions appeared to be easing, but oil prices had already pulled back sharply from their April highs. An investor looking to stay exposed to the broader uptrend chose to split the position between Chevron and ConocoPhillips SSFs rather than take the full headline risk of crude oil.
Between mid-June and 10/Sep, the hypothetical trade would have generated a 14.19% gain on notional exposure, compared with 12.8% for WTI.
WTI fell 25.7% during the mid-June selloff, while Chevron and ConocoPhillips fell just 13.6% and 14.7%, respectively. The SSF position’s resilience during the June drawdown gave it enough of an advantage to remain ahead through the subsequent rally and outperform WTI by September.
Since SSFs on these names were not yet listed in June 2026, we use the underlying stocks’ closing prices as a proxy for SSF performance. Margin figures use current CME levels because historical SSF margin data is unavailable.
Contract details (as of entry):
Chevron SSF (SCVX0U2026): Initial margin per contract = USD 3,214; notional exposure at entry = 100 × USD 192 = USD 19,200
ConocoPhillips SSF (SCOP0U2026): Initial margin per contract = USD 2,063; notional exposure at entry = 100 × USD 118 = USD 11,800
Combined position: USD 5,277 in margin controlling USD 31,000 in notional exposure
Long CME Chevron SSF (SCVX0U2026)
Entry = USD 192
Exit = USD 216
PnL: 100 × (USD 216 – USD 192) = USD 2,400
Long CME ConocoPhillips SSF (SCOP0U2026)
Entry = USD 118
Exit = USD 138
PnL: 100 × (USD 138 – USD 118) = USD 2,000
Combined PnL = USD 2,400 + USD 2,000 = USD 4,400
That translates to an 83.4% return on the USD 5,277 margin committed, controlling USD 31,000 in combined notional exposure. WTI gained 12.8% over the same period, while the blended SSF position gained roughly 14.19% on a notional basis, outperforming the commodity itself while also carrying a materially shallower drawdown through the volatility in between.
This content is sponsored.
MARKET DATA
CME Real-time Market Data helps identify trading setups and more effectively express market views. If you have futures in your trading portfolio, you can check out on CME Group data plans available that suit your trading needs at tradingview.com/cme .
DISCLAIMER
This case study is for educational purposes only and does not constitute investment recommendations or advice. Nor are they used to promote any specific products, or services.
Trading or investment ideas cited here are for illustration only, as an integral part of a case study to demonstrate the fundamental concepts in risk management or trading under the market scenarios being discussed.
 Long
Long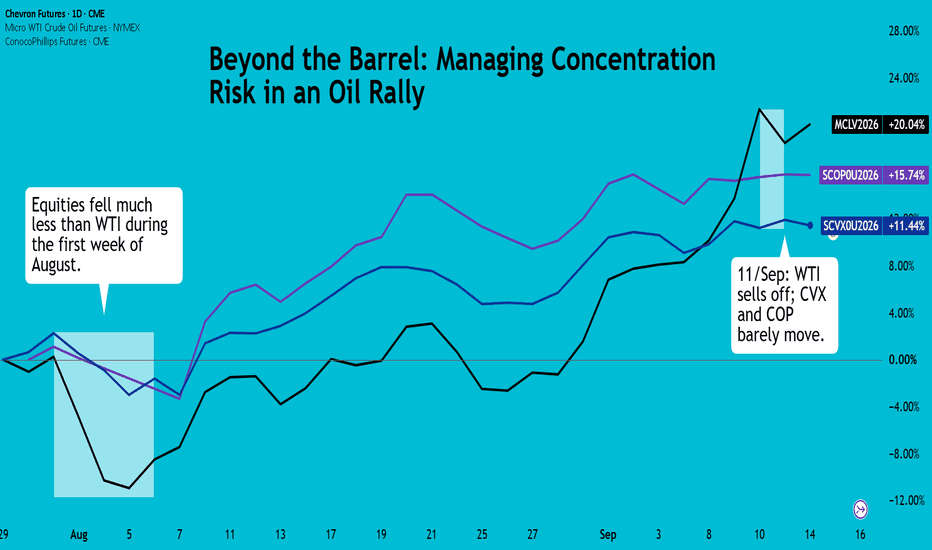
Short 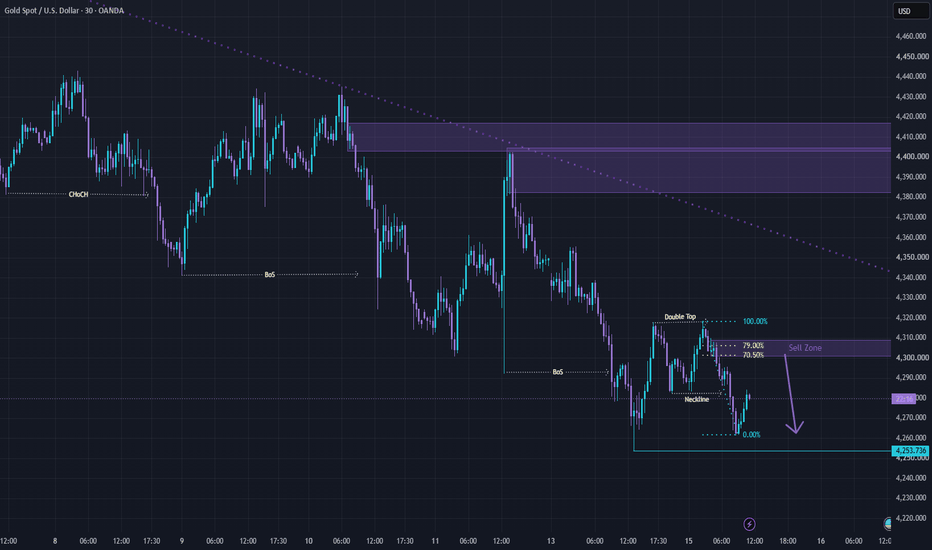
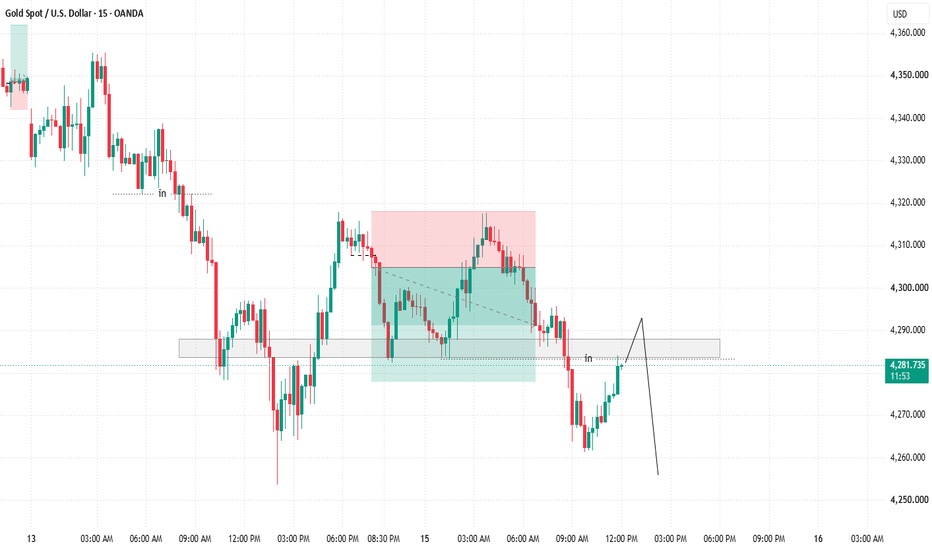
XAUUSD: Bearish Retest — Will Resistance Reject Price Again?# XAUUSD: Bearish Retest — Will Resistance Reject Price Again?
**Gold Spot / U.S. Dollar (15-minute chart)**
Gold is currently showing signs of a bearish market structure. After making lower highs and lower lows, price has started to recover from the recent drop. However, this recovery may simply be a **pullback before another move lower**.
### 🔍 What the chart is telling us
Think of the grey zone around **4,284–4,290** as a ceiling. Price previously reacted around this area, and it is now approaching the same zone again.
The key question is: **Will buyers break through the ceiling, or will sellers defend it?**
The broader structure still favors sellers because:
* Price has been making lower highs and lower lows.
* The previous rally failed to sustain bullish momentum.
* The current upward move may be a retracement into a former support-turned-resistance area.
* The marked resistance zone provides a logical area to watch for selling pressure.
### 📉 The bearish scenario
If price reaches the 4,284–4,290 zone and shows clear rejection, sellers may attempt to push Gold lower.
My projected path is:
1. Price rallies into the resistance zone.
2. Buyers struggle to break above it.
3. A bearish rejection or a break of short-term support confirms selling pressure.
4. Price potentially moves toward **4,270**, followed by the **4,260–4,255** area.
These are potential targets, not guaranteed outcomes.
### ⚠️ What would invalidate the idea?
If Gold breaks above the resistance area with strong bullish candles and holds above it, the bearish setup becomes weaker. A sustained move above the broader supply area around 4,305–4,317 would further challenge the short-term bearish outlook.
### 🎯 My trading plan
I am not interested in selling simply because price has reached the zone. I want to see sellers prove themselves.
**Bearish confirmation:** Rejection from resistance, followed by a break of nearby short-term support.
**Entry:** After confirmation, preferably on a retest rather than chasing a large bearish candle.
**Targets:** 4,270 → 4,260 → 4,255.
**Invalidation:** A strong bullish breakout and sustained acceptance above the resistance area.
### 🧠 Simple takeaway
Gold is climbing toward a ceiling after falling. The ceiling may push price back down, but we must wait and see whether sellers actually defend it.
**Patience first. Confirmation second. Execution last.**
*This is a technical analysis scenario, not a guaranteed prediction or financial advice.*
Short