XAUUSD 45M: Key Support Zone and Potential Upside PathGold (XAUUSD) is currently trading around 4,335 on the 45-minute chart. Price has recently reacted from the lower support area and is showing signs of recovery from the 4,300–4,320 region.
The chart highlights three important zones:
Support: around 4,300–4,320
First resistance: around 4,415–4,430
Upper resistance: around 4,465–4,480
Price is attempting to move back above the nearby support/resistance area around 4,330–4,340. If this recovery continues and the intermediate resistance zones are cleared, the projected path on the chart points toward the upper 4,470–4,480 region.
The setup remains dependent on price action around the marked zones. A sustained move below the lower support area would weaken this structure and invalidate the illustrated path.
Key levels:
Support: 4,300–4,320
Current area: 4,335
Resistance: 4,415–4,430
Upper zone: 4,465–4,480  Long
Long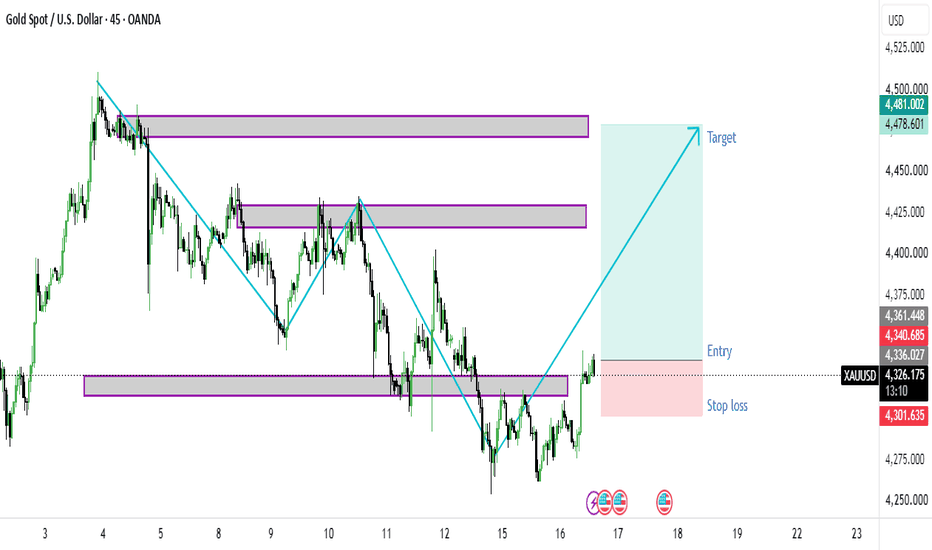
 Short
Short
XAU/USD 16 September 2026 Intraday AnalysisH4 Analysis:
-> Swing: Bullish.
-> Internal: Bearish.
Bias and analysis to remain the same as analysis dated 30 June 2026.
Price did not print bullish CHoCH to indicate bullish pullback phase initiation. Price instead printed a new low followed by a bullish CHoCH
Price is currently trading within and established internal range, however, I will continue to monitor price with respect to depth of pullback.
Intraday expectation:
Price to trade up to either premium of internal 50% EQ, or H4 demand zone before targeting weak internal low, currently priced at 3,942.100.
Note:
Gold remains volatile as tensions between the US, Israel, and Iran keep safe‑haven demand elevated.
Markets are reacting quickly to every headline, while uncertainty around the Fed’s easing path and shifting U.S. policy under President Trump, especially tariffs continues to fuel choppy price action.
For newer traders, the key is simple, stay flexible and manage risk carefully, as fast spikes and sudden reversals are a normal part of the current XAU/USD environment.
H4 Chart:
M15 Analysis:
-> Swing: Bearish.
-> Internal: Bullish.
Price has printed according to analysis dated 02 September 2026 whereby I mentioned price to trade up to either premium of internal 50% EQ, or M15 demand zone before targeting weak internal low, currently priced at 4,282.625. Please note, in error I mentioned weak internal high instead of weak internal low.
This is exactly how price printed. Price has subsequently printed a bullish CHoCH to indicate bullish pullback phase initiation.
Price is currently trading within an established internal range. I shall continue to monitor price with respect to depth of pullback.
Intraday expectation:
Price to trade up to either premium of internal 50% EQ, or M15 demand zone before targeting weak internal low, currently priced at 4,253.625.
Note:
Gold remains highly reactive on M15 as geopolitical risk continues to drive quick, headline‑led moves.
The tension between the US, Israel, and Iran is keeping safe‑haven demand elevated, with markets still sensitive to any sign of escalation.
At the same time, shifting US tariff policy under President Trump is adding extra uncertainty, fuelling sharp intraday swings and increasing the likelihood of sudden sentiment flips. Liquidity pockets and whipsaws remain common, making disciplined risk management essential.
Gold’s geopolitical premium is still firmly in place, and until tensions ease, short‑term volatility is likely to stay front‑loaded.
M15 Chart: Long 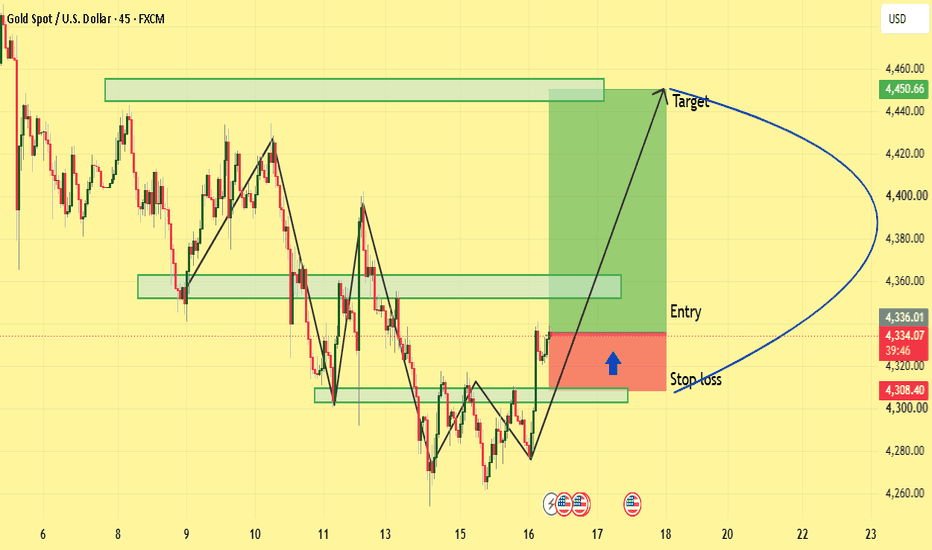
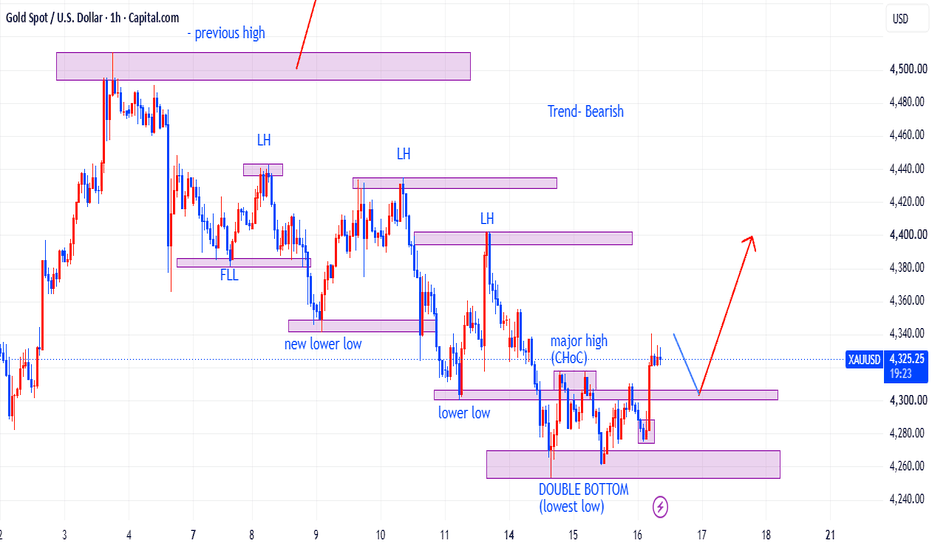
XAUUSD — Key Resistance Zone and Potential Downside StructureXAUUSD is currently trading around 4,337 after reacting from the lower support area.
The chart shows a clear market structure with:
A major support zone around 4,250–4,280
A key resistance zone around 4,400–4,435
Previous LH (Lower High) formation near the upper resistance area
Price currently recovering from the lower support region
The main area to watch is 4,400–4,435. If price reaches this zone and shows rejection, the chart structure could allow another move toward the lower support area around 4,264.
On the other hand, a sustained move above the resistance zone would weaken this downside structure and could indicate a change in the current setup.
Key levels:
🔹 Support: 4,250–4,280
🔹 Current area: 4,337
🔹 Resistance: 4,400–4,435
🔹 Lower reference: ~4,264
This idea is based on the visible market structure, support/resistance zones, and the reaction around these levels. Price action should be monitored as the setup develops. Short 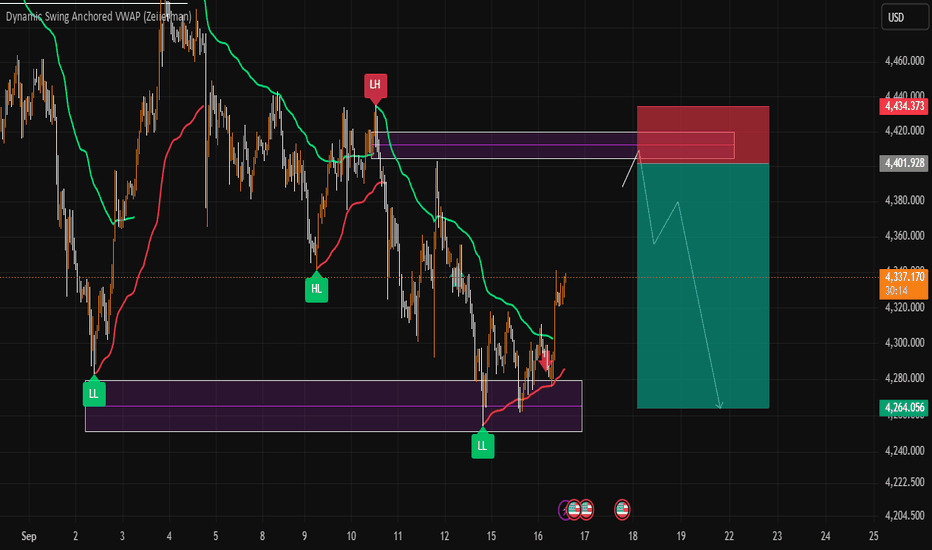
XAU/USD × kurutologic: Triangle Confluence & 3 ScenariosThis is kurutologic.
Today, I am sharing an updated structural analysis and scenario map for Gold (XAU/USD) on the 4H timeframe to gauge the near-term trading direction.
■ Market Overview
The market is currently forming a symmetrical triangle consolidation. Price is strongly supported by the "4H Support Zone" and the ascending trendline, while being capped by a descending trendline. Volatility is compressing, indicating an energy accumulation phase before the next major impulse.
■ Key Technical Confluence
1. POC & Trendline Intersection
Just above current price lies a critical resistance zone where the highest volume node, the "POC Line & Zone," intersects with the descending trendline.
2. 4H Order Blocks (Purple Boxes)
Above this intersection, unmitigated 4H Order Blocks are stacked in two levels, representing heavy institutional supply.
■ 3 Trade Scenarios & Action Plan
Since we are inside a consolidation pattern, we anticipate a test of the overhead resistance. I have mapped out 3 potential pathways (①-③):
① Rejection at POC Confluence: Price tests the heavy resistance where the POC intersects with the descending trendline and fails, leading to a drop.
② Liquidity Sweep at 4H OB: Even if price breaks the POC, it pushes into the first "4H Order Block" to trap retail breakout buyers. This liquidity sweep results in a sharp fake-out and drop. This is the primary hazard to watch out for.
③ OB Breakout & Support Inversion: A decisive body-candle breakout above the 4H OBs. If price can flip these supply zones into support (pullback) with clear price action, it confirms a high-probability long setup for continuation.
Maintain a neutral bias while inside the triangle. Wait for clear confirmation—either a strong rejection at the upper confluence zones or a decisive breakout—before executing.
This analysis is for educational purposes only and does not constitute financial advice. Always practice strict risk management.
kurutologic XAUUSD – PINNED 4,270–4,354, WAITING FOR FOMC!Leo re-read your chart: the scenario lines up almost perfectly with the levels drawn – both the 4,341–4,351 turn zone and the two arrows at 4,486 / 4,202. Gold sits at 4,322.80, swept the low at 4,275.60 then reclaimed 4,340.79 (+0.66%). The range is holding.
🌍 REALTIME MACRO
DXY hovers at 99.61–99.70, near its range top – USD's weak spot, the higher it goes the more room to be sold when news lands. US10Y touched 5.00% for a fifth straight session and still weighs on gold, yet gold holds 4,320 – structural demand is intact.
Two markers tonight: 19:30 – Retail Sales m/m (forecast 0.8%, prior -0.6%) and 01:00 – Fed Funds Rate + Dot Plot, followed by Chair Warsh's press conference at 01:30. The rate bet is split: ~52% hold / ~46% hike 25bp. The key point: if the Fed hikes exactly 25bp without extra hawkishness → "sell the rumor, buy the fact" → USD gets sold back → gold rallies. For gold to collapse to 4,202 you need a real surprise: a 50bp hike, a hawkish Dot Plot, or a hard-line Warsh.
📉 CHART EVIDENCE
Live price 4,334.42. Horizontal lines: 4,410 → 4,340 (bottom of the yellow band) → 4,320 → ~4,290 → 4,270 → 4,240 (TURN H4) → 4,200. The yellow TURN H1 band: 4,340–4,355 matches your 4,341–4,351 turn zone. A green arrow fires from 4,355 above 4,460 (target 4,486), a red arrow runs from 4,235 down to 4,200 (target 4,202). Seven-point zig-zag: 4,340 ↑ 4,320 ↓ 4,340 ↑ 4,280 ↓ 4,320 ↑ 4,270 ↓ 4,340 ↑. The chart shows no EMA/RSI/volume – pure S/R. You mapped 7 of 7 levels.
🧠 WHY PRICE MOVES THIS WAY
Leg 1 – up to 4,341–4,351: price sits right under the yellow band, and the 4,275–4,278 sweep printed a Higher Low on M15. Pre-news flow typically pushes price to the range top to build liquidity – taking the 4,340 high and hunting short stops.
Leg 2 – pullback to 4,317 / 4,288 / 4,270: none of these are random – 4,317≈4,320 is a repeatedly tested S/R; 4,288≈4,290 is the mid-range line where institutions rebalance; 4,270 is the sideways floor and the stop cluster for every long. Nobody wants full size before a release, DXY is pinned near its high and US10Y is at 5%, so price gets dragged back to equilibrium.
Leg 3 – back to 4,341–4,351: once both ends are swept, a fresh buying wave forms, confirming a two-sided compression – enough stored energy to break out after the news.
After the news: a Retail Sales miss or a dovish Warsh → break 4,354 → 4,410 → 4,460 → 4,486. Strong Retail Sales plus a hawkish Fed → break 4,270 → 4,240 → 4,202.
⚔️ PLAN & ADVICE
Pre-news:
SELL scalp at 4,341–4,351 on an M1/M5 Pinbar or bearish CHoCH, SL 4,362, TPs 4,317 → 4,288 → 4,270.
BUY scalp at 4,288 or 4,270 on a bullish reaction candle, SL 4,258, TPs 4,317 → 4,341 → 4,351. 4,320 is chop – do not trade it.
Post-news: don't click for the first 5–15 minutes; spreads widen and price whipsaws both ways. Wait for price to reach 4,270–4,240 or 4,354–4,410, then read the M5 reaction. Enter only on a Pinbar/CHoCH at the turn zone.
Invalidation: M15 close above 4,365 → cancel the bearish scenario. M15 close below 4,258 → cancel the bullish scenario, confirming the path to 4,240–4,202.
Advice: 50% size; non-professionals stay out and wait 30 minutes after Warsh's press conference. Don't chase shorts into 4,270–4,240 pre-news – the hike is largely priced in and this is the classic trap. Don't chase longs into 4,340–4,350 while DXY is near its high. Move SL to breakeven at TP1, and don't hold through 01:00 unless in profit. Risk management > prediction – survive tonight and you keep capital for next week.
Disclaimer: for informational purposes only, not investment advice. Confirm M1/M5 signals before entering.
— Leo 🥇⚔️ Long 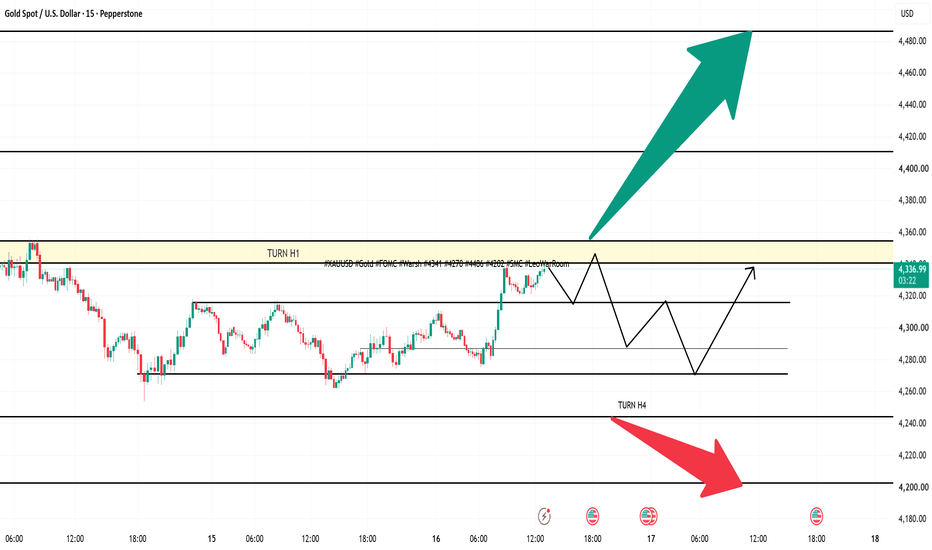

Gold (XAU/USD): news flow leaning bearish — the net read
Gold (XAU/USD) did not get one story today, it got several, and they do not all point the same way. Weighed against each other — new against old, and tracking which ones have already faded:
−− Bond yields are spiking, oil is up — but investors aren’t giving up on stocks
−− Why markets have left the Fed little choice but to hike rates
−− Treasury yields hitting 5% may not break markets now — but the clock is ticking
58 stories were weighed in this window; the 3 carrying the most weight are listed.
Net read: −−− leaning bearish — top of our scale.
What this is: a measure of which way the *news* is leaning right now — not a promise about price. A read being right and a read still being worth taking are two different things: once price has travelled a long way from where the read was published, it is stretched, and a lean that is stretched is a no-chase rather than an invitation.
Weight is not fixed either. A fresh headline lands, the balance tips, and the net read can flip inside an hour — that shift is the part worth watching, not the first print.
I will post an update under this idea once the market has had time to speak, either way.
(Informational only — not financial advice, not a signal.) Short 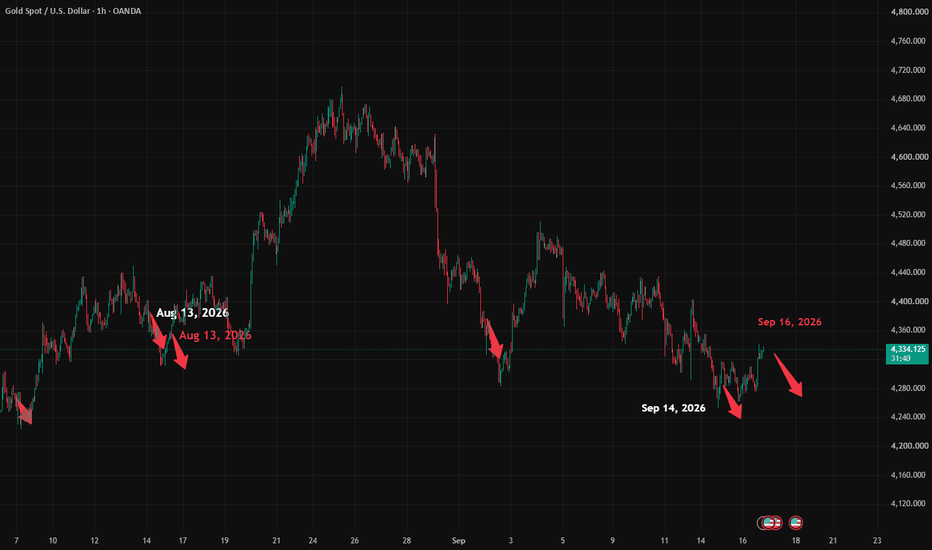
 Short
Short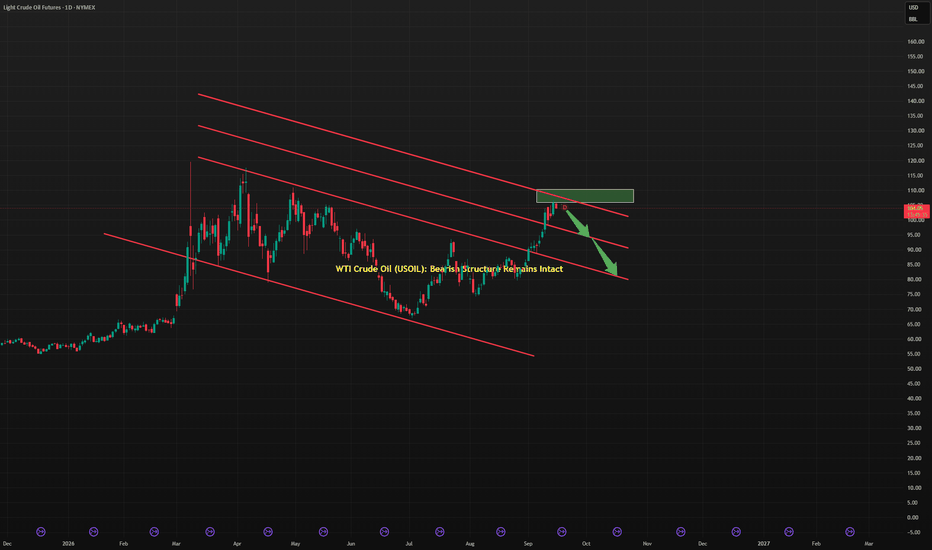
XAUUSD Bullish Recovery | Support Zone Test (2H)
Gold is attempting a recovery from the highlighted support zone after a prolonged decline within the descending structure. Price is holding near the lower support area, making the next reaction important for the short-term direction.
🟦 Support Objective: 4,280–4,315
🟢 1st Resistance Objective: 4,410–4,420
🟢 2nd Resistance Objective: 4,490
📈 Bias: Recovery attempt from support, with resistance confirmation required.
A sustained hold above the support zone could allow Gold to continue recovering toward 4,410, while a clean break and hold above that area may expose the 4,490 resistance region. If support fails, the recovery setup would weaken and price could remain under pressure. Long 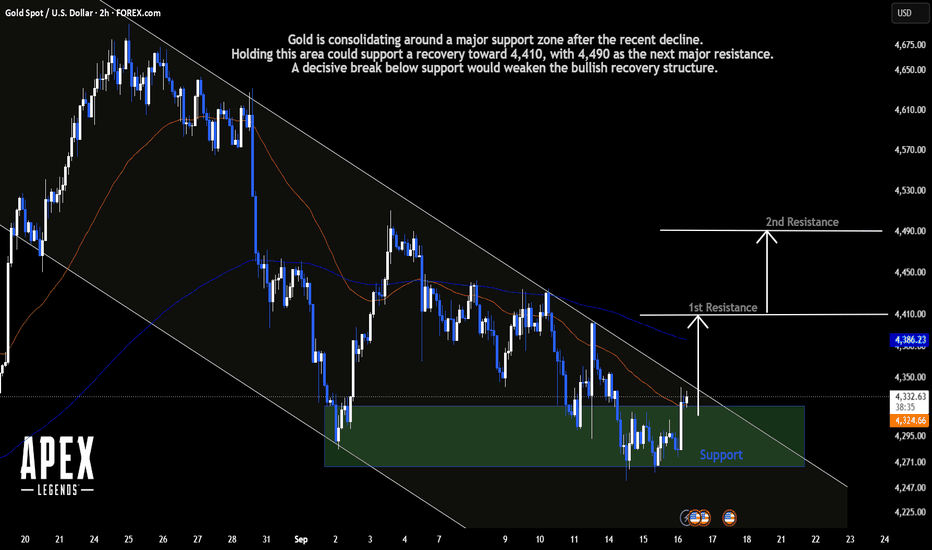
XAU/USD GOLD 1H — LIQUIDITY SWEEP DONE, IS THE NEXT BREAKOUT ?📊 Technical Analysis
Gold is showing a potential bullish reversal setup on the 1H chart after sweeping liquidity beneath the recent lows. Price has reclaimed the Key Level and is currently trading around 4,335.
🟢 Liquidity Sweep: Price dipped into the support area around 4,250, potentially clearing sell-side liquidity before bouncing.
🟡 Key Level: The 4,300–4,315 area is important. Holding above this zone would support the bullish scenario.
💎 Support Zone: Around 4,250–4,265. A sustained defense here keeps the reversal structure intact.
🚀 Bullish Target: 4,378–4,380, near the marked resistance/target area.
🔴 Invalidation: A decisive move below 4,232 would weaken this bullish setup.
🎯 Potential Scenario
Liquidity Sweep → Reclaim Key Level → Bullish continuation → Target 4,378–4,380
⚠️ This is a technical scenario, not a guarantee. Watch how price reacts around the key level and support zone before entering.
🔥 Catchy TradingView Title
🚀 GOLD LIQUIDITY SWEEP COMPLETE! 🔥 Bulls Eye 4,380 Next? 🐂💰 Long 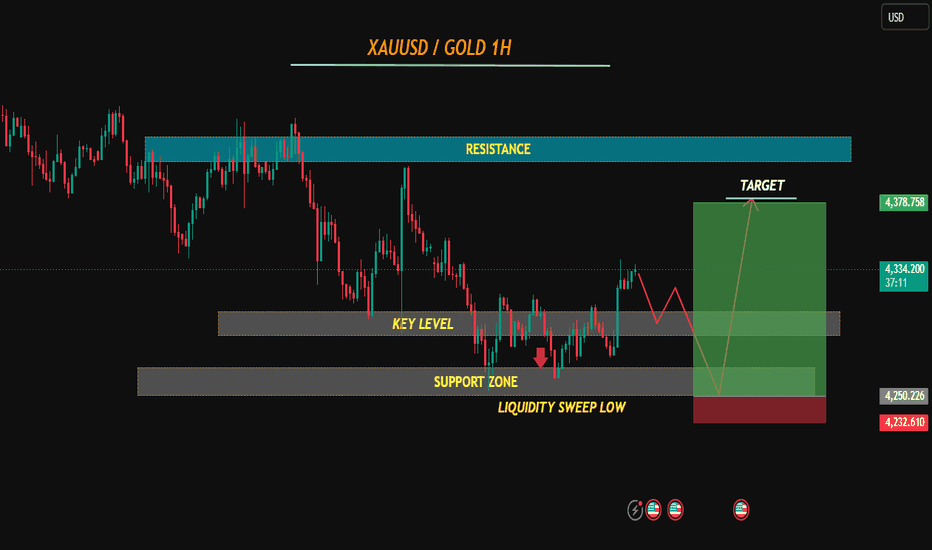
XAU/USD (1D) — Potential Head & Shoulders Retest
Market Structure & Technical Breakdown
Pattern: Developing Head & Shoulders (H&S) on the daily timeframe following rejection at the ~$4,694 peak (Head).
Support Confluence: Price is retesting key demand between $4,246–$4,331, aligning with the 0.5–0.618 Fibonacci retracement zone.
Price Action & Indicators: Printing a potential Morning Star reversal at support. RSI sits below 50 (bearish bias), OBV shows distribution, and price has crossed below major EMAs while testing a descending trendline.
Intermarket & Macro Drivers
DXY & US10Y: Strong Dollar Index (~99.6) and high 10-Year Yields (~4.97%) present firm macro headwinds for Gold.
WTI Oil: Elevated crude (~$103/bbl) fuels inflation concerns, which can act as a double-edged sword: supporting safe-haven demand while simultaneously raising Fed rate expectations.
VIX & Event Risk: Moderate volatility (~17.2) ahead of the FOMC decision. High potential for pre-news liquidity sweeps in both directions.
Execution Plan & Risk Management
Direct Shorting at Demand: High-risk into current support. Selling directly into a daily 0.5–0.618 Fib zone before a lower high forms reduces edge.
Preferred Setup:
Pullback Entry: Wait for a relief rally into the 0.382 Fib (~$4,417) or Fair Value Gap (FVG) to complete the Right Shoulder. Enter short on a confirmed lower high reversal, placing the Stop Loss above the Right Shoulder peak (~$4,460+).
Breakdown Entry: Wait for a daily candle close below $4,246 (0.618 Fib) to trade continuation toward target support at $3,969. Is NVIDIA's AI Dominance Facing Its Final Test? Macroeconomics and Geopolitics
NVIDIA dominates the global hardware ecosystem with unprecedented market capitalization. However, macroeconomic volatility and sovereign tech mandates test its market dominance. Governments aggressively fund domestic semiconductor ecosystems to reduce foreign silicon dependency. Competitors draw massive investments, including Samsung co-leading a 231 million dollar funding round for Dutch startup Euclyd. This competitive shift forces NVIDIA to strengthen its global geostrategic footprint. The company builds localized data centers to comply with strict sovereign security laws.
Business Models and Enterprise Trends
NVIDIA actively transforms its core business model beyond graphics hardware sales. Enterprise clients now prioritize complete ecosystem integration over standalone processor purchases. Salesforce partnered with NVIDIA to launch Koa, a specialized CRM reasoning model built on Nemotron 3 Super. Simultaneously, privacy fears reshape enterprise AI adoption across major tech corridors. NVIDIA and Palantir restricted third-party models due to corporate data retention concerns. NVIDIA leverages its private Nemotron framework to satisfy strict enterprise security demands.
Management, Leadership, and Culture
Chief Executive Officer Jensen Huang maintains a flat organizational architecture. This leadership style drives hyper-speed decision-making across all operational units. Company culture emphasizes continuous disruption and extreme accountability. Engineers pivot rapidly from graphics rendering roots to advanced neural compute architectures. Leadership ruthlessly targets long-term technological transformations rather than short-term financial gains. This aggressive mindset insulates NVIDIA against legacy hardware stagnation.
High-Tech, Quantum Science, and Technology
NVIDIA expands beyond classical artificial intelligence into fault-tolerant quantum computing systems. The company launched CUDA-Q Logical at IEEE Quantum Week 2026 to simplify hybrid programming. This open-source platform accelerates quantum algorithm development across heterogeneous CPU, GPU, and QPU architectures. Using NVQLink networking technology, researchers link quantum processor units directly to GPU supercomputers. Fermilab reduced algorithm development cycles from five months to three weeks using CUDA-Q.
Cybersecurity Infrastructure and Patent Analysis
Cybersecurity remains a pivotal foundation for enterprise client architecture investments. Patent filings highlight exponential growth in hardware-level encryption and confidential cloud compute enclaves. Recent patents focus on token-efficient inference architectures and microsecond interconnect protocols. These proprietary technologies secure multi-tenant AI clusters against advanced state-sponsored data extraction. NVIDIA builds formidable intellectual property moats around its zero-trust hardware design.
Scientific Breakthroughs and Pharmaceutical Science
NVIDIA silicon directly accelerates modern computational biology and drug discovery research. The company's specialized compute stack powers bio-molecular simulation platforms globally. Researchers leverage high-throughput GPU clusters to map complex protein structures efficiently. This computational speed drastically reduces clinical trial costs for leading pharmaceutical firms. Hardware innovation transforms theoretical medical science into actionable life-saving treatments.  Long
Long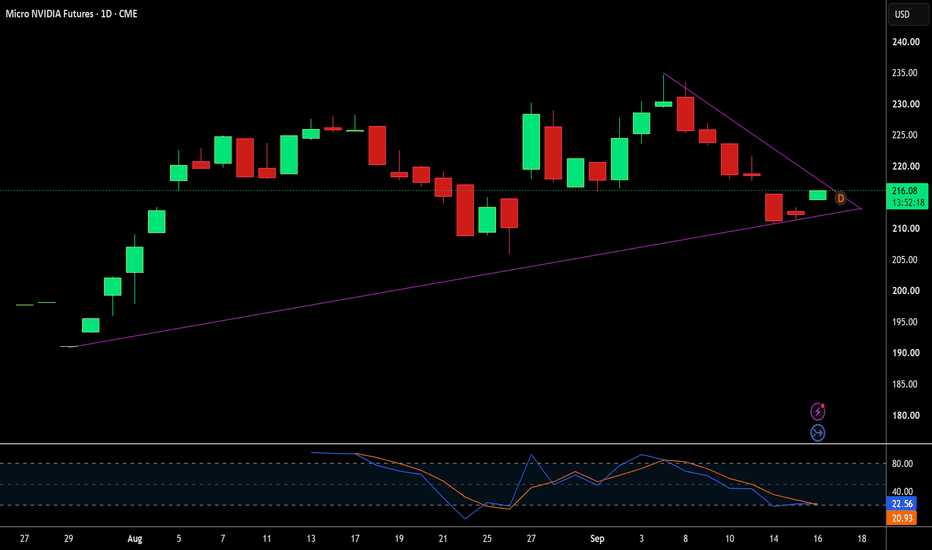
𝗫𝗔𝗨𝗨𝗦𝗗 𝗗𝗔𝗜𝗟𝗬 𝗢𝗨𝗧𝗟𝗢𝗢𝗞 | 𝗦𝗘𝗣 𝟭𝟲𝗫𝗔𝗨𝗨𝗦𝗗 𝗗𝗔𝗜𝗟𝗬 𝗢𝗨𝗧𝗟𝗢𝗢𝗞 | 𝗦𝗘𝗣 𝟭𝟲
𝗗𝟭: Gold is bouncing from support, but the 𝗺𝗮𝗶𝗻 𝗱𝗼𝘄𝗻𝘁𝗿𝗲𝗻𝗱 𝗹𝗶𝗻𝗲 continues to cap the recovery.
𝗛𝟭: The short-term breakout remains valid while price holds above 𝟰,𝟯𝟬𝟬. Immediate resistance is located at 𝟰,𝟯𝟱𝟬–𝟰,𝟯𝟳𝟱.
𝗧𝗢𝗗𝗔𝗬’𝗦 𝗦𝗘𝗧𝗨𝗣
🟢 𝗕𝗨𝗬: Wait for bullish rejection from 𝟰,𝟯𝟬𝟬–𝟰,𝟯𝟭𝟬. A deeper pullback could offer another buy opportunity at 𝟰,𝟮𝟱𝟬–𝟰,𝟮𝟴𝟬.
𝗧𝗮𝗿𝗴𝗲𝘁𝘀: 𝟰,𝟯𝟱𝟬–𝟰,𝟯𝟳𝟱, then 𝟰,𝟰𝟬𝟬.
🔻 𝗦𝗘𝗟𝗟: Look for shorts only after a confirmed bearish reaction at 𝟰,𝟯𝟱𝟬–𝟰,𝟯𝟳𝟱.
𝗧𝗮𝗿𝗴𝗲𝘁𝘀: 𝟰,𝟯𝟮𝟬–𝟰,𝟯𝟬𝟬.
⚠️ A confirmed 𝗛𝟭 𝗰𝗹𝗼𝘀𝗲 𝗯𝗲𝗹𝗼𝘄 𝟰,𝟮𝟱𝟬 would invalidate the bullish setup.
#XAUUSD #Gold #GoldTrading #TechnicalAnalysis
Long 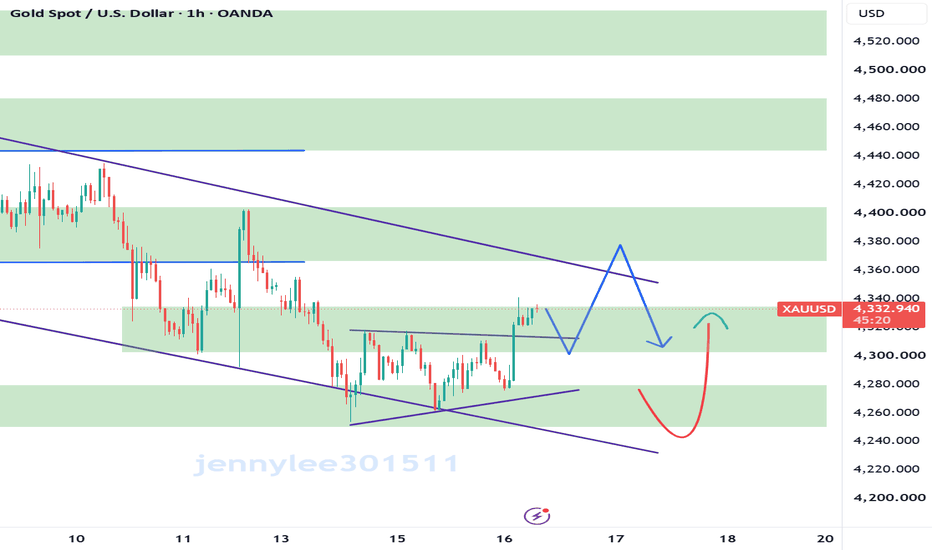
Short 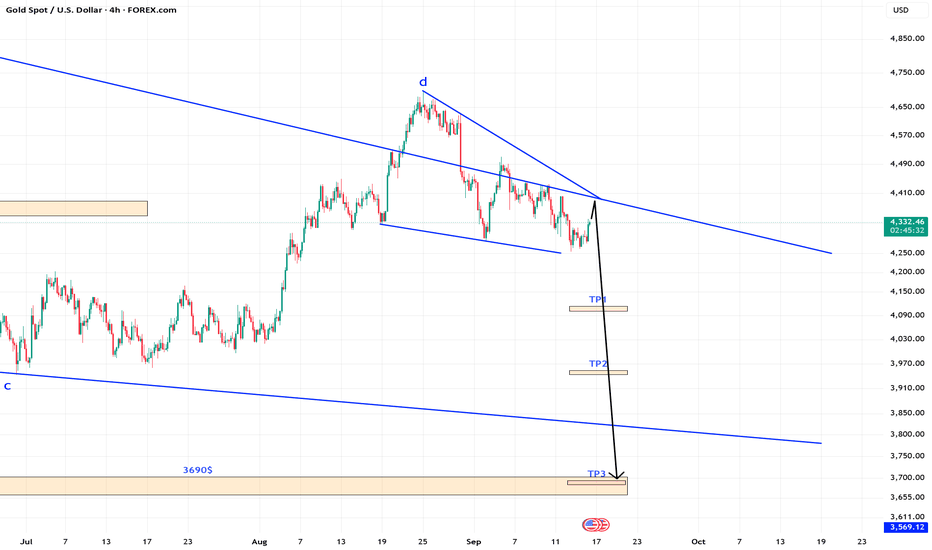
FED DAY - REBOUND INTO RESISTANCE — SELLERS READY?Gold is attempting a technical rebound from the lower boundary of the descending channel, but the broader H4 structure remains bearish. After falling toward the 4,250–4,280 area, price has started to recover and is currently around 4,325. However, this rebound is still developing below the descending trendline, meaning buyers have not yet produced the structural confirmation needed for a reversal.
From a macro perspective, today is dominated by the FOMC decision. Markets have priced in more than a 90% probability of a 25bp rate hike, while the U.S. 10Y yield recently moved above 5% and the USD remains firm. Higher yields and expectations of tighter monetary policy continue to create headwinds for non-yielding Gold.
The bigger catalyst, however, will be Fed forward guidance rather than the rate decision itself. With the hike largely priced in, a hawkish Fed — particularly signals that rates may remain higher for longer — could strengthen USD/yields and pressure Gold back toward the lower channel. Conversely, a less-hawkish message could trigger a stronger short-covering rebound.
Technically, the immediate resistance is around 4,340–4,360, where the rebound meets the descending trendline and the marked Demand zone. If Gold reaches this area and fails to break through, sellers could regain control and target 4,260–4,280, followed by the major 4,230–4,240 Supply zone.
Bearish Scenario — Preferred Bias
If Gold rebounds into 4,340–4,360 but remains below the descending trendline, the recovery can be treated as a corrective move. A rejection here could send price back toward 4,280, with a break potentially extending toward 4,230–4,240.
Bullish Scenario
A confirmed H4 breakout above 4,340–4,360 and the descending trendline would weaken the bearish structure. In that case, Gold could recover toward 4,390–4,420, with 4,450 as the next resistance.
At this stage, Lucas does not favor chasing the current rebound. The better confirmation is either a rejection from the trendline to follow the bearish flow, or a clean H4 breakout above the trendline before considering that sellers are losing control.
KEY LEVELS:
🔴 4,340–4,360 — Demand + descending trendline resistance
🔴 4,390–4,420 — Next recovery resistance
🟢 4,260–4,280 — Lower-channel target
🟢 4,230–4,240 — Major Supply
BIAS: BEARISH — WAIT FOR THE TRENDLINE REJECTION OR CONFIRMED BREAKOUT. Short 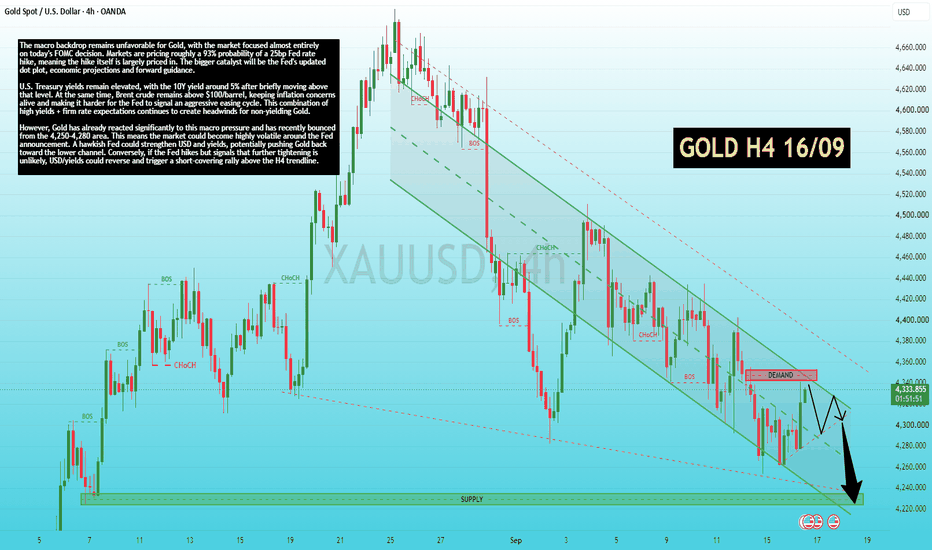
Natural Gas 4H: Breakout Retest in FocusNatural Gas has been trading in a rising channel on the 4H timeframe. Price initially broke below the rising channel, signalling a loss of short-term trend support and triggering a move lower toward the Point of Control (POC) at 2.767. However, instead of accelerating lower, buyers stepped back in aggressively at the value area and drove price sharply higher.
The market has now returned to test the underside of the former channel support, highlighted by the yellow circle. This is a classic technical setup where former support is being retested as potential resistance.
POC at 2.767 Proves Its Importance
The most significant level on the chart remains the 2.767 POC, marked by the black horizontal line.
The volume profile shows this as the area with the highest concentration of traded volume, making it the market's primary value zone. The strong bullish reaction from this level confirms that buyers continue to view this area as fair value.
The rebound from the POC is the reason the current breakdown remains unconfirmed from a broader structural perspective.
Break-and-Retest Zone Now the Key Battleground
The yellow-circled area highlights the current technical setup:
Previous channel support failed.
Price sold off toward the POC.
Buyers regained control from value.
Price rallied back into the broken trendline.
The market is now deciding whether the former channel support will become resistance or whether buyers can reclaim the structure and invalidate the initial breakdown.
Heavy Volume Acceptance Between 2.80 and 2.95
The volume profile shows substantial market participation between 2.80 and 2.95.
This suggests the market remains in a high-acceptance area where both buyers and sellers are active. A sustained move away from this volume shelf would likely require a stronger catalyst such as storage data, weather forecasts, or LNG-related developments.
Momentum
The 14-period RSI is holding near 57, recovering from the earlier selloff.
Momentum has improved following the rebound from the POC but remains below overbought territory, indicating the market still has room to expand in either direction.
Long 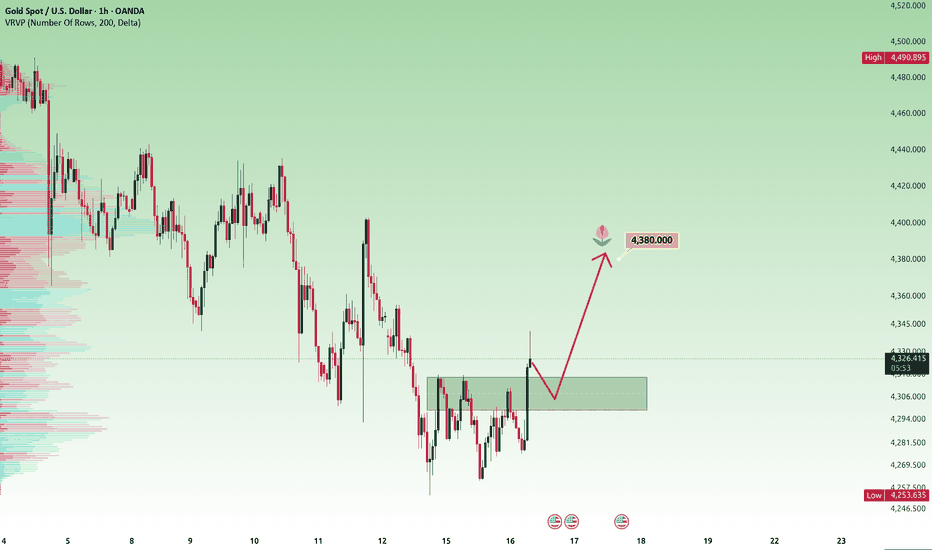
 Long
Long
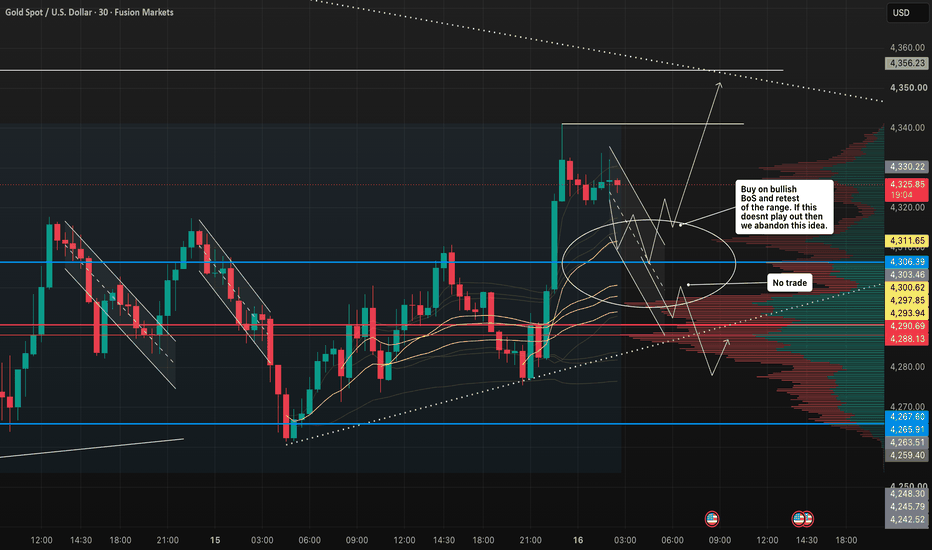
GOLD XAUUSD: Don't Buy Until THIS Level Holds!GOLD (XAU/USD) 🌍
The macro narrative heading into this week is heavily anchored to central bank policy expectations and fluctuating Treasury yields 🏦. Interestingly, general online sentiment is leaning heavily bullish, with retail consensus eagerly chasing every upward tick. This extreme crowding suggests a classic setup where late retail buyers risk getting trapped before institutional money triggers a proper liquidity hunt to clean up the board.
From a structural perspective, we are observing a potential Bullish Market Structure on the M30/H4 timeframe 📈. However, retail community chatter is calling for an immediate breakout to new highs, which signals to me that the market is prime for a classic Wyckoffian shakeout. AMT logic confirms price is attempting to build value above the recent consolidation node. If we see a failure to hold value outside the composite profile, the stage is set for a sharp mean reversion back into the balance area.
Key Zone: Price is hovering near the upper edge of the Volume Profile Value Area around $4,305–$4,311 📉. A sustained holding pattern above the Value Area High (VAH) signals volume acceptance in a discovery phase, whereas a drop back inside confirms a return to internal auction balance.
We are currently positioning at the top of the short-term trading range. I am patiently watching for a run on liquidity to sweep the late buyers sitting right above the immediate local highs around $4,340 🧹, before determining if true institutional demand takes over.
My Trade Plan 🎯
Bias: Neutral / Patience for Long Setup. I am waiting for confirmation rather than chasing impulse moves.
Entry Protocol: I will enter long only upon a clean bullish Break of Structure (BoS) and a successful retest of the Volume Profile Value Area boundary (holding above $4,305 - $4,311). If price falls back and closes inside the Value Area range, the long setup is invalidated and I will abandon the idea entirely. Long
Long