XAUUSD — Bearish Trend, Waiting for the PullbackMarket Pulse
Gold remains under pressure ahead of the Fed decision.
Higher Treasury yields, a firmer U.S. dollar and strong rate-hike expectations continue to limit the upside. High oil prices are also keeping inflation concerns alive, so volatility may stay elevated.
What the Chart Says
XAUUSD remains bearish on H1.
Price continues to form lower highs and lower lows, while the latest breakdown has pushed Gold back toward the lower support structure around 4,255–4,265.
The current price near 4,283 is already close to support, so I would not chase fresh shorts here.
A corrective rebound could first reach 4,307–4,318, which is the nearest broken structure and first resistance.
If price recovers further, the more important area sits around 4,345–4,357. This is the main rejection zone on the chart and a cleaner place to watch for sellers to return.
If that area holds, another bearish wave could develop toward 4,255–4,265, followed by the deeper 4,225–4,240 demand zone.
Levels That Matter
4,425–4,435 — Major upper resistance
4,345–4,357 — Main rejection area
4,307–4,318 — First resistance
4,255–4,265 — Support zone
4,225–4,240 — Main demand zone
My Main Plan
The main plan remains bearish.
I prefer waiting for price to recover toward 4,307–4,318 first.
If the rebound becomes stronger, 4,345–4,357 is the better sell area to watch.
A clear bearish reaction from resistance could bring Gold back toward 4,255–4,265 and later the deeper demand zone.
What I Need to See
I want the rebound to form another lower high and fail below the marked resistance areas.
A sustained H1 move above 4,357 would weaken the immediate bearish setup. A stronger recovery above the major upper resistance would suggest a larger structure change.
Final Read
The H1 trend still favors sellers, but price is already near support.
For now, I prefer waiting for the pullback and selling from resistance rather than chasing the move lower, especially with the Fed decision likely to create sharp two-way volatility.  Short
Short
MESZ Sep 16: FOMC Day — 7697 Break or 7643 Breakdown?MESZ is entering FOMC day with a neutral-to-slightly bullish structure.
The first upside confirmation level is 7,697. A confirmed 1-hour close above that level could support continuation toward 7,720, followed by 7,750.
On the downside, 7,643 is the key support level. A confirmed break below it could open the path toward 7,600.
Key levels: 7,697 bullish trigger, 7,720 first upside target, 7,750 higher target, 7,643 key support, 7,600 downside target.
Bullish: reclaim 7,697 → 7,720 → 7,750.
Bearish: lose 7,643 → 7,600.
With the FOMC decision at 2:00 PM ET, I’m waiting for confirmation rather than chasing the initial volatility.
Not financial advice. No confirmation, no trade. CME_MINI:MESZ2026 Crude Oil at Critical Resistance: Downside Move Ahead?Resistance-Based Downside Setup
The stock is currently approaching a major resistance/supply zone around ₹10,300–₹10,500. From a technical-analysis perspective, this area is critical because the price is trading close to the upper resistance structure and may face selling pressure if it fails to sustain above the zone.
Key Technical Rationale
Major Resistance Zone
₹10,300–₹10,500 represents an important overhead resistance area. Failure to sustain above this zone could result in profit booking and a corrective move.
Trendline Resistance
The upper red trendline continues to act as a significant resistance barrier. A rejection from this trendline would strengthen the downside setup.
Downside Levels
If bearish confirmation develops from the resistance zone, the next important downside levels to monitor are:
₹9,000 – First Downside Objective
₹8,500 – Extended Downside Objective
View
The setup should be approached through price confirmation rather than prediction. A bearish reversal/rejection near resistance, followed by weakness below the recent swing structure, would provide stronger confirmation for the downside thesis.
Trade Structure
Resistance: ₹10,300–₹10,500
Downside Objective 1: ₹9,000
Downside Objective 2: ₹8,500
Invalidation: Sustained breakout and acceptance above the resistance zone
Technical Bias: BEARISH BELOW RESISTANCE
The key thesis is a potential rejection from ₹10,300–₹10,500, with ₹9,000 and ₹8,500 as the major downside levels to monitor.  Short
Short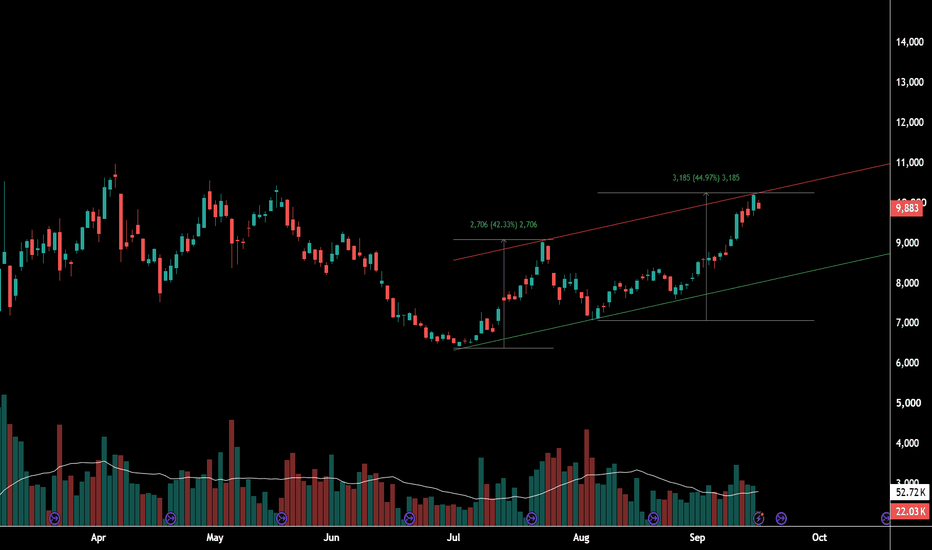
Long 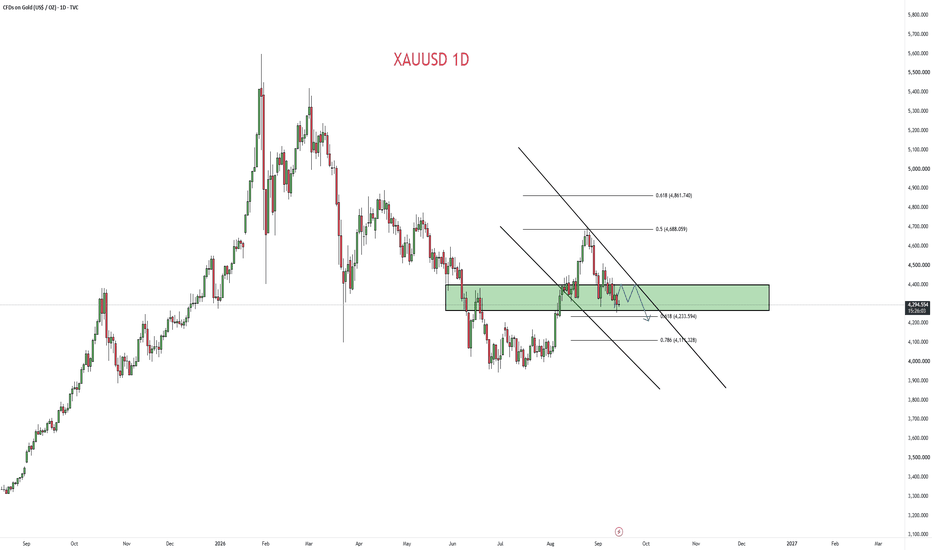
XAUUSD 15-Min Chart: Premium Supply Zone Rejection MappingOn the 15-minute timeframe, Gold (XAUUSD) has rallied into a key overhead supply block/resistance zone near the $4,343 – $4,358 region. This zone aligns with the upper boundary of a descending channel and previous structural supply following an earlier Break of Structure (BOS) and Equal Highs (EQH) sweep, presenting a potential bearish mitigation scenario.
Technical Reference Levels
Overhead Supply / Entry Zone: ~$4,343.85 – $4,349.09 (Supply Block / Channel Resistance)
Invalidation / Structural Level: ~$4,358.66 (Above the supply zone high)
Downside Target Level: ~$4,244.63 (Major lower demand / support liquidity zone)
Technical Setup Logic
Price expanded into the upper supply zone and descending trendline resistance around $4,343.85. The technical mapping outlines a potential rejection from this premium supply area to continue the broader corrective trend toward the lower support target at $4,244.63, with structural invalidation strictly placed above $4,358.66.
Disclaimer & Purpose
This post is strictly for educational, analytical, and charting practice purposes only. It is not a financial idea, trading signal, or investment advice. Always manage your own risk and perform independent research. GOLD (XAUUSD) — 4H BULLISH BREAKOUT SETUP Gold is showing a potential bullish breakout on the 4H chart after breaking above the descending trendline and reclaiming the 4,343–4,344 zone.
Price is currently around 4,345, so the key now is whether buyers can hold this breakout area as support.
📌 Trade Setup — LONG
Entry: 4,343.787
Stop Loss: 4,307.377
Take Profit: 4,401.587
Risk/Reward: ≈ 1:1.6
🔎 Why I'm Watching This Setup
🔹 Descending trendline breakout — Price has pushed above the falling trendline that had been controlling the previous move.
🔹 Support reclaim — The 4,343 area is being reclaimed after acting as a resistance zone.
🔹 Strong bullish candles — Buyers have shown increased momentum from the 4,272 support area.
🔹 Major support below — The 4,272 region remains an important structural level.
🔹 Upside target — 4,401–4,402 is the next significant resistance/target area shown on the chart.
🎯 Confirmation I'm Watching
Breakout → hold above 4,343 → successful retest → continuation toward 4,401.
If price falls back below the breakout zone and loses momentum, the setup needs to be reassessed.
Key levels:
🟢 Entry: 4,343.787
🎯 TP: 4,401.587
🔴 SL: 4,307.377
📍 Major support: 4,272.404
Gold has now moved from defending support to challenging the previous downtrend. Will buyers turn this breakout into a sustained move toward 4,400?
⚠️ Technical analysis only, not financial advice. Manage risk carefully. Long 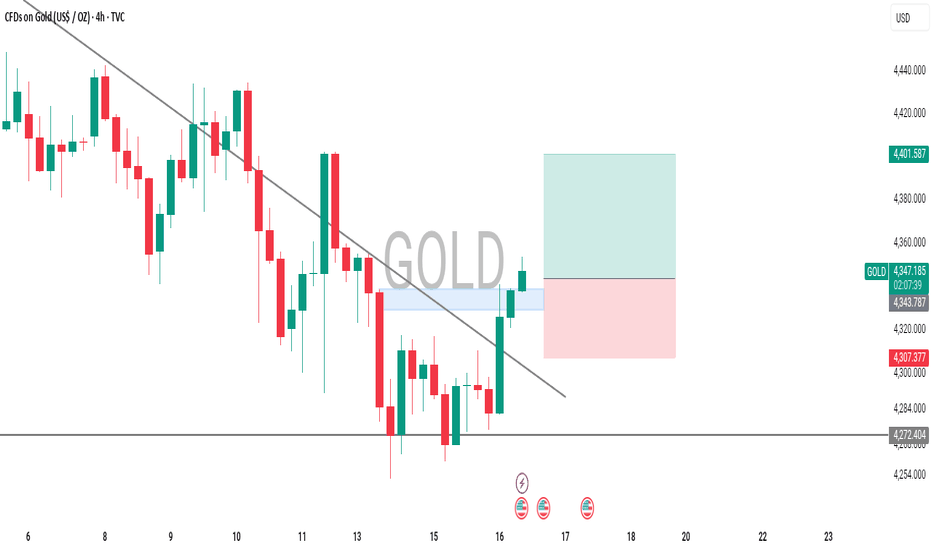
Short 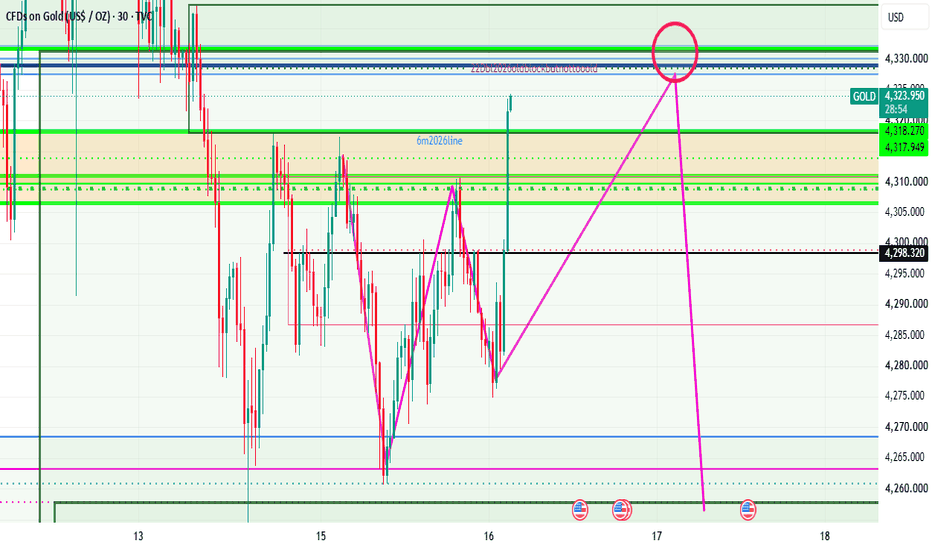
Short 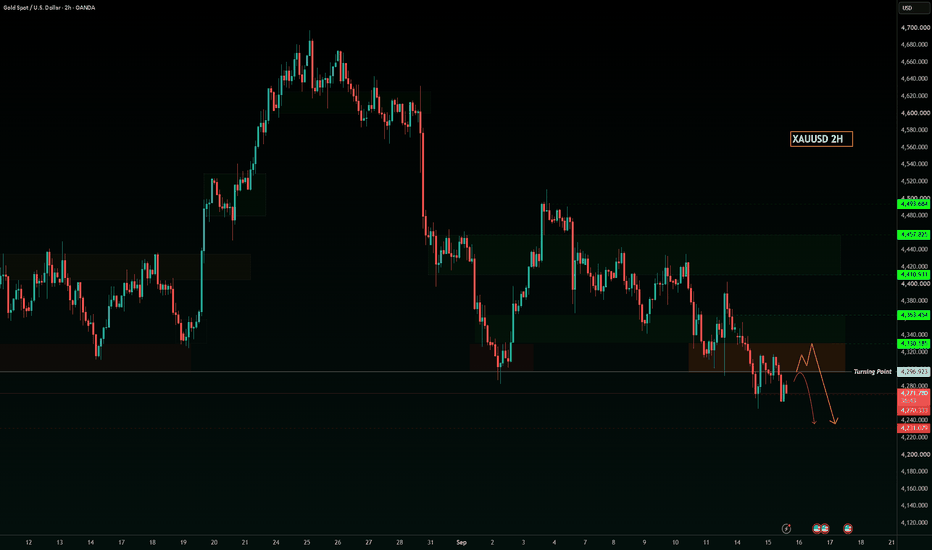
Short 
Elliott Wave Analysis – XAUUSD | September 16, 2026
H4 Timeframe
H4 momentum is currently still in the overbought zone. From a momentum perspective, the current bullish move has not yet shown the characteristics of a strong potential uptrend. When H4 momentum remains overbought, the probability of a bearish reversal is still relatively high.
Looking at the H4 chart, we can see a fairly clear Zigzag structure. However, pay attention to the connecting wave: it is a relatively strong and sharp bullish move, which is not usually a typical characteristic of a Wave B.
That said, considering that Wave A previously moved down with strong momentum and created a significant imbalance, a strong Wave B rebound to rebalance price is still entirely possible. Under this interpretation, the decline moving inside the price channel could be Wave C. If that is the case, there may still be one final bearish move to complete Wave 5.
Of course, this is only my current interpretation. In my view, fixing the wave labels at this stage is still not practical because the wave structure is not clear enough. Therefore, we should continue waiting for confirmation from price action.
We have just seen a very strong bullish candle. If this is confirmation of a 5-wave bullish trend, then this strong candle should belong to Wave 3. In that case, bullish momentum needs to continue, and price may advance toward the 4403 area.
If this happens, we will have stronger evidence of a 5-wave bullish structure. At the same time, this structure could also represent the first wave of a larger long-term bullish trend.
Volume Profile
Looking at the Volume Profile, there are currently two price levels that I have marked in red:
4316
4438
These are the boundaries of a very high-volume trading area.
If price can remain above 4316, this would be a very positive signal for the bullish trend. In that case, price could continue moving toward 4438. This development would also provide stronger confirmation of a 5-wave bullish structure in terms of both divergence and price targets.
On the other hand, if price fails to hold above 4316, a bearish move lasting at least 3–5 H4 candles could occur, potentially continuing until H4 momentum reaches the oversold zone.
Trading Focus
At this stage, we will use the 4316 area as the key level to monitor.
Around this area, we will look for either trend-continuation or reversal signals to identify potential trading opportunities. Short 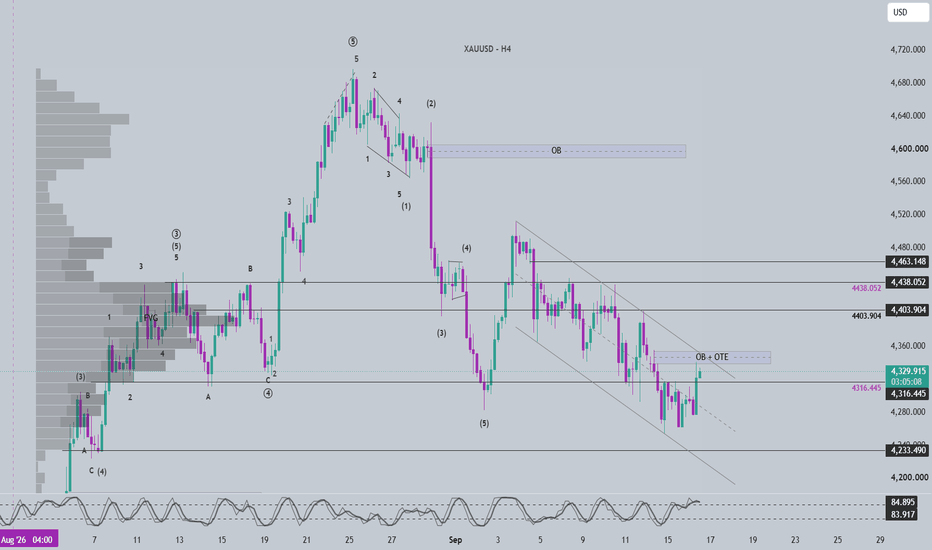
Long 
 Long
Long
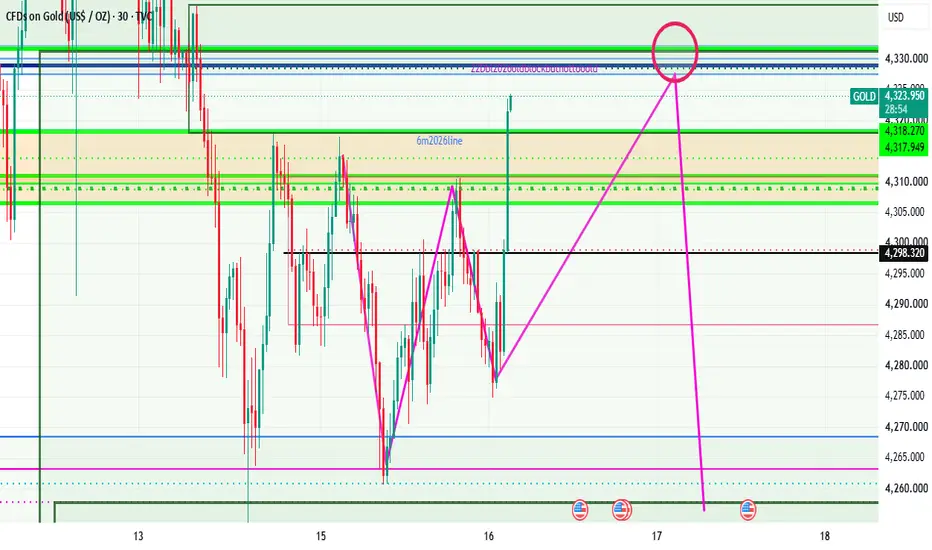
Bearish Liquidity Sweep Setup | XAUUSD 16/09Gold is trading around 4,286 on the H1 chart, consolidating inside a range between 4,260 and 4,318 after a strong bearish displacement from the 4,390–4,400 OB.
The market is currently in accumulation, but the broader H1 structure remains bearish. My expectation for today is a potential move toward the upper range liquidity before another downside expansion.
The key is to wait for confirmation at the upper liquidity rather than entering in the middle of the range.
🔎 H1 Market Structure
• The previous bearish displacement broke the earlier bullish structure and established a lower-high/lower-low sequence.
• Price is currently ranging between 4,260 and 4,318.
• The upper range liquidity around 4,307–4,318 is the main area of interest.
• The range low at 4,260 remains the first major downside objective.
• The marked OB Support around 4,230–4,240 is the extended downside zone.
💧 Main POI — Upper Range Liquidity
4,307–4,318
This is the main zone for today's setup.
I am looking for price to expand into this liquidity area, potentially sweep the range highs, and then show a bearish reaction.
No entry will be considered simply because price reaches the zone. Confirmation is required.
🎯 Today's Trading Plan — Bearish Scenario
Expected Direction: Bearish continuation after an upper liquidity sweep.
Entry Zone: 4,304–4,312
Entry Condition:
Price moves into the 4,307–4,318 liquidity zone.
A liquidity sweep or rejection develops.
M5/M15 prints bearish MSS with clear displacement.
Price retests the bearish FVG or OB created after the displacement.
Entry is considered around 4,304–4,312, only if the confirmation structure supports the entry.
Stop Loss: 4,324
The setup is invalidated if price sustains above the upper liquidity and breaks the bearish confirmation structure.
Take Profit:
🎯 TP1: 4,280 — First downside reaction area.
🎯 TP2: 4,260 — Accumulation range low.
🎯 TP3: 4,235 — OB Support area.
Trade Management:
• Secure partial profit at TP1 if price reacts as expected.
• Move SL toward breakeven only after a confirmed structural move in favor.
• TP2 is the main range objective.
• TP3 is the extended objective if the range low breaks with strong bearish displacement.
📉 Why This Setup?
The H1 structure is bearish, and the upper range liquidity provides a clear area where a potential reversal may develop.
If price sweeps 4,307–4,318 and confirms bearish MSS, the market may expand toward 4,260.
A break below 4,260 would open the possibility of a deeper move toward 4,230–4,240.
🔄 Alternative Scenario — Bullish Breakout
If price breaks above 4,318 and sustains bullish momentum:
• The bearish setup is invalidated.
• A retest around 4,310–4,318 may offer a potential bullish continuation area.
• The next upside reference is the FIBO Zone around 4,328–4,350.
• A deeper recovery toward the 4,390–4,400 OB remains possible if bullish momentum continues.
No bearish entry will be taken if the market sustains above the invalidation level.
🚫 No-Trade Zone
4,280–4,304
If price remains inside the middle of the accumulation range without reaching the main liquidity zone or providing clear confirmation, I will stay out.
The goal is to avoid entering in the middle of the range where risk-to-reward may be less favorable.
🧠 My Bias
My H1 bias remains bearish for today.
The main scenario is a potential liquidity sweep around 4,307–4,318, followed by bearish confirmation and a move toward 4,260.
The extended objective is 4,230–4,240 if the range low breaks.
The bearish idea is invalidated by sustained bullish acceptance above 4,318. Short 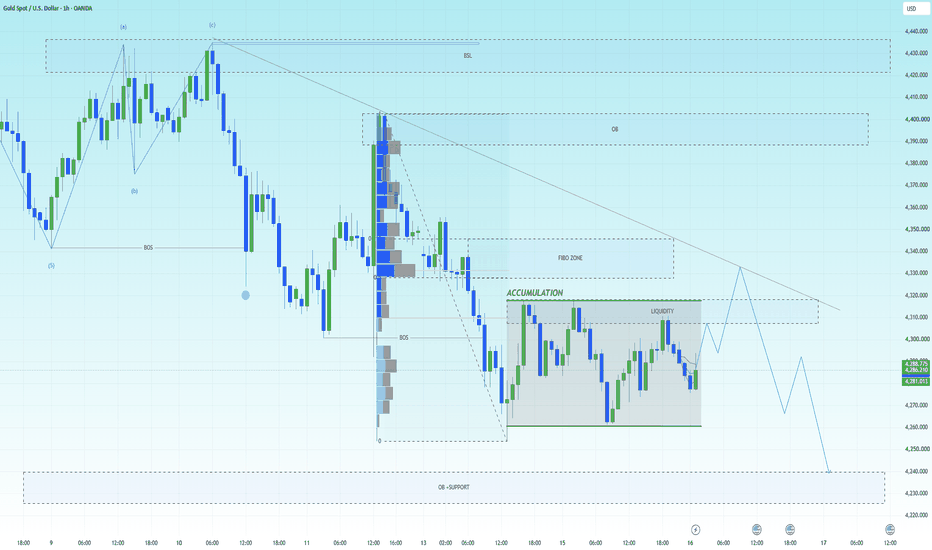
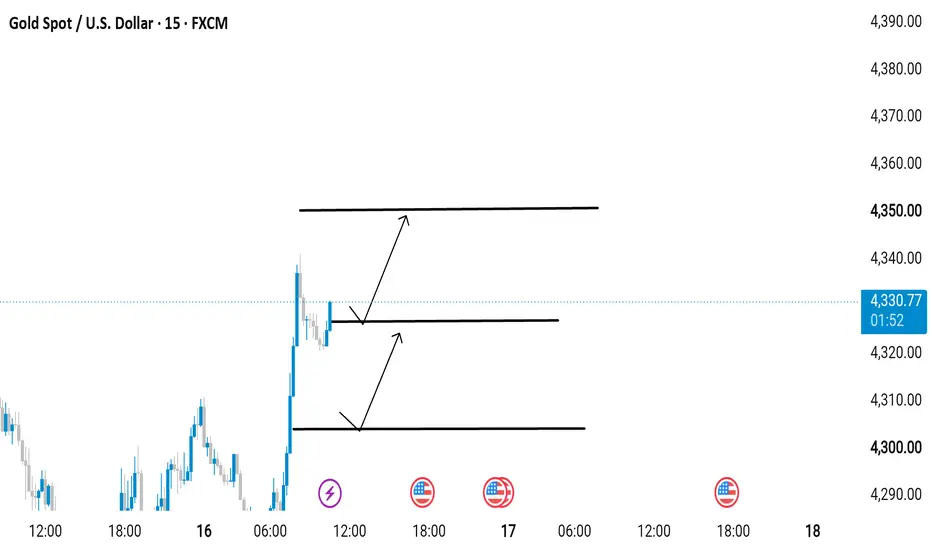
Gold May Recover If It Breaks Above 4,340📊 Market Overview:
XAU/USD is trading around 4,320–4,330 USD, recovering from the low near 4,275 USD in previous sessions. Buying pressure is improving as gold finds support following the sharp decline.
However, the USD remains elevated and the 10-year Treasury yield has moved above 5% before easing slightly, continuing to weigh on gold. The market is now closely focused on the Fed’s rate decision and Chair Kevin Warsh’s comments, which could trigger strong volatility in XAU/USD.
📉 Technical Analysis:
• Key Resistance:
4,335–4,345
4,360–4,375
• Nearest Support:
4,305–4,295
4,280–4,270
• EMA: Price is recovering above the EMA 09 on lower timeframes, indicating improving short-term buying momentum. However, the H1/H4 structure still needs a break above 4,340 to confirm a clearer recovery.
• Candlestick / Volume / Momentum:
Price has formed a strong rebound from the 4,275 area, indicating the emergence of dip-buying pressure. On M15/M30, bullish momentum is improving, but the 4,335–4,345 zone could attract profit-taking.
H1 needs to hold above 4,305 to maintain the recovery structure. If price breaks above 4,345 with increasing volume, the upside could extend toward 4,360–4,375. Conversely, a strong rejection around 4,335–4,345 followed by a break below 4,305 could bring selling pressure back.
H4 remains cautious as gold continues to be affected by a strong USD and elevated U.S. yields.
📌 Outlook:
Gold may continue to recover in the short term if it breaks and holds above 4,340–4,345. In that case, the next target could be 4,360–4,375.
Conversely, if price fails to break 4,335–4,345 and falls below 4,295, gold could retest 4,280–4,270.
💡 Suggested Trading Strategy:
🔻 SELL XAU/USD at: 4.342–4.345
🎯 TP: 40/80/200/300 pips
❌ SL: 4.350
🔺 BUY XAU/USD at: 4.295–4.292
🎯 TP: 40/80/200/300 pips
❌ SL: 4.287  Long
Long
Gold Detailed Analysis & key levelsMARKET STRUCTURE
Gold is trading around $4,390 after rebounding from the $4,342 area. The recovery remains corrective for now, with price still below major resistance and the 200-day moving average. Overall structure remains neutral-to-bearish unless buyers reclaim the $4,511–$4,538 area.
KEY LEVELS
Gold is currently trading between major support and resistance zones, with liquidity available on both sides. These levels are likely to determine the next stronger directional move.
Support: $4,342–$4,366
Major demand: $4,282–$4,311
Resistance: $4,413–$4,443
Next resistance: $4,491–$4,511
Major resistance / 200DMA: $4,530–$4,538
DXY & YIELDS
DXY remains relatively soft around 98.8, helping Gold recover, while US Treasury yields remain elevated with the 10Y near 4.8%. A DXY recovery above 99.20 combined with rising yields would increase downside pressure on Gold.
MACRO & FED
Markets remain focused on US PPI, CPI and the FOMC. Hot inflation data would likely strengthen rate-hike expectations, support Treasury yields and pressure Gold. Softer inflation data would favour a stronger upside recovery.
GEOPOLITICAL RISK
US-Iran tensions and elevated oil prices continue to provide some safe-haven support. However, higher oil prices also increase inflation concerns, creating a two-sided environment for Gold.
TRADE BIAS
Current bias: 55% bearish / 45% bullish. The preferred sell area is $4,443–$4,511, while $4,342–$4,366 remains the main reaction area for buyers. A daily close above $4,538 would strengthen the bullish case, while a break below $4,282 would favour bearish continuation.
CONCLUSION
Gold is currently recovering, but the higher-timeframe structure has not confirmed a bullish reversal. Until $4,511–$4,538 is reclaimed, rallies into resistance remain vulnerable. PPI, CPI, DXY and Treasury yields are likely to determine the next significant directional move.
Education 
 Long
Long
Short 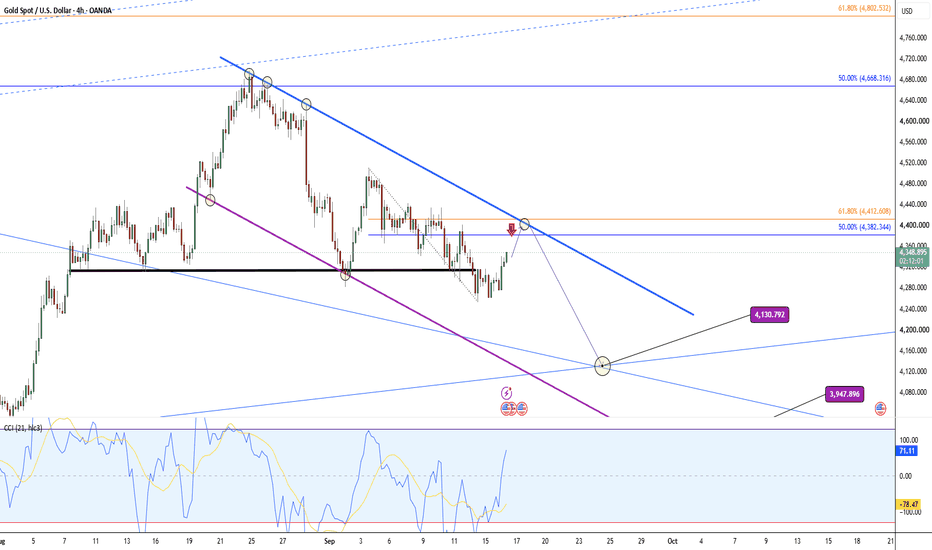
Long 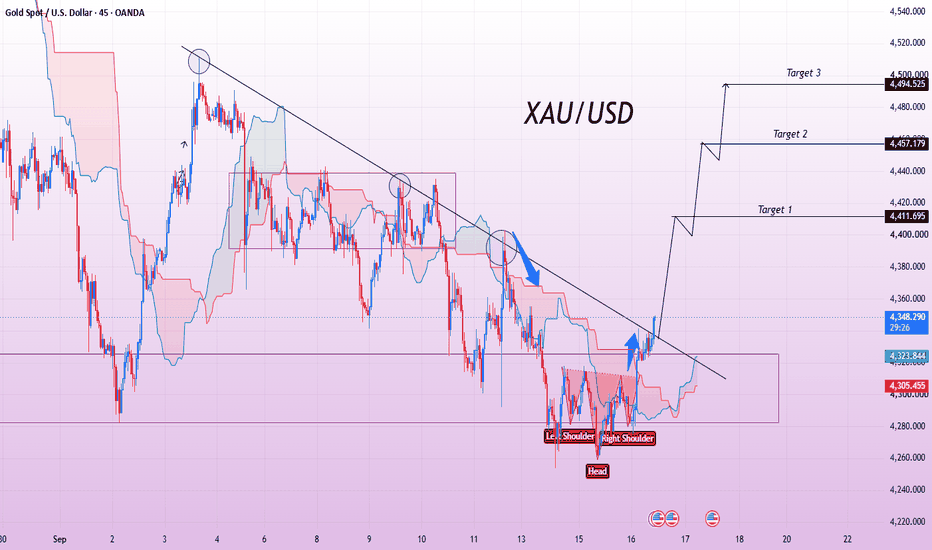
DXY, Gold (XAUUSD), & WTI Crude: Macro Elliott Wave OutlookMarket Bias: Bullish (DXY), Neutral/Bearish (XAUUSD Macro), Bullish (WTI Crude)
Analysis Breakdown:
DXY (US Dollar Index):
Macro Structure: Following the major cycle peak, DXY has carved out a solid multi-month accumulation base. We are breaking out from a large ascending triangle structure, signalling a long-term bottom.
Targets & Near-Term: A breakout above the intermediate resistance box targets 103.90, with an extended macro target between 105.00 – 105.50. Near term, expect possible pullbacks to test Fibonacci retracement levels (23.6%, 38.2%, or 50%) before continuation, particularly with upcoming FOMC and retail sales data. A favorable 12:1 R:R long setup remains valid above the base.
Gold (XAUUSD):
Tactical Wave Play: Gold broke out of the corrective descending channel following a flush-out. Tactically, we are completing a micro 5-wave triangle/diagonal structure into wave (E).
Targets: Anticipating a rally toward the $4,396 – $4,400+ liquidity zone to finish intermediate wave (B).
Macro Outlook: The larger timeframe suggests this bounce feeds a broader ABC correction or complex structure, with long-term lower targets down near $4,100 – $4,050 once wave (C) unfolds.
WTI Crude Oil (XTIOIL):
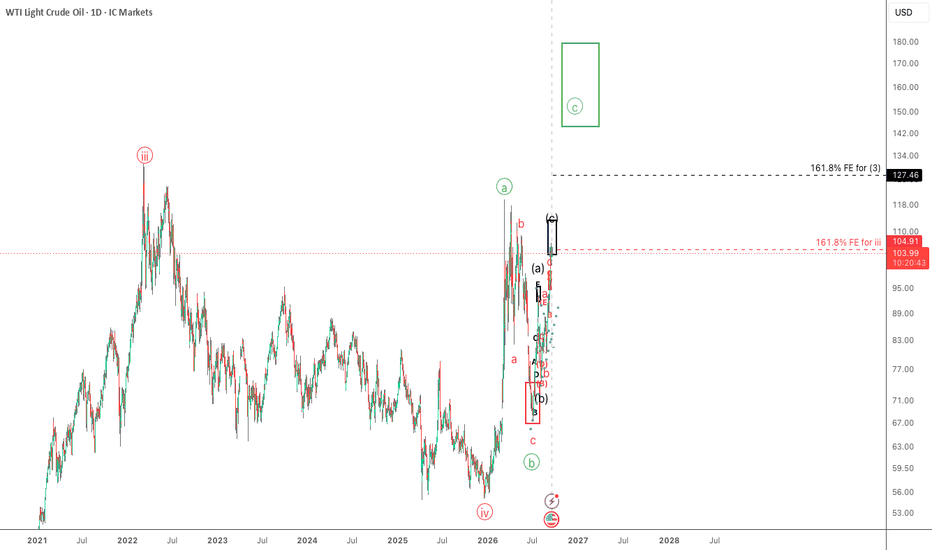
Macro Impulse: Oil has held higher lows throughout 2026 and is showing explosive upside momentum.
Projections: Currently testing intermediate resistance near $104. A minor consolidation or shallow pullback here is expected, followed by a powerful Wave (3) impulse targeting previous structural highs of $130 – $132, with Fibonacci extension targets stretching toward $144+.