Long
Long
Long 
Long 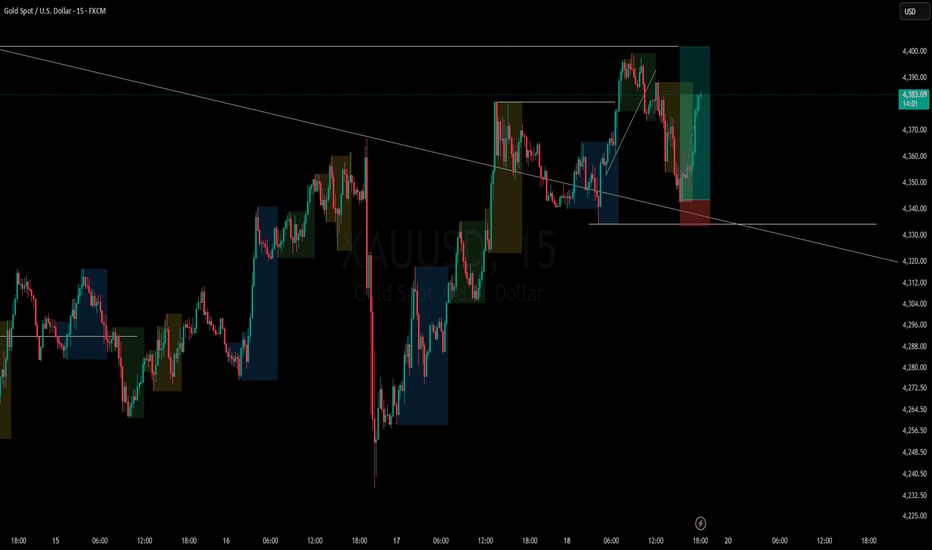
 Long
Long
Scalping - The bulls are targeting levels above 4,400.1. Market Structure — Bullish
Gold is maintaining a clear bullish trend after a strong rebound from the 4,240–4,250 zone.
EMA 9: ~4,382.6
EMA 89: ~4,337.2
EMA 9 > EMA 89 → bullish momentum remains dominant.
Price is trading above both EMA 9 and EMA 89 → buyers remain in control of the short-term structure.
Price structure is forming Higher Highs (HH) and Higher Lows (HL).
The short-term ascending trendline remains intact, supporting the continuation of the bullish trend.
🔴 2. Key Resistance
4,395–4,400: Psychological resistance and recent high.
4,410–4,415: Fibonacci 0.5 zone (~4,414.6).
4,440–4,460: Next upside target and major resistance area on the chart.
➡️ If price breaks and closes above 4,415, the probability of an extension toward 4,440–4,460 will increase significantly.
🟢 3. Support
4,380–4,385: EMA 9 + short-term support.
4,390–4,395: Fibonacci 0.618 zone (~4,391.9), currently acting as an important pivot area.
4,335–4,345: EMA 89 + major support zone.
As long as price holds above 4,380, the bullish structure remains intact.
If 4,380 is decisively broken, Gold could correct toward 4,350–4,340 before attracting fresh buying interest.
--------------
SELL GOLD zone : 4431 - 4434
SL : 4440
TP : 4405 - 4377 - 4350
----------------
Short 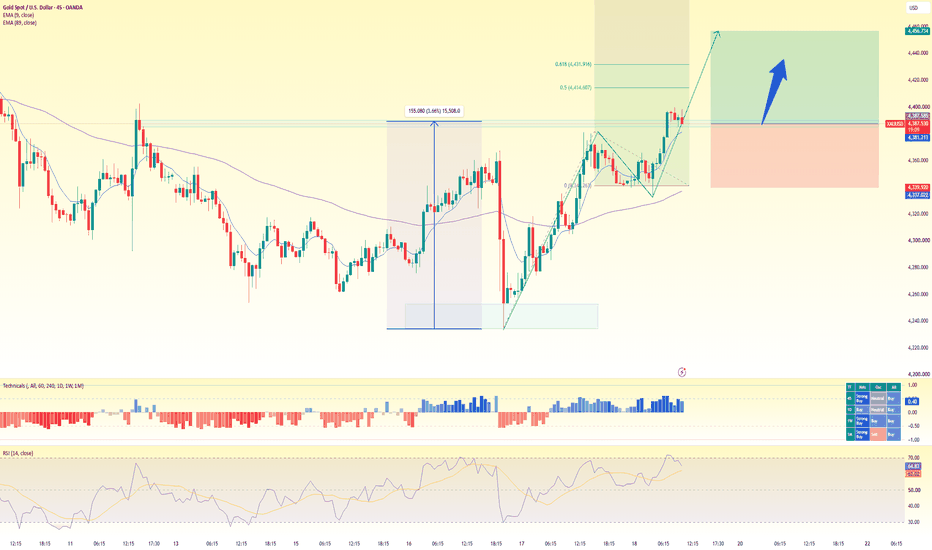
 Long
Long
Long 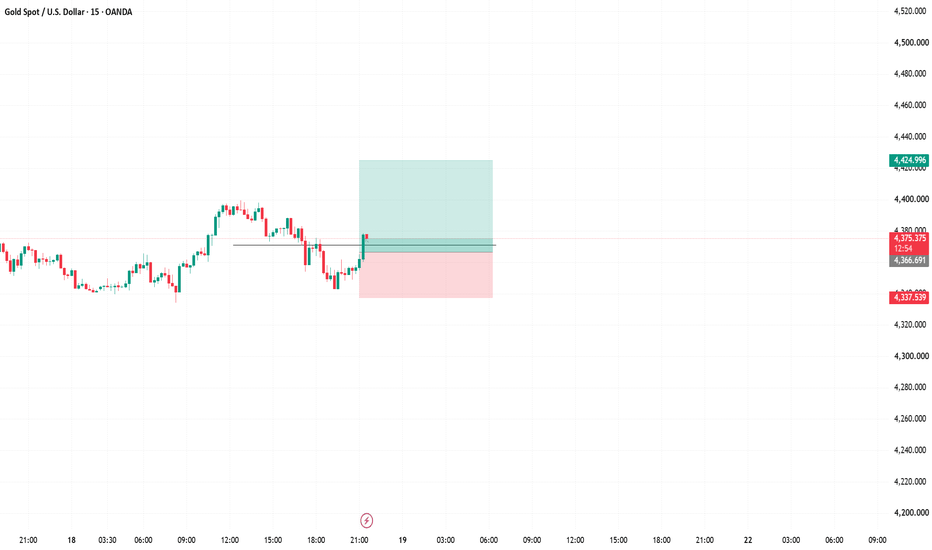
Long 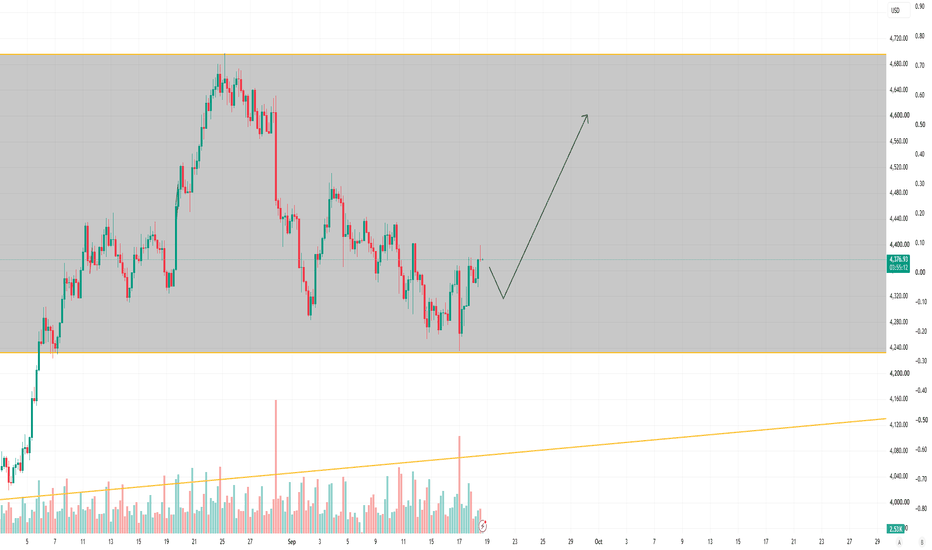
Long 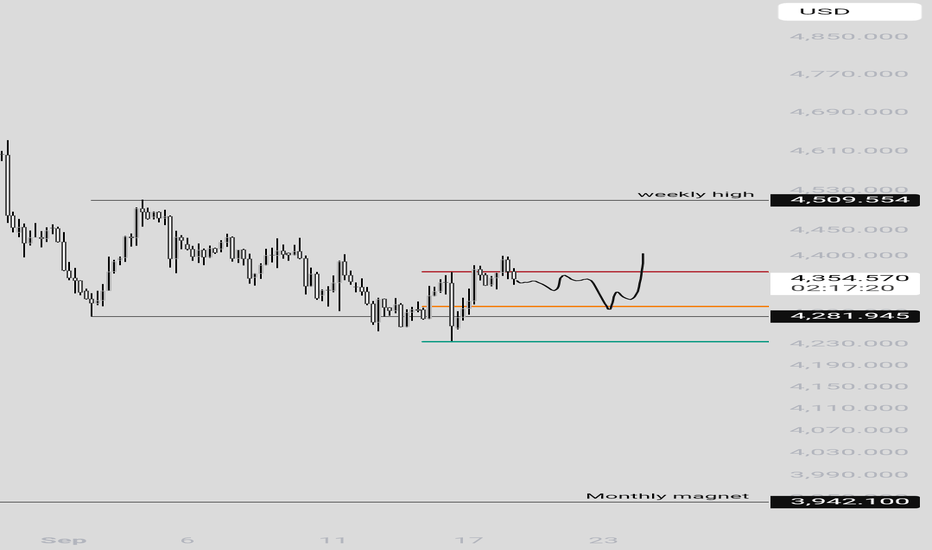
Long 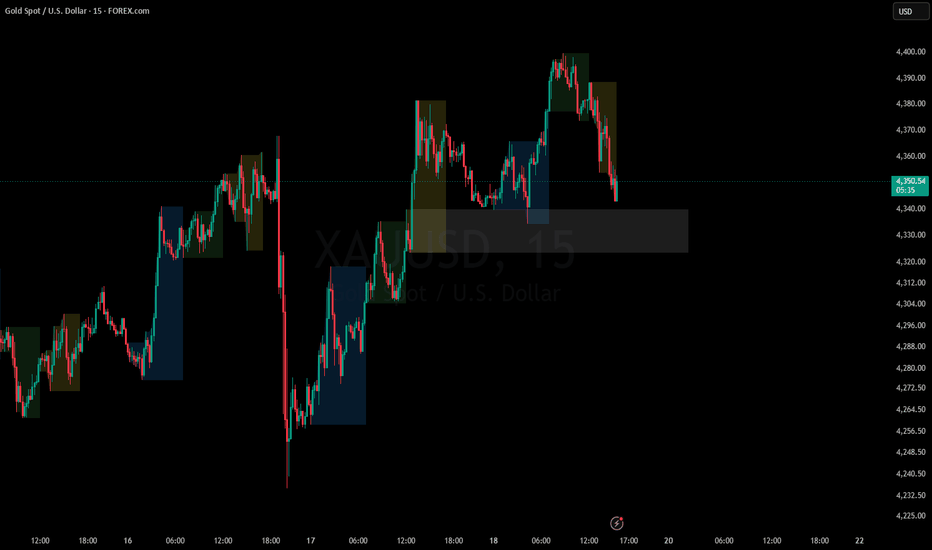
H1 Corrective Recovery Into Bearish ResistanceXAUUSD is trading around 4,310 after rebounding from the 4,254 previous-support target. The reaction confirms that buyers are defending the lower H1 structure, but the broader market remains bearish beneath the descending trendline.
The macro backdrop remains difficult for gold after the Federal Reserve raised rates by 25 bps to 3.75%–4.00%, its first hike in more than three years. The Fed also signaled that further tightening remains possible, with 16 of 18 policymakers expecting at least one additional 25 bp increase this year. The dollar index climbed to a five-week high after the decision.
Gold initially traded above 4,365 before falling more than 1% after the Fed announcement, reflecting renewed pressure from higher rates and a stronger dollar.
Technical View
The H1 structure remains inside a descending channel, with lower highs still controlling the broader direction.
However, price has reacted strongly from the lower liquidity area and is now holding the 4,280–4,310 Pullback Zone.
As long as this zone holds, a corrective recovery toward the descending trendline remains possible.
The first recovery objective sits around 4,340–4,360. Above that, the key decision area is the 4,375–4,400 Order Block, where bearish structure and dynamic resistance align.
If buyers establish acceptance above that OB, price could extend toward the 4,425–4,445 Resistance Zone.
Key Zones
Current Price: 4,309.920
Pullback / Support Zone: 4,280–4,310
First Recovery Area: 4,340–4,360
Order Block / Main Decision: 4,375–4,400
Resistance Zone: 4,425–4,445
Major Resistance: 4,470–4,490
Structural Support: 4,235–4,255
Trading Plan
Buy Priority: 4,280–4,310
Condition: wait for price to hold the pullback zone and show bullish rejection, liquidity reclaim, higher-low formation or bullish MSS confirmation.
TP1: 4,340–4,360
TP2: 4,375–4,400
TP3: 4,425–4,445
Invalidation: sustained H1 acceptance below 4,255.
Buy/Sell View
This remains a corrective long inside a broader bearish H1 structure, not confirmation of a full trend reversal.
The stronger bearish reaction area remains 4,375–4,400. If price reaches this zone and sellers regain control, the recovery should be reassessed rather than automatically expecting continuation higher.
Final View
Gold has reacted from lower structural support, but the Fed’s hawkish rate hike keeps the broader macro environment defensive.
The main scenario is a confirmed recovery from 4,280–4,310 toward 4,375–4,400. That Order Block will determine whether the rebound can expand toward 4,425–4,445 or whether sellers regain control.
Can buyers hold the pullback zone and complete the H1 recovery into the bearish Order Block? Long 
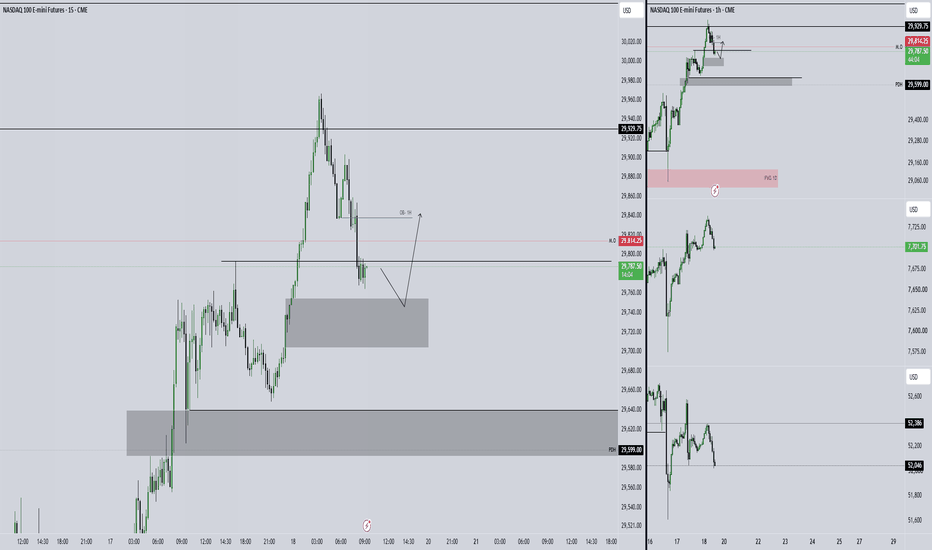
Short 
Short 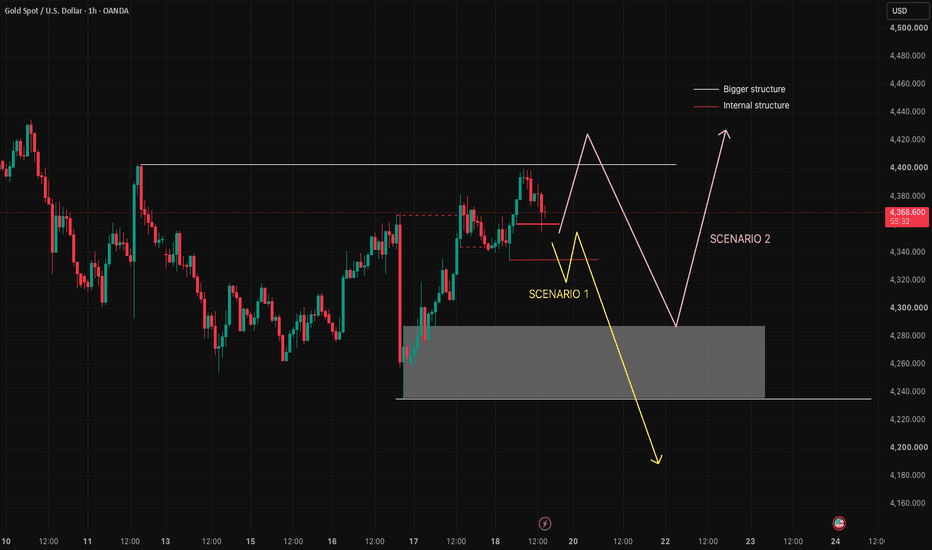
XAUUSD | 30M Timeframe | Repetition Of Structure MethodMarkets don't move randomly — they move in repeating structural blocks. Every strong impulsive move originates from a specific price range where a large quantity of orders (institutional supply or demand) was absorbed before price expanded away. This origin range is the Quantity Box (QB).
The theory behind QB is simple: when price returns to revisit a zone that shares the same structural characteristics as a previous QB (similar range size, similar consolidation behavior, similar location relative to a liquidity sweep), it tends to react the same way the original box did — because the same type of order flow (quantity) is likely sitting there again.
How a QB Forms
Consolidation/Base – Price ranges sideways for a period, building a box of roughly equal highs and lows. This represents accumulation or distribution — a quantity of resting orders.
Liquidity Sweep (L-Sweep) – Before the real move, price often wicks below (or above) the box to grab stop-loss liquidity and trap late sellers/buyers. This sweep is a key confirmation that the box is "loaded."
Expansion – Price then explodes away from the box in the opposite direction of the sweep, leaving the QB as the origin of the impulsive leg.
Repetition – On the retracement leg, price often returns to a new zone with the same structural DNA (same box-size ratio, similar sweep-then-reversal pattern) as the original QB. This is where the pattern is expected to repeat.
Applying It to the Chart
On the left, the first gray box marks the original consolidation/QB where price accumulated before expanding higher.
Price rallied, pulled back sharply, and is now forming a second, smaller gray box — structurally repeating the first QB, accompanied by an L-SWEEP (liquidity grab) below the range.
A small zig-zag pattern near the sweep confirms stop-loss liquidity was taken before the expected reversal.
The marked zone (green candle) is where a bullish reaction is anticipated — the same way the first QB launched the prior rally, this QB is expected to launch the next leg up, provided a bullish confirmation pattern prints there (hence the "Need Bullish Pattern Here" note).
An invalidation level is also marked below (green circle) — "Incase Market Goes Down" — should the bullish QB fail to hold and price breaks further down along the descending trendline.
Key Rules for Identifying a Valid QB
Look for a clear range/box with defined highs and lows (not random noise).
A liquidity sweep beyond the box boosts validity — it shows stops were cleared before reversal.
Compare the box's proportions (height relative to the preceding move) to prior boxes on the same chart — structural repetition, not just visual similarity, is the key.
Wait for a confirmation candle/pattern (engulfing, pin bar, break of internal structure) inside or at the edge of the new QB before treating it as active — the box alone isn't an entry signal, it's a zone of interest.
Always mark an invalidation/alternate scenario level, since a QB that fails to hold can lead to continuation in the opposite direction. Long 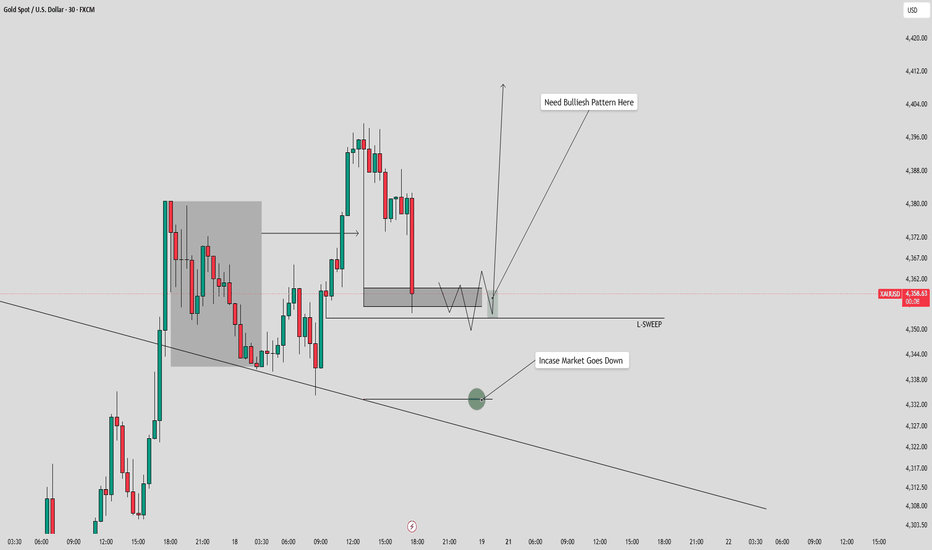
Long 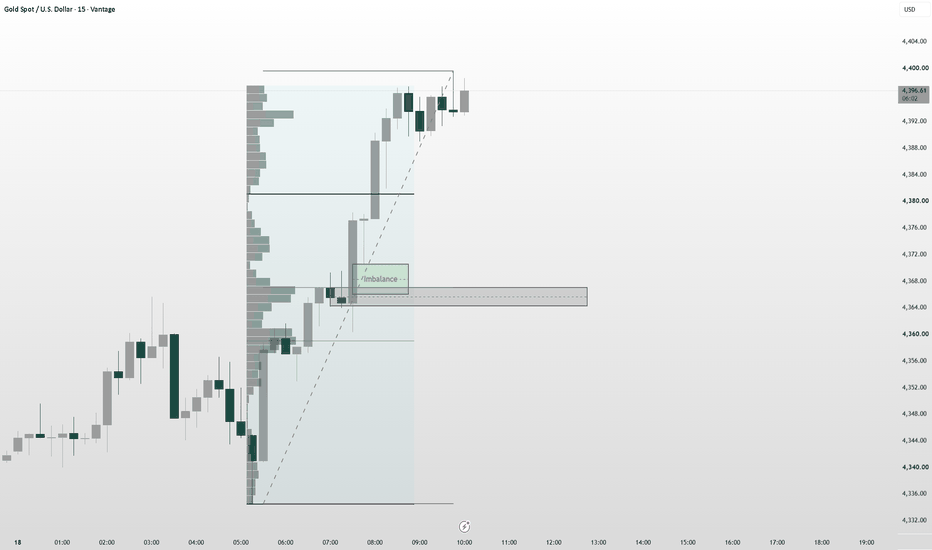
Gold lost its short-term value area but 4371 has not given wayOANDA:XAUUSD - US session read from my KenKem Master Volume Profile (MVP) indicator & strategy.
CONTEXT
Gold is up about 1.6% on the day and trades above the session VWAP near 4371, with the 15m EMA stack fanned upward and the net-volume read still leaning to the buy side. On the 5m profile, however, price has just slipped out of its local value area and is working back toward the master Point of Control, so the higher timeframe and the lower timeframe currently disagree. The US session opens shortly.
KEY ZONES
- Resistance / supply: 4388.6, then the session high at 4399.7
- Support / demand: 4371 (VWAP), then 4368.6, then 4360.6
- Point of Control (volume magnet): near 4364 on the 15m profile
SCENARIOS (to watch - NOT signals)
Bullish: hold above 4371 -> room toward 4388.6 then 4399.7 (trend structure and buy-side net volume intact).
Bearish: lose 4371 on a closing basis -> opens 4368.6 then 4360.6 (value-area rejection, VWAP lost).
Range/unclear: stuck between 4371 and 4388.6 -> stand aside until a decisive close.
Invalidation: a close beyond 4360.6 voids this map.
WHAT THE MVP TOOL IS SHOWING
The Master Volume Profile plots rolling value areas (VAH/VAL), the Point of Control, and a net-volume pressure read to locate where volume is building or drying up. This idea is the qualitative output of that tool; the strategy's internal thresholds, gating and entry/exit logic are not disclosed.
Built with the KenKem Master Volume Profile indicator & strategy.
Technical analysis only, by KenKem's algorithm - NOT financial advice. Trade your own plan and manage your risk.
XAU/USD Bullish Rebound | Support Holds, 4,410 Target in FocusXAU/USD 15M Analysis — BUY Setup 📈
Bias: Bullish
Current price: ~4,374
Entry zone: 4,368.5–4,369.0
Support: 4,368–4,369
Stop Loss: 4,348.8
Target: 4,410
Technical View
Price is pulling back into the marked support zone around 4,368–4,369.
The recent structure shows a strong bullish move followed by a retracement, making the support area important for a potential continuation.
A bullish reaction/rejection from support would strengthen the long setup.
4,400–4,410 is the major upside target/resistance area.
A decisive 15M close below 4,348.8 would invalidate the setup.
Risk/Reward: approximately 1:2 from the marked entry to target.
Trade idea: 🟢 BUY on confirmation around 4,368–4,369 → SL 4,348.8 → TP 4,410. Long 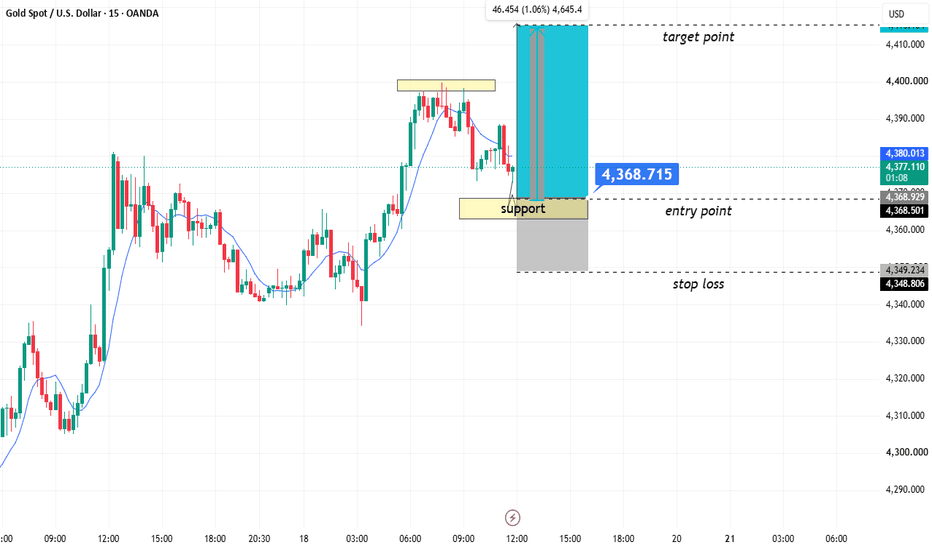
XAU/USD Breakdown: From SBR Retest to Resistance Zone 2 XAU/USD (Gold) 4-Hour Bullish Continuation
The 4-hour chart for Gold (XAU/USD) shows a bullish trend reversal following a solid double-bottom reaction near key support levels. After testing lower demand near Support Zone 2 (~4,240–4,260) and holding above Support Zone 1 (~4,300–4,320), price structured a shift in market character (CHoCH) followed by consecutive Breakouts of Structure (BoS) to the upside. Price is currently holding above the flipped Support/Resistance (SBR) level around 4,370–4,390
Technical Reasons for Buying
Strong Double-Bottom Defense at Support Zone 2: Price tested the major lower liquidity area at Support Zone 2 (~4,240.00 – 4,260.00) twice (around Sep 11–12 and Sep 15–16), establishing a solid base and showing clear buyer absorption.
Market Structure Shift (CHoCH): Following the bounce off Support Zone 2, price pushed above local lower highs, creating a Change of Character (CHoCH) that signals an early reversal from a bearish retracement back into a bullish trend.
Break of Structure (BoS) Confirmations: Price broke out above the minor internal resistance and validated a Break of Structure (BoS) past the recent Support-Become-Resistance (SBR) zone near 4,370.00–4,380.00.
Bullish Market Dynamics (Higher Highs & Higher Lows): The price action projects a classic pullback-and-continuation pattern: a minor retest of the broken SBR level before expanding upward toward Resistance Zone 1 (~4,440.00) and higher into Resistance Zone 2 (~4,510.00). Long 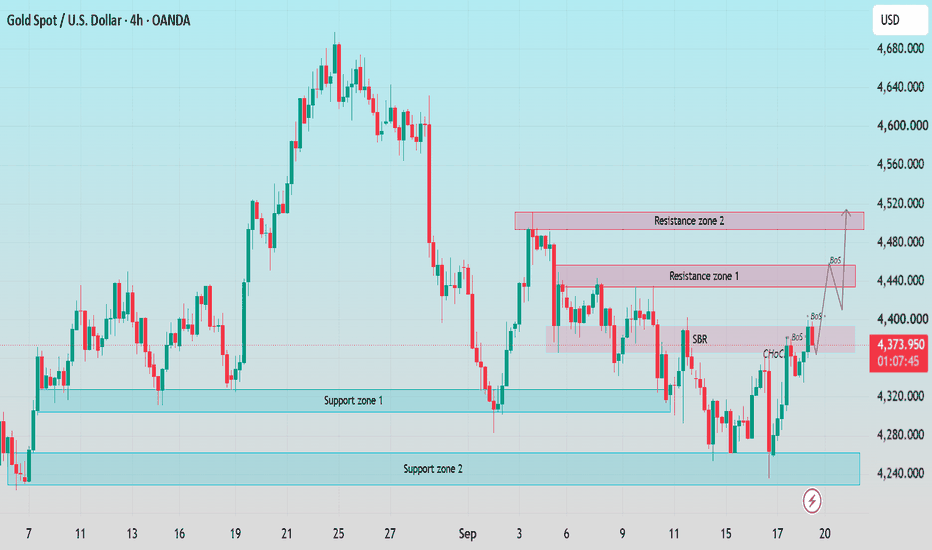
XAUUSD: Gold Is Climbing a Ladder. 4,380 Is the Missing StepGold has already done the difficult part.
It survived the violent move toward 4,235–4,260, rebuilt from the bottom and pushed back into the 4,350s.
But I would not call this a completed bullish reversal yet.
Look at today's H1 chart differently.
Forget the candles for a moment.
Gold is climbing a ladder.
4,305 → 4,320 → 4,333 → 4,350 → 4,380
The first four steps have already attracted buyers.
The last one has not been taken.
And that final step may decide whether Gold simply continues recovering — or makes a serious attempt at 4,415–4,435.
🪜 THE LADDER IS TELLING US WHERE BUYERS ARE HIDING
The recovery from approximately 4,260 has been surprisingly organized.
Instead of one vertical spike followed by an immediate collapse, Gold has created higher reactions while respecting several Fibonacci retracement levels.
The important ones on my chart are approximately:
4,305
4,320
4,333
4,350
Price has now returned above 4,350 after pulling back into the lower part of this ladder.
That matters.
The recent CHOCH around 4,365–4,370 also tells us that the market has already challenged the previous short-term bearish sequence.
But CHOCH alone is not enough for me.
There is still unfinished business above.
4,380 is the missing step.
🚪 4,380 IS NOT MY TARGET. IT IS MY PERMISSION LEVEL.
This distinction is important.
If Gold reaches 4,380 and immediately gets rejected, buyers have climbed the ladder but failed at the door.
I do not want to chase that.
What I want is an H1 candle closing above 4,380, followed by price holding the 4,370–4,380 area on a retest.
That would give me the cleaner continuation trade.
Breakout BUY Entry: 4,372–4,380 after H1 close above 4,380 + retest
Stop Loss: 4,350
TP1: 4,400
TP2: 4,415
TP3: 4,430–4,435
Why does TP3 matter?
Because the large zone around 4,415–4,435 is where the chart places the next major supply/target area.
If 4,380 becomes support, that zone stops looking distant.
It becomes the next destination.
🟢 BUT I DO NOT NEED 4,380 TO BUY
There is another trade I actually like more if Gold gives it to us.
A pullback.
Current price is sitting around the 4,350s, and underneath it we have a cluster around 4,330–4,350.
That is where I want to see whether today's buyers are real.
If Gold pulls back into 4,335–4,350, refuses to close below 4,330 and then reclaims 4,350, I would treat it as a continuation dip rather than the beginning of another sell-off.
Pullback BUY Entry: 4,340–4,350 after bullish H1 rejection
Stop Loss: 4,325
TP1: 4,370
TP2: 4,380
TP3: 4,415
This trade has one very simple condition:
4,330 must survive.
I do not want to buy a falling candle simply because Fibonacci says support is nearby.
Let the candle prove the level first.
🟥 NOW TURN THE LADDER UPSIDE DOWN
Here is where the chart becomes interesting.
The same levels helping buyers can become evidence against them.
Suppose Gold cannot break 4,380.
Price falls through 4,350.
Then 4,333 disappears too.
At that point, I am no longer looking at a healthy bullish pullback.
The ladder is breaking from the top down.
For me, an H1 close below 4,330 is the warning that today's bullish continuation idea has failed.
I would then wait for Gold to come back toward 4,330–4,340.
If that retest fails, I want the short.
SELL Entry: 4,330–4,340 after H1 breakdown + failed retest
Stop Loss: 4,355
TP1: 4,305
TP2: 4,282
TP3: 4,260
That last target is important.
4,260 is where this entire recovery began.
If price returns there after losing 4,330, buyers will have surrendered a large part of their progress.
🪤 THERE IS ONE TRADE I WILL NOT TAKE
Gold spikes to 4,375–4,380.
Everyone sees the breakout coming.
Then the H1 candle closes back below 4,365.
That is not my signal to BUY harder.
That is a potential trap.
If this happens, I would consider a rejection short:
Rejection SELL Entry: 4,365–4,375
Stop Loss: 4,388
TP1: 4,350
TP2: 4,333
TP3: 4,305
But this setup disappears immediately if Gold gets an H1 close above 4,380 and successfully holds the level.
I do not want to short strength after resistance has already become support.
🗺️ IF THE CHART LOOKS COMPLICATED, USE THIS MAP
You can ignore most of the drawings and remember just three numbers:
4,330 — the safety net.
Above it, the recovery remains healthy.
4,380 — the locked door.
Break and hold it, and buyers earn access to the upper target.
4,415–4,435 — the destination.
This is where I expect the next serious test if bullish continuation succeeds.
So today's market does not require a prediction.
It requires Gold to complete the ladder.
Hold 4,330 → reclaim 4,380 → 4,415–4,435 becomes available.
Or:
Lose 4,330 → fail the retest → 4,305, 4,282 and potentially 4,260 return to the map.
Right now, buyers have done enough to deserve attention.
They have not done enough to deserve blind trust.
The question for today: does Gold finally unlock 4,380 — or is the last step exactly where the ladder breaks? Long 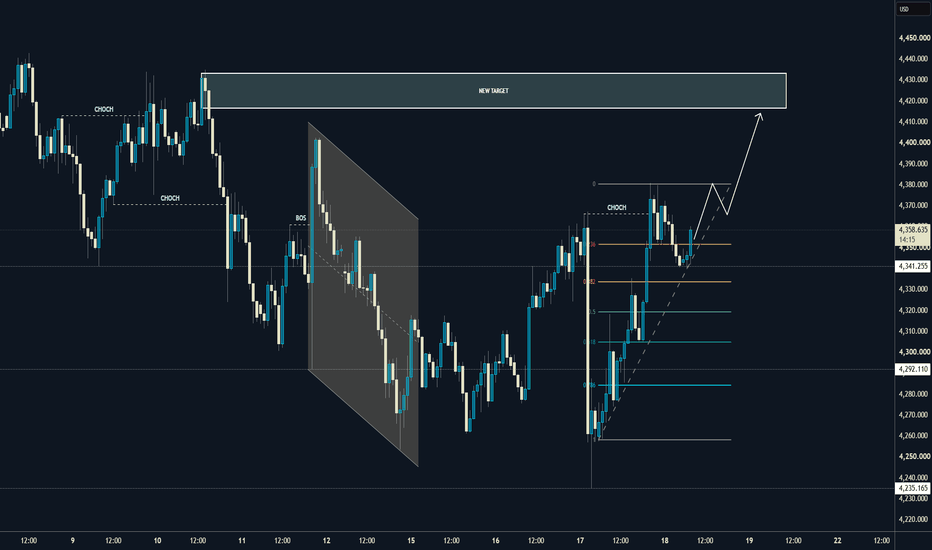
 Long
Long