Short
Short
XAUUSD – Bullish Breakout & Upside Continuation Setup📊 XAUUSD – Bullish Breakout & Upside Continuation Setup
🔍 Market Overview
Gold is showing a constructive recovery on the 2H timeframe after bouncing strongly from the 4,260–4,271 support zone. Price has formed a higher-low structure and is now consolidating beneath the 4,360 resistance area, while the ascending trendline continues to provide dynamic support.
The current structure suggests that buyers are attempting to regain control. A confirmed breakout above the 4,360 resistance could open the way toward the next upside levels.
📈 Market Structure Insight
* Market Bias: Bullish
* Momentum: Improving
* Current Phase: Bullish Recovery / Breakout Setup
The rising trendline combined with the recent rebound from support indicates that buyers are defending lower levels. Price compression near resistance could lead to an upside expansion if the breakout is confirmed.
🚀 Trading Scenarios
✅ Bullish Scenario — Primary Bias
Conditions:
* Price holds above the ascending trendline.
* Buyers continue defending the recent higher-low structure.
* Price breaks and sustains above the 4,360 resistance area.
* Bullish momentum continues above the breakout zone.
Trade Plan:
Look for buying opportunities on a controlled pullback toward the breakout area or after a confirmed bullish continuation move.
🎯 Target 1: 4,400
🎯 Target 2: 4,435
❌ Bearish Invalidation Scenario
Conditions:
* Price fails to break above the 4,360 resistance.
* Strong rejection develops from the upper structure.
* Price breaks below the ascending trendline.
* The 4,260–4,271 support zone is decisively lost.
A confirmed breakdown below the major support area would weaken the bullish structure and could trigger a deeper corrective move.
🎯 Key Support Zone: 4,260 – 4,271
📍 Key Levels to Monitor
🟢 Immediate Resistance: 4,360
🟢 Target 1: 4,400
🟢 Major Target: 4,435
🔴 Immediate Support: 4,271
🔴 Major Support: 4,260
⚠️ Trading Perspective
The overall structure remains constructive as long as Gold respects the ascending trendline and holds above the 4,260–4,271 support zone.
A decisive breakout above 4,360 would provide additional confirmation for bullish continuation toward 4,400, followed by 4,435.
However, a clear breakdown below the major support zone would invalidate the current bullish structure and require a reassessment of the setup.
🧠 Professional Insight
This setup is supported by:
* Strong reaction from the support zone.
* Ascending trendline support.
* Higher-low recovery structure.
* Price compression beneath resistance.
* Improving bullish momentum.
* Clear upside objectives at 4,400 and 4,435.
Preferred approach: Avoid chasing price directly into resistance. A confirmed breakout and retest, or a controlled pullback toward dynamic support, can provide a more structured continuation setup.
🛡️ Risk Management
* Risk only 1–2% of trading capital per position.
* Define invalidation before entering.
* Keep stop-loss below the relevant support structure.
* Avoid excessive leverage during high-volatility sessions.
* Wait for confirmation rather than entering solely on anticipation.
* Maintain disciplined position sizing throughout the trade.
Disclaimer: This market analysis is provided for educational purposes only and should not be considered financial or investment advice. Long 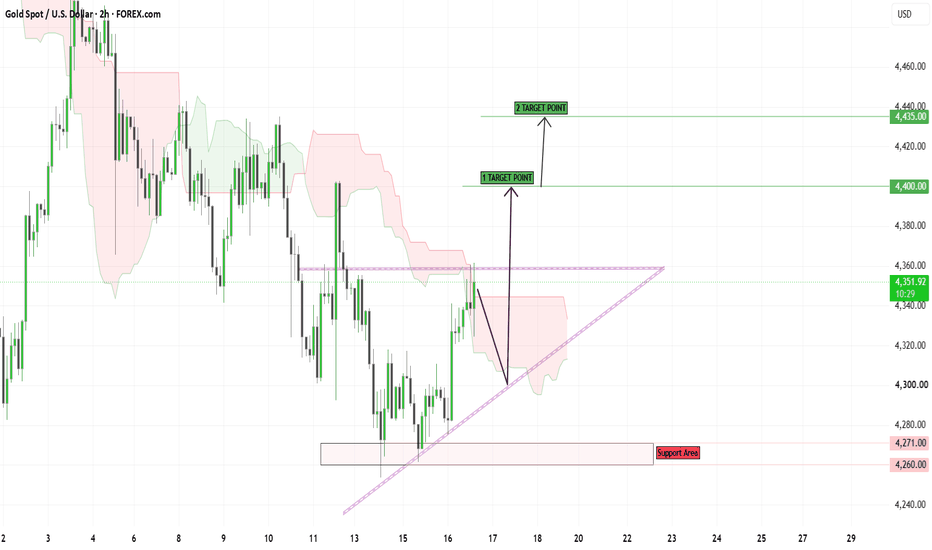
Gold is strong sell pressure after reach major resistance areaXAUUSD GOLD — BEARISH MARKET ANALYSIS
Timeframe: 1H
Market: XAUUSD / GOLD
Bias: Bearish / Sell
MARKET VIEW
Gold is currently showing a bearish market structure, with strong selling pressure developing after price reached a major resistance area.
The key resistance zone is identified between 4314 – 4303. Price tested this area and was rejected strongly, showing that sellers are actively defending the zone.
Following the rejection, Gold delivered a strong bearish move and generated a clear selling opportunity around the 4288 entry area.
The rejection from resistance, combined with the strong bearish momentum, supports the current short-term bearish market view on the 1-hour timeframe.
🔴 KEY RESISTANCE ZONE
Resistance Area: 4314 – 4303
This zone is important because price previously showed strong rejection from the area. As long as Gold remains below this resistance region, sellers may continue to control the short-term structure.
A sustained move back above the resistance zone would require reassessing the bearish setup.
SELL ENTRY
Sell Entry: 4288
The entry is based on the bearish reaction following the rejection from the 4314–4303 resistance zone and the subsequent downside momentum.
TECHNICAL TARGETS
TP1: 4262
TP2: 4249
TP3: 4232
These levels represent potential downside areas where price may react or where traders may consider securing partial profits according to their own risk-management plan.
TECHNICAL REASONING
• Strong rejection from 4314–4303 resistance
• Bearish momentum after the rejection
• Selling pressure visible on the 1H timeframe
• Sell setup activated around 4288
• Potential continuation toward lower support/target areas
• Bearish view remains valid while price respects the key resistance region
RISK MANAGEMENT
This is a technical market analysis, not a guarantee of future price movement. Gold can be highly volatile, especially around major economic news and market sessions.
Always use proper risk management, control position size, and avoid risking more than you can afford to lose. Consider securing partial profits as price approaches each target.
FINAL MARKET VIEW
XAUUSD is showing a bearish setup after a strong rejection from the 4314–4303 resistance zone. With bearish momentum confirmed around the 4288 sell area, the next potential downside levels are 4262, 4249, and 4232.
Understand the market view. Trade with a plan. Manage your risk.
#XAUUSD #GOLD #GoldAnalysis #Forex #ForexTrading #TechnicalAnalysis #PriceAction #MarketStructure #Resistance #BearishTrend #SellSignal #TradingView #TradingEducation #RiskManagement #ReubenMilesIf you want, I can also make a short professional TradingView comment for this setup. Short 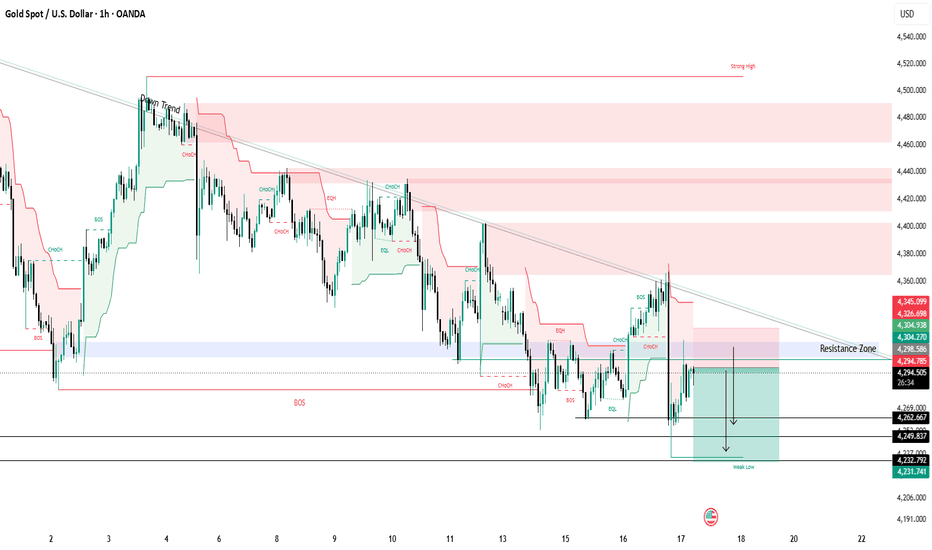

Short 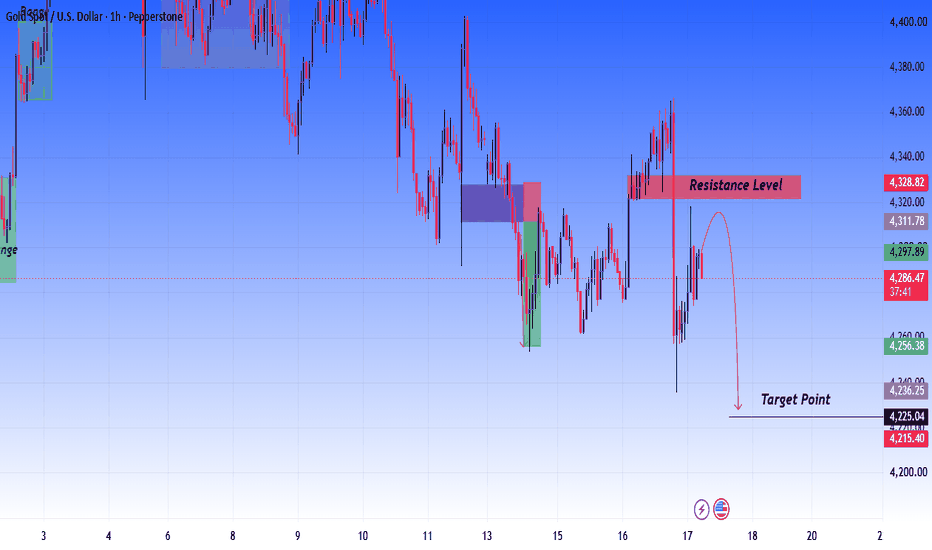
Short
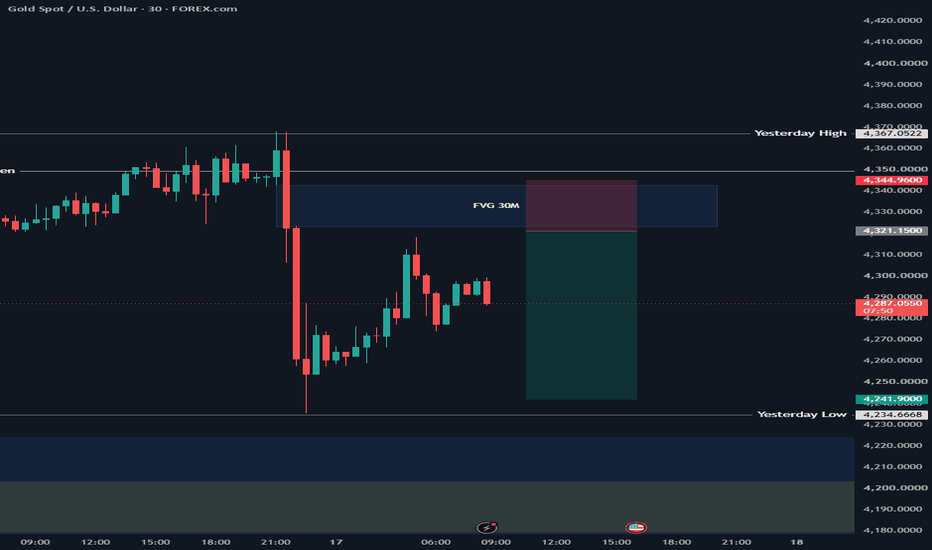
Long 
Long 
XAUUSD H1: Gold Is Rising Into a Trap, Not a BreakoutGold has finally produced a strong H1 recovery from the lows.
That sounds bullish.
The problem is that 4,328 is not where I want to buy it.
Price has already escaped the small demand area around 4,260–4,278, reclaimed the short-term EMAs, and is now accelerating higher. But directly above current price sits the most important feature on today's chart: the 4,340–4,380 IFVG.
So instead of asking whether Gold is going up or down, I am asking a different question:
How does Gold behave once this rally enters 4,340–4,380?
That answer will decide my trade.
The chart has a “red corridor”
Think of 4,340–4,380 as a corridor that buyers now have to cross.
The lower door is around 4,340–4,345.
Inside the corridor sits the H1 EMA200 near 4,362.
The upper door is around 4,380.
This combination matters because Gold is still recovering inside a broader bearish H1 structure. A rally into this area can therefore do one of two very different things:
get absorbed by sellers and rotate lower,
or
eat through the remaining supply and turn the recovery into something much larger.
I do not need to guess which one.
I can let 4,340–4,380 show me.
My first trade actually begins with doing nothing
At approximately 4,328, I am not interested in chasing the current bullish candle.
Buying here means buying directly underneath resistance.
Selling here means trying to stop momentum before it has even reached resistance.
Neither gives me the location I want.
I would rather watch Gold travel another 15–30 dollars and trade the reaction.
If the red corridor rejects Gold
I want to see price trade into 4,345–4,365 and fail there.
A wick alone is not enough.
My trigger is an H1 rejection followed by a close back below 4,340. That would tell me buyers reached supply but could not establish acceptance inside it.
Then I have a trade.
SELL — FAILED AUCTION
Entry: 4,338–4,345 after H1 rejection
SL: 4,368
TP1: 4,305
TP2: 4,280
TP3: 4,265
TP4: 4,255
The interesting part is TP3.
That takes us directly back to the small order block around 4,260–4,278, where buyers recently defended price.
So I would not automatically expect Gold to collapse through it.
That area gets another vote.
4,260–4,278 could become the best BUY location on this chart
Here is where today's plan becomes less obvious.
A rejection from the IFVG does not mean I remain bearish all the way down.
If Gold falls back toward 4,260–4,278, I will watch how it arrives.
If sellers sweep 4,260, but price refuses to stay below the nearby 4,253 support and then produces an H1 close back above 4,278, I would treat that as a failed breakdown.
That creates a completely different trade.
BUY — LIQUIDITY SWEEP
Entry: 4,275–4,282 after reclaim
SL: 4,248
TP1: 4,305
TP2: 4,340
TP3: 4,360
TP4: 4,378
Why buy after a drop?
Because the trade is not based on price being “cheap.”
It is based on sellers being given the opportunity to break support — and failing to do it.
That distinction matters.
There is one scenario where I will not wait for 4,270
Gold may simply keep climbing.
If that happens, 4,380 becomes the permission level.
I do not want to buy the first candle that spikes above it.
I want an H1 close above 4,380, followed by a pullback that holds approximately 4,360–4,380.
That would achieve two things at once:
Gold would clear the entire IFVG, and price would reclaim the EMA200 rather than merely touching it from underneath.
That is a much stronger bullish message than today's bounce alone.
BUY — IFVG FLIP
Entry: 4,370–4,382 after successful retest
SL: 4,345
TP1: 4,400
TP2: 4,420
TP3: 4,440
TP4: 4,475
And now TP4 makes sense.
There is a much larger H1 Order Block waiting around 4,475–4,495.
If Gold genuinely escapes the red corridor, that upper supply becomes relevant again.
Not before.
There is one price bulls cannot afford to lose
4,253.
The chart already shows buyers defending the 4,260 area, and the latest rally started from just above this floor.
An H1 close below 4,253 would tell me something has gone wrong with that defense.
In that case, I would forget about trying to buy another dip at the small OB.
I would wait for 4,253–4,265 to be retested from underneath.
SELL — SUPPORT FAILURE
Entry: 4,250–4,260 after bearish retest
SL: 4,280
TP1: 4,230
TP2: 4,205
TP3: 4,180
This is the scenario where today's recovery becomes irrelevant.
The floor has failed. The map changes with it.
Forget bullish or bearish. Read the sequence.
Today's chart can be reduced to a simple journey:
4,328 → 4,340 → 4,362 → 4,380
If Gold starts failing along that journey, I look back toward 4,280–4,260.
If Gold completes the journey and turns 4,380 into support, I stop fading the rally and look toward 4,400–4,440, with 4,475–4,495 becoming the bigger destination.
And if everything reverses and 4,253 breaks, the bullish recovery loses its foundation.
That is why I am not choosing BUY or SELL at 4,328.
The current rally is only the invitation.
The reaction inside 4,340–4,380 is the actual trade.
Would you rather SELL the IFVG rejection or wait for 4,380 to flip and BUY the breakout? Long 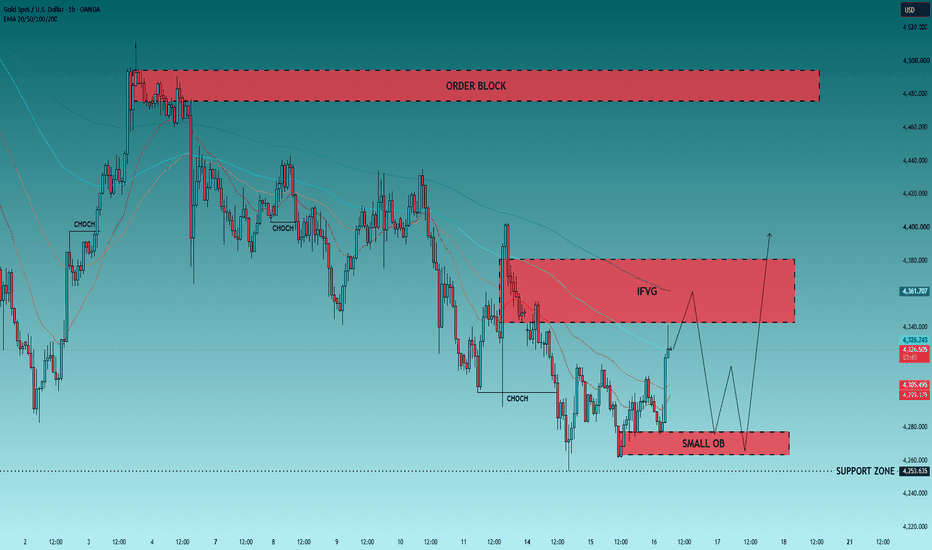
 Long
Long
Long 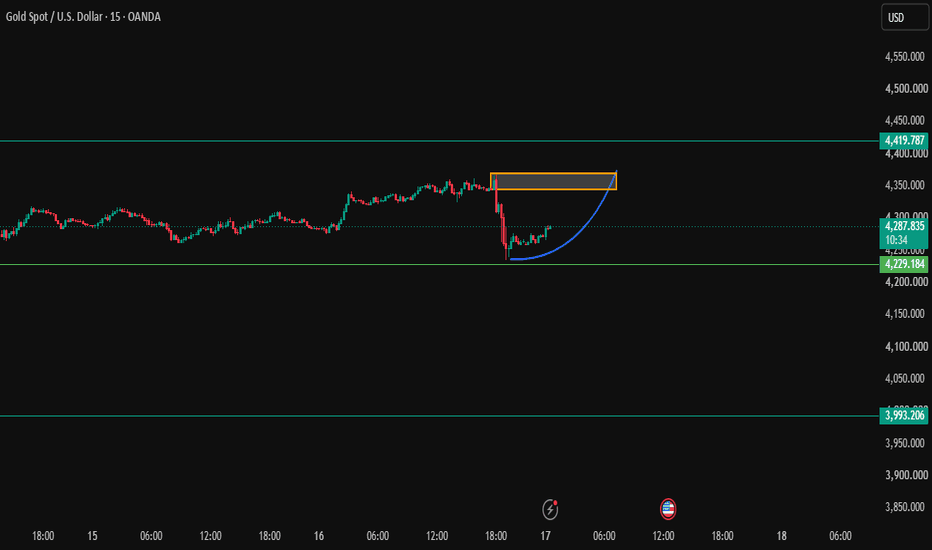
Gold Faces Pressure Following Fed DecisionGold prices (XAU/USD) OANDA:XAUUSD attracted limited buying interest but struggled to break and hold above the psychological threshold of US$4,300 per troy ounce throughout the Asian trading session on Thursday, September 17, 2026.
The precious metal hovered close to the nearly six-week low touched the previous day.
Gold's decline was triggered by the Federal Open Market Committee's (FOMC) unanimous decision to raise its benchmark interest rate—the first hike since 2023—accompanied by a super-hawkish "Dot Plot" chart. This coincided with a surge in the 10-year US Treasury yield toward 5.0% and intensified Houthi-Saudi aerial combat in Yemen.
----------------------------------------------------------------------------------------------------------------
✅ US Monetary Policy & Kevin Warsh's Remarks: Unanimous Rate Hike (+25 bps) & Signal for One Further Hike in Dot Plot
The Federal Reserve's monetary policy announcement on Wednesday evening (early Thursday morning WIB) solidified the Greenback's dominance:
- ⚡Unanimous Rate Decision & Dot Plot Projections:
Fed officials unanimously voted to raise the benchmark interest rate by 25 basis points (bps). The updated Dot Plot chart confirmed expectations among top Fed officials to implement one additional rate hike before the end of 2026.
- ⚡Remarks by Fed Chair Kevin Warsh:
In the post-meeting press conference, Fed Chair Kevin Warsh emphasized that the rate hike decision was driven by the strength of the US economy, the lack of improvement in inflation trends over the summer, and geopolitical turmoil. Warsh asserted that inflation remained "too high and has persisted for too long."
- ⚡Record US Bond Yields (Near 5.0%):
The yield on the benchmark 10-year US government bond held firm near the 5.0% threshold (its highest level since April 2007). High borrowing costs are eroding the appeal of non-yielding commodities like gold.
----------------------------------------------------------------------------------------------------------------
✅ Price Action Analysis (H4 Timeframe)
From a macro perspective, the H4 structure is in a Bearish/Retest phase. After a gradual decline from the Lower High peak at the 4,511.309 green line, gold slid downward and executed a liquidity sweep (a "wick" penetration) below the local Demand Zone (gray box) to the 4,235.165 level.
At the 4,291.105 price level, the most recent H4 candle shows a buying rejection reaction (long lower wick) that successfully pushed the price back into the consolidation floor area.
This current green candle indicates a temporary rebound push aimed at filling the imbalance area and testing the Support-Turned-Resistance (SBR) zone above it.
----------------------------------------------------------------------------------------------------------------
✅ Key Zones:
- ⚡Resistance / Supply Zone (SBR): The 4,442.941 green line range (middle gray box / primary SBR & HVN area) and the 4,511.309 green line range (Lower High limit / upper Major Supply Zone).
- ⚡Support / Demand Zone: The 4,235.165 – 4,260.000 range (lower gray box where the liquidity sweep occurred) and the 4,154.156 green line (lowest Major Demand Zone stronghold).
----------------------------------------------------------------------------------------------------------------
✅ Orderflow / Volume Profile (VPVR) Analysis
The Volume Profile histogram on the right side of the chart provides a highly precise map of institutional liquidity:
- ⚡High Volume Node (HVN) / Upper Local Point of Control (POC):
A very dense accumulation of volume is visible above the current price, specifically in the 4,380.000 – 4,442.000 range (indicated by the longest histogram protrusion in the middle section). This HVN level acts as a formidable Orderflow resistance barrier.
- ⚡Low Volume Node (LVN) / Volume Vacuum Area below 4,235:
Below the 4,235.165 level, extending down to the green line at 4,154.156, the volume histogram shows extreme thinning (a volume vacuum).
If sellers succeed in breaking through and triggering a solid H4 candle close below the 4,235.165 base, the decline is projected to accelerate rapidly across this volume void, targeting 4,154.156.
----------------------------------------------------------------------------------------------------------------
✅ Elliott Wave Analysis
Mapping wave cycle movements on the H4 timeframe:
⚡Wave Structure:
The sharp decline from the major peak to the 4,280.000 area low is calculated as Sub-Wave A (or Wave 1). The upward bounce that stalled at the green line (4,511.309) is identified as the formation of Sub-Wave B (a micro zigzag correction).
⚡Current Status:
The decline from 4,511.309 to 4,235.165 is calculated as part of the Sub-Wave C expansion (or micro Wave 3). The upward bounce from 4,235.165 to 4,291.105 currently represents the formation of a minor corrective sub-wave (relief rally) to retest the price efficiency area.
⚡Projection:
Price action is projected to complete this corrective rebound by testing the SBR/HVN area in the 4,340.000 – 4,400.000 range, before reversing downward to break the 4,235.165 base and target the Major Demand floor at 4,154.156. Short 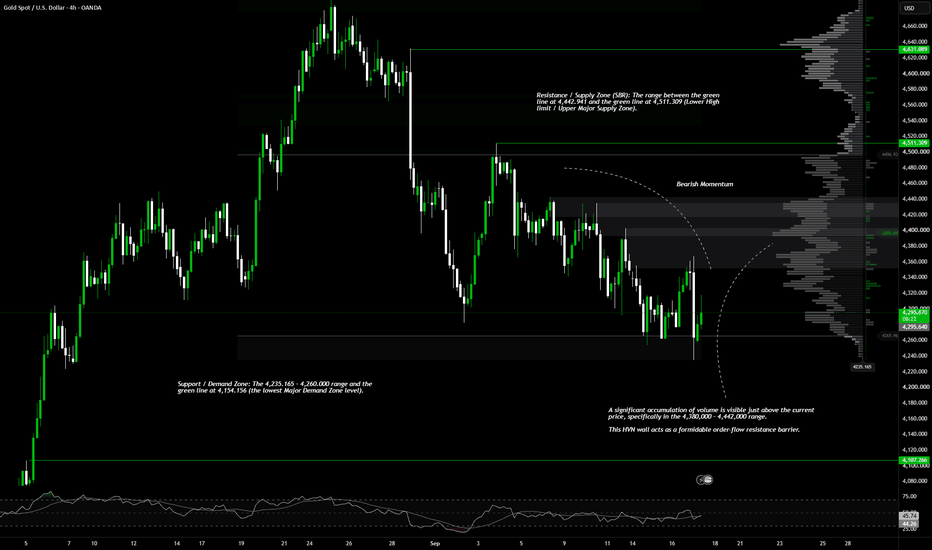
 Long
Long
XAUUSD: Rejection or Recovery From Key Zones?Gold Consolidates Between Key Supply and Demand Zones
Gold is currently trading around 4,292 after a sharp bearish displacement from the 4,350–4,360 region. Price reacted strongly from the 4,230–4,245 demand zone, but the recovery has not yet changed the broader short-term weakness.
The key area above is around 4,325–4,335, where the highlighted supply zone could become the next decision point. This leaves price positioned between two important zones, making confirmation at either extreme more important than the movement in the middle.
Speculative Outlook
My primary observation is a possible recovery toward the 4,325–4,335 supply zone. If price reaches this area and shows rejection, another bearish rotation toward 4,300 and potentially the 4,230–4,245 demand zone could develop.
At the lower zone, I would watch how price behaves around 4,230–4,250. A liquidity sweep followed by a strong recovery could create the conditions for a larger bullish reversal, initially toward 4,280–4,300 and potentially back toward 4,325–4,330.
So rather than assuming direction from the current midpoint, the main focus remains on reaction at supply or demand. Short 
𝗫𝗔𝗨𝗨𝗦𝗗 𝗧𝗘𝗖𝗛𝗡𝗜𝗖𝗔𝗟 𝗢𝗨𝗧𝗟𝗢𝗢𝗞 | 𝗦𝗘𝗣 𝟭𝟳#𝗫𝗔𝗨𝗨𝗦𝗗 𝗧𝗘𝗖𝗛𝗡𝗜𝗖𝗔𝗟 𝗢𝗨𝗧𝗟𝗢𝗢𝗞 | 𝗦𝗘𝗣 𝟭𝟳
𝗗𝟭: Gold remains in a corrective phase. The broader structure is not fully bearish, but upside momentum continues to weaken.
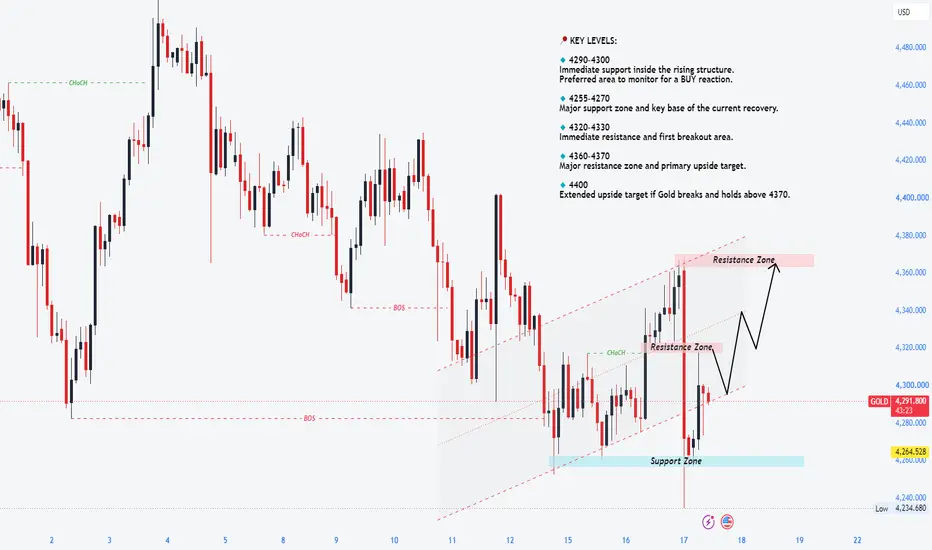
𝗛𝟭: Price remains below the main descending trendline after a sharp rejection from 𝟰,𝟯𝟲𝟬. The current rebound is corrective, with 𝟰,𝟯𝟱𝟬–𝟰,𝟯𝟳𝟬 acting as key resistance.
𝗧𝗢𝗗𝗔𝗬’𝗦 𝗦𝗧𝗥𝗔𝗧𝗘𝗚𝗬
🔹 𝗕𝗨𝗬 𝟭: Look for a bullish reaction from 𝟰,𝟮𝟴𝟬–𝟰,𝟮𝟲𝟱.
🔹 𝗕𝗨𝗬 𝟮: If price sweeps lower, watch the stronger demand at 𝟰,𝟮𝟱𝟬–𝟰,𝟮𝟮𝟱. Targets: 𝟰,𝟯𝟬𝟬–𝟰,𝟯𝟯𝟬, then 𝟰,𝟯𝟱𝟬.
🔻 𝗦𝗘𝗟𝗟: Avoid selling at the current price. Wait for a deeper pullback into 𝟰,𝟯𝟱𝟬–𝟰,𝟯𝟳𝟬, where key resistance meets the H1 descending trendline, then look for bearish confirmation.
An H1 close above 𝟰,𝟯𝟳𝟬 invalidates the sell setup. A break below 𝟰,𝟮𝟮𝟱 could extend the decline toward 𝟰,𝟮𝟬𝟬.
#GoldTrading #TechnicalAnalysis #TradingSetup
XAUUSD: Support Holds as Liquidity Builds Above 4,440🔹 XAUUSD is showing a broader corrective structure after the previous decline, with price recently consolidating above the highlighted support zone around 4,230–4,270. The descending trendline continues to define the recent market structure, while price action near 4,320 suggests a short-term attempt to recover. The 4,440 area remains a notable resistance and liquidity zone, where a breakout or rejection could provide further clues about the next directional move. Overall, the chart reflects a developing range between support and resistance, with liquidity positioned above recent highs.
🔸 If price continues to hold the support area, a bullish scenario could develop toward the upper liquidity zone, particularly if a breakout above nearby resistance is confirmed through sustained price action. Traders may wait for clear confirmation before considering any trade. Conversely, if the key support zone fails, price could revisit lower levels as bearish structure gains further confirmation. This XAUUSD technical analysis focuses on price action, market structure, support, resistance, breakout, and liquidity.
This analysis is for educational purposes only and does not constitute financial or investment advice. Always conduct your own research before making trading decisions. Long 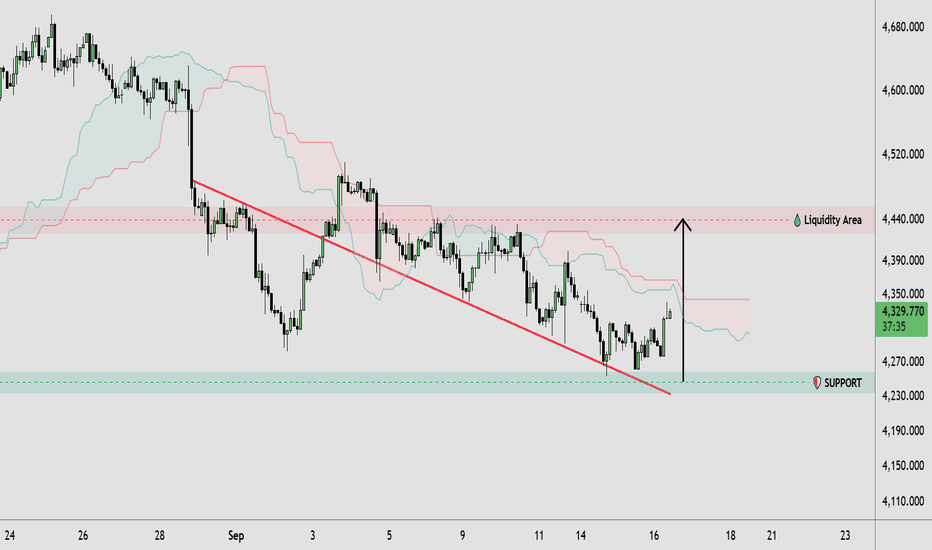
Short 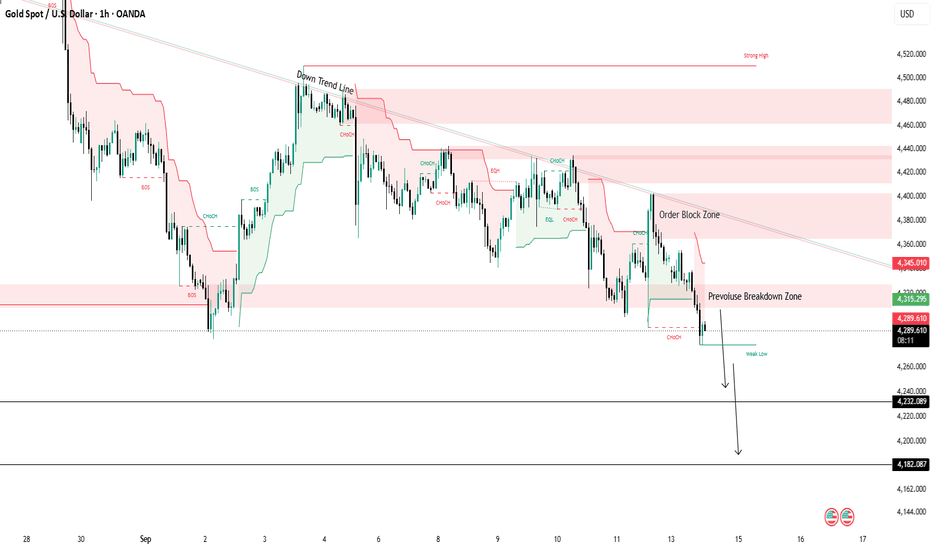
XAUUSD — Internal Supply Sell Before FOMC
Gold is trading around $4,326 after a corrective recovery from the recent sell-side liquidity sweep. Despite the bounce, H1 price remains beneath the descending HTF trendline, and the broader sequence of lower highs continues to favor bearish delivery.
Macro risk is concentrated around today’s FOMC decision. Markets are pricing roughly a 92% probability of at least a 25 bp Fed hike, while the U.S. dollar remains near multi-week highs. Gold has recovered modestly ahead of the announcement, but a hawkish Fed message could reinforce yield pressure on the metal.
Oil has eased after an unexpected rise in U.S. inventories, although Brent remains above $100 and Middle East supply disruptions continue to keep inflation risk elevated.
SMC View
The H1 structure remains bearish below dynamic supply. The recent bullish MSS explains the current corrective repricing, but it has not yet broken the broader bearish structure.
Price is now moving back toward the $4,395-$4,405 Internal Supply area. This is the nearest mitigation zone and the main location where sellers may attempt to regain control.
The $4,385–$4,405 Premium Bearish OB remains the higher resistance zone if FOMC volatility drives a deeper liquidity sweep.
Main Trading Scenario
Sell Priority: $4,395-4,405
Condition: Wait for price to retrace into Internal Supply and show bearish rejection, failed acceptance above the zone, or a lower-timeframe bearish MSS/CHOCH.
Entry: $4,395-4,405 after confirmation
SL: Above $4,355 and the rejection structure
TP1: $4,280–$4,295
TP2: $4,252–$4,268
Key Zones to Watch
$4,395-$4,405 — Premium Bearish OB
$4,330–$4,345 — Main Internal Supply
$4,283–$4,318 — FVG / mitigation area
$4,252–$4,268 — Internal SSL
HTF descending trendline — Dynamic resistance
Above $4,355 — Immediate sell setup weakens
Prime Gold View
The sell bias remains favored while Gold stays beneath Internal Supply and the HTF bearish trendline.
A confirmed rejection from $4,395-$4,405 could reopen delivery toward the exposed sell-side liquidity below. With the FOMC decision approaching, sharp two-sided liquidity sweeps are possible, so the reaction after mitigation matters more than anticipating the first move.
No confirmation, no trade. Long 
Short 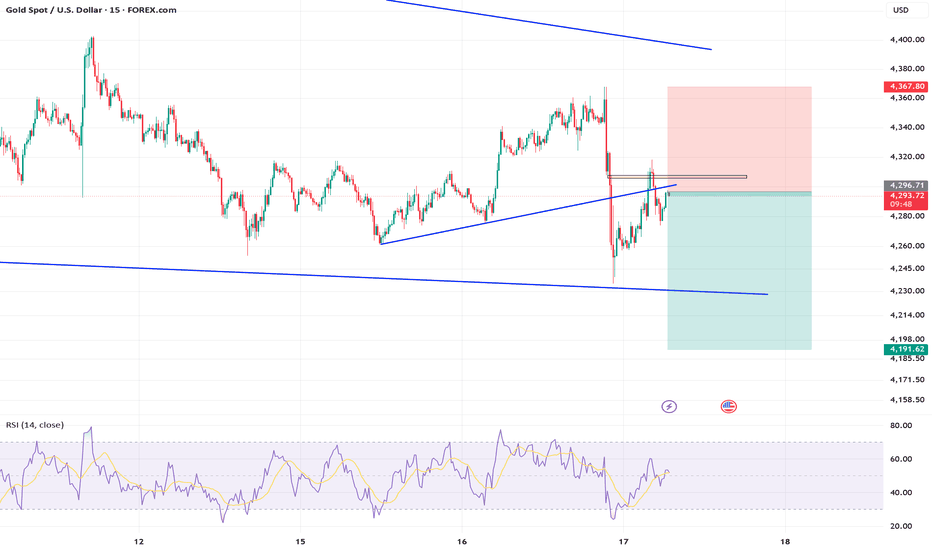
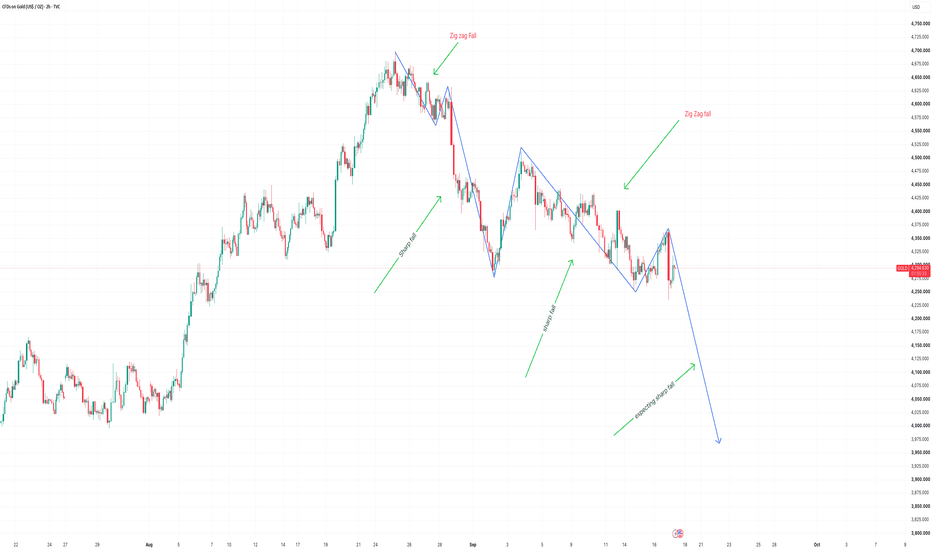
Gold – Bearish Zig-Zag Correction Setup
The chart shows a clear sequence of lower highs and lower lows after the major peak near 4,680, indicating that the short-term trend has turned bearish. The repeated zig-zag structure suggests that each recovery is being followed by another sharp decline, with the latest rebound reaching around 4,370 before facing rejection. If this structure continues, the current leg could develop into another sharp fall, with the projected move reaching around 3,950–4,000 levels. A sustained move above the recent swing high near 4,370–4,400 would weaken this bearish structure and require reassessment of the setup. The overall chart structure currently supports the possibility of another downward leg.
Idea Rating: 8.5/10
Disclaimer: This is a technical-analysis idea for educational purposes only and is not financial or investment advice. The projected path and target are possible scenarios, not guaranteed outcomes. Please do your own analysis and use appropriate risk management before making any trading decision.
Short