H1 Bearish Retest Toward Previous SupportXAUUSD is trading around 4,291 after another bearish leg pushed price back into the 4,275–4,295 Current Demand Zone. H1 structure remains bearish beneath the descending trendline, but price is now sitting near support, so chasing fresh shorts at current levels is less attractive.
The macro backdrop remains heavy for gold ahead of today’s Fed decision. Markets are pricing roughly a 90% probability of a 25 bp rate hike, while the U.S. dollar remains firm and Treasury yields recently reached their highest levels since 2007. Oil has eased slightly today but remains above $100, keeping inflation concerns elevated. The FOMC statement is due at 2:00 p.m. ET, followed by Chair Kevin Warsh’s press conference at 2:30 p.m. ET.
Technical View
The H1 structure continues to print lower highs and bearish structural breaks.
Price is currently reacting from the 4,275–4,295 demand zone, so a corrective rebound may develop before the next bearish leg.
The first important recovery area is around 4,335–4,360, but the cleaner sell location sits higher at the 4,375–4,390 Order Block, where the descending resistance structure also aligns.
If sellers defend this zone, the next downside objective is the 4,254 previous support.
Above that, 4,425–4,450 Supply remains the stronger resistance area, while 4,500–4,515 Major Supply is the higher-timeframe ceiling.
Key Zones
Current Price: 4,291.440
Current Demand: 4,275–4,295
Sell Priority / Order Block: 4,375–4,390
Supply Zone: 4,425–4,450
Major Supply: 4,500–4,515
Downside Target / Previous Support: 4,254.130
Trading Plan
Sell Priority: 4,375–4,390
Condition: wait for an H1 recovery into the Order Block followed by bearish rejection, failed acceptance or lower-high confirmation.
TP1: 4,300–4,285
TP2: 4,254
Invalidation: sustained H1 acceptance above the Order Block and descending resistance structure would weaken the immediate bearish setup.
Sell View
The preferred approach is not to chase shorts around 4,290 because price is already sitting inside demand.
A corrective recovery toward 4,375–4,390 would provide a cleaner location to evaluate seller response. With the Fed decision approaching, a liquidity sweep above nearby resistance remains possible before direction becomes clearer.
Final View
Gold remains bearish on H1, while the macro environment continues to favor higher rates, a firm dollar and elevated yields.
The main scenario is a rebound from current demand into 4,375–4,390, followed by renewed bearish continuation toward 4,254.
Will the Fed trigger the H1 retest into the bearish Order Block before gold attacks previous support?  Short
Short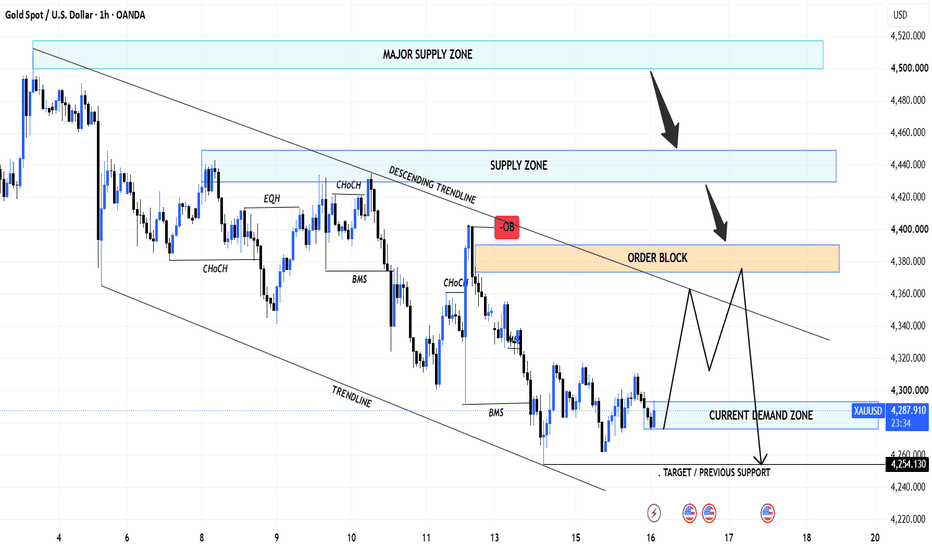
XAUUSD H4 — Head & Shoulders Setup FormingGold is currently showing a potential Head & Shoulders pattern on the H4 timeframe.
We can identify a clear Left Shoulder, Head and Right Shoulder, with price now testing the key neckline/support zone around 4,310–4,330.
The overall H4 structure is also turning bearish, with price currently trading below the 20 EMA, 50 EMA and 200 EMA, adding further pressure to this support area.
⚠️ The setup is NOT confirmed yet.
I’ll be watching for a clean H4 break and close below the neckline before considering a SELL setup. I would prefer confirmation rather than selling directly into support, as a rejection from the neckline could still invalidate or delay the pattern.
If the neckline breaks with strong bearish momentum, the next major downside area I’ll be watching is around 4,130, which also lines up with the projected Head & Shoulders move shown on the chart.
My Plan:
🔸 Neckline: ~4,310–4,330
🔸 Wait for H4 candle confirmation below neckline
🔸 Bearish confirmation → Look for SELL opportunity
🔸 Downside target area: ~4,130
🔸 No confirmed break → No trade / continue monitoring
Gold is sitting at an important decision point now. Let price confirm the direction first rather than anticipating the breakout.
This is my personal market analysis and not financial advice. Always manage your own risk.
#XAUUSD #Gold #GoldTrading #TechnicalAnalysis #HeadAndShoulders #ForexTrading #PriceAction #TradingView #bottradingwithkinki GOLD: If The Fed Hikes The Rate, Look For SELLS!In this Weekly Market Forecast, we will analyze Gold for the week of Sep 14 - 18th.
Gold is leaning bearish to neutral in the short term heading into this week, as rising expectations for a Federal Reserve interest rate hike place strong downward pressure on the non-yielding metal. The market closed the previous week at $4,408.90 per ounce, marking its third consecutive weekly decline.
My Plan: Wait for the Daily +FVG to be either respected or disrespected. This will signal the bias for this market.
Enjoy!
May profits be upon you.
Leave any questions or comments in the comment section.
I appreciate any feedback from my viewers!
Like and/or subscribe if you want more accurate analysis.
Thank you so much!
Disclaimer:
I do not provide personal investment advice and I am not a qualified licensed investment advisor.
All information found here, including any ideas, opinions, views, predictions, forecasts, commentaries, suggestions, expressed or implied herein, are for informational, entertainment or educational purposes only and should not be construed as personal investment advice. While the information provided is believed to be accurate, it may include errors or inaccuracies.
I will not and cannot be held liable for any actions you take as a result of anything you read here.
Conduct your own due diligence, or consult a licensed financial advisor or broker before making any and all investment decisions. Any investments, trades, speculations, or decisions made on the basis of any information found on this channel, expressed or implied herein, are committed at your own risk, financial or otherwise. Short

GOLD — THE FED GAVE US THE MOVE… NOW WHAT?We've been sitting in consolidation for most of the week waiting for the Fed.
Well... we finally got the catalyst.
The Fed raised rates by 25bps today, bringing the target range to 3.75%–4.00%, while also signaling that inflation remains elevated and that additional tightening could still be on the table.
And Gold initially reacted exactly how you'd expect.
Straight down.
But here's where I'm getting interested.
That selloff pushed price directly into the area I've been waiting for.
The H4 FVG was largely filled, and price also swept the lows.
Now I'm watching to see what happens after the liquidity grab.
Because at this point, I don't necessarily want to chase the downside.
I want to see if sellers can actually hold the lower prices.
🔵 THE BULLISH IDEA
The level I'm watching now is the Previous Weekly Low around 4,339.7.
Price is currently below it.
So I'm not calling a long simply because we swept the lows.
I want to see price reclaim that level.
If we push back above the Previous Weekly Low, then I want to see whether we can retest it from above and hold.
Something like:
Sweep the lows → FVG fill → buyers step in → reclaim PWL → successful retest → continuation.
THAT is the setup I'm interested in.
If that happens, the Fed reaction could end up being the liquidity event that gave buyers the opportunity to step back in.
🔴 BUT I'M NOT GOING TO FORCE THE BULLISH STORY
This is the part that's important.
The Fed just delivered a hawkish catalyst, and the initial reaction was bearish for Gold.
So if price cannot reclaim the Previous Weekly Low, I'm not going to sit here saying:
"Well... they swept the lows, so it has to go up."
Nope.
If sellers continue accepting price below that level, then the sweep wasn't necessarily a reversal.
It may simply have been the beginning of another leg lower.
And that's when I'm looking for the next area where Gold may want to react.
📊 WHAT I'M WATCHING IN ORDER FLOW
This is where the DOM/order flow becomes important for me.
I want to see whether the aggressive selling we're getting after the Fed actually produces continued downside acceptance.
If sellers keep hitting the market but price stops making meaningful progress lower...
That's interesting.
If buyers begin absorbing that selling...
Even more interesting.
Then we reclaim the Previous Weekly Low?
Now we've got something I can actually work with.
I'm not trying to predict the reversal.
I'm waiting for the market to prove it.
🎯 MY PLAN
Bullish scenario:
🔹 H4 FVG gets filled
🔹 Lows get swept
🔹 Selling pressure begins to dry up
🔹 Buyers take control
🔹 Price reclaims ~4,339.7
🔹 Retest holds
🔹 Look for continuation higher
Bearish scenario:
🔻 Price remains below the Previous Weekly Low
🔻 Sellers continue accepting lower prices
🔻 Reclaim attempt fails
🔻 No reason for me to force a long
🔻 Wait for the next major level/FVG
The key for me is 4,339.7.
I don't need to catch the exact bottom.
I'd rather miss the first 30–50 points and get confirmation that buyers have actually taken control than try to call the bottom and get run over if sellers aren't finished.
The news created the volatility.
Now I'm watching price tell me what that volatility actually means.
Let it show its hand.
#Gold #MGC #GC #GoldFutures #FuturesTrading #OrderFlow #PriceAction #VolumeProfile #MarketStructure #TradingView #DayTrading #Futures #COMEX #GoldTrading Long

Crude Oil | Is Wave 3 Expanding?⏱️ Reading time: about 2 minutes
In the previous Crude Oil analysis, the main question was:
What kind of structure is the market building?
On this 2-hour chart, the move up from the major low still shows characteristics of an impulsive structure.
In the bullish scenario, this move could be part of a higher-degree Wave 3, and its internal structure is now giving us more clues.
Price is developing a five-wave structure. If this structure continues to unfold as expected and the internal Wave 4 completes, the next move could be Wave 5 of this structure.
103.558 is the first key level I’m watching for confirmation that this scenario is still developing.
If the bullish structure remains intact, 108.618, 111.148, and 114.431 can be used as the next reference areas.
And if the higher-degree Wave 3 is truly expanding, then 118.055, 120.244, and 123.868 come into focus as additional reference levels.
These are not fixed price predictions.
They simply help us track how the structure is developing.
On the other hand, if the current move fails to maintain its impulsive structure and instead develops into a larger correction, another scenario becomes relevant again.
94.199 is the first level I’m watching for invalidation in that scenario, while 66.980 remains the invalidation level for the larger bullish structure.
So the main question is still not:
“Is Crude Oil going up or down?”
The real question is:
“What will the next structure tell us?”
We don’t always need to predict the future.
Sometimes, it’s enough to let the structure reveal itself, one step at a time.
Patterns whisper, and I listen.
— Mr. Nobody 🎧📊
Brent Crude Oil
7 hours ago
Brent Crude Oil | Is Wave III Expanding?
 Long
Long
Short 
XAUUSD H1: Bearish Continuation After Strong Displacement From tXAUUSD is currently trading around 4,264, showing strong bearish momentum after a sharp displacement from the upper H1 Order Block around 4,340–4,360.
The broader H1 market remains bearish, with multiple BOS confirming the previous downside structure. Price recently reacted from the upper OB before breaking below the FIBO + FVG zone around 4,300–4,315, indicating increasing selling pressure.
The current price action shows a bearish structure, with the EMA 20/50/100/200 aligned above price. This suggests that the short-term recovery has weakened and bearish continuation remains a potential scenario.
The major BSL Liquidity zone around 4,480–4,510 remains positioned above the current structure, while the lower area around 4,240–4,250 represents a potential downside liquidity objective.
The Bias: Short-Term Bearish Continuation / Potential Retracement.
The Target Path: Price may first retrace toward the 4,280–4,315 FIBO + FVG area. If price rejects from this zone, further downside expansion toward the 4,240–4,250 liquidity area could follow.
Potential Setup: Observe price reaction around the 4,280–4,315 FIBO + FVG zone. A bearish rejection, followed by bearish displacement and a confirmed MSS/BOS, could provide a potential continuation scenario.
Confirmation: A clear rejection from the FIBO + FVG zone, followed by a bearish MSS and sustained trading below 4,280, would strengthen the bearish continuation thesis.
Alternative Scenario: If price reclaims the FIBO + FVG zone and sustains bullish momentum, a deeper recovery toward the 4,340–4,360 OB could develop. A strong reclaim above the upper OB would weaken the immediate bearish structure.
Invalidation: Strong acceptance above the 4,340–4,360 OB would weaken the short-term bearish continuation thesis.
Educational purposes only — Not financial advice. Short 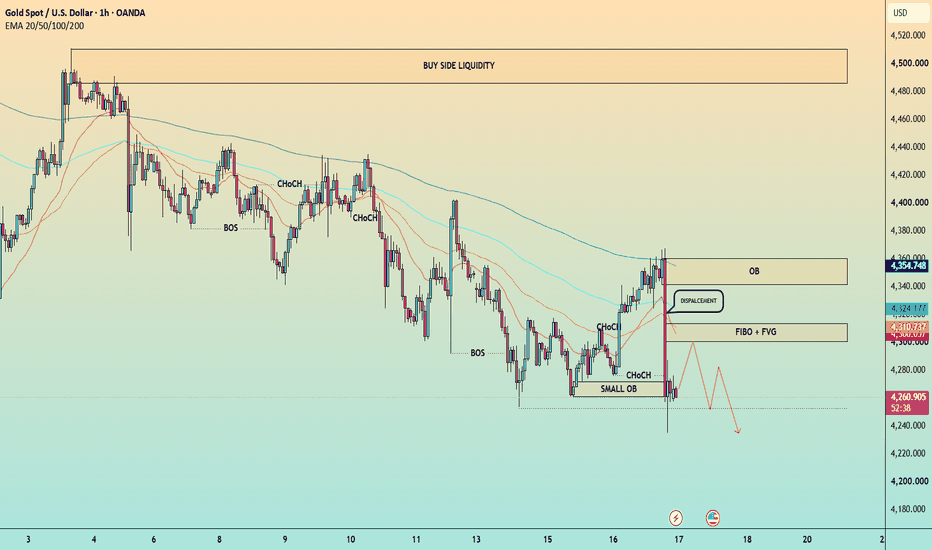
 Short
Short
 Long
Long
Long 
XAU/USD — Gold Tests Channel Support: Fed Hike vs. Iran WarGold is retesting the lower boundary of its multi-year ascending channel after correcting ~24% from the Jan 2026 ATH of $5,598. Price sits near $4,165–$4,265, a key trendline support zone.
Setup:
📍 Buy Limit: ~4,166
🛑 Stop Loss: ~3,928–3,936
🎯 Target: ~5,300 (channel resistance)
📊 RSI neutral (~42) — no extreme
Fundamentals in play:
🦅 Fed hiked rates Sept 16 (Chair Warsh's first hike) — hawkish, dollar-supportive, near-term bearish for gold
🏦 Bank year-end targets still bullish: Goldman $4,900 | HSBC $4,560 | JPM $4,500
⚔️ Active US-Iran war — Strait of Hormuz tanker strikes, oil >$100/bbl — live safe-haven driver
🏛️ Central bank buying remains structural support
Bias: Range holds = bullish continuation toward channel highs. Break below invalidates. Expect volatility from both FOMC guidance and Hormuz headlines.
Long 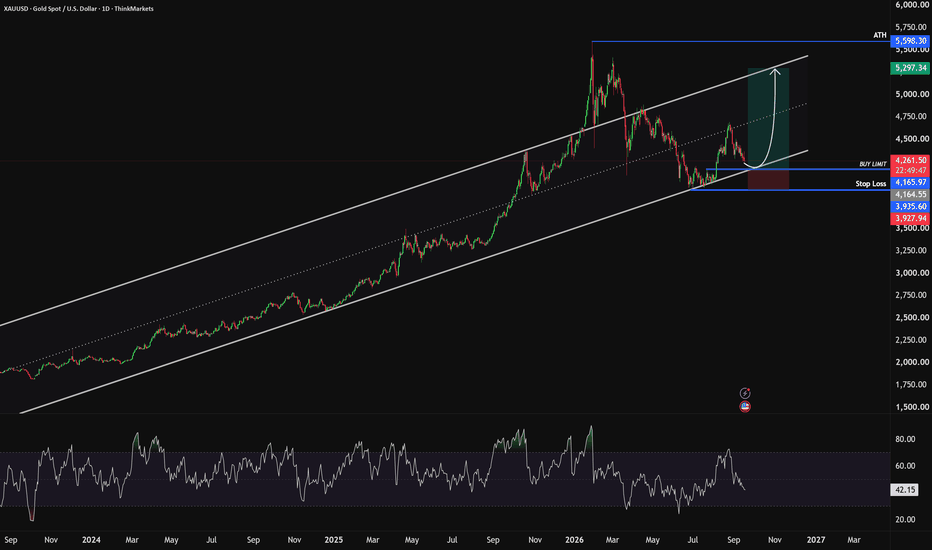
Crude Oil Futures Curve: Another Temporary Dislocation?The crude-oil market is once again displaying a sharp divergence across the futures curve.
Front-month WTI is trading near $102, while December 2026 is near $93 and February 2027 is around $85. This creates approximately $9 of backwardation between the front month and December, and more than $16 between the front month and February.
This structure indicates significant demand for immediate supply, but the deferred contracts are not fully confirming the front-month price.
A similar divergence appeared earlier this year. The front of the curve reacted aggressively to immediate supply concerns while longer-dated contracts remained anchored to expectations for eventual normalization. Oil subsequently moved lower as the temporary premium unwound.
The current situation has some similarities.
Geopolitical disruptions and constrained Middle Eastern exports are supporting near-term prices. However, the back of the curve continues to suggest that the market expects supply conditions to improve or demand to weaken over time.
The Fed adds another variable. Markets are considering approximately 75 basis points of tightening over the next three meetings. Additional hikes could strengthen the dollar, restrict credit and weaken economic demand—all potential headwinds for oil.
The key signal is whether deferred contracts begin moving higher alongside the front month.
If December and February begin closing the gap, the move may be developing into a more structural repricing. If they remain lower while the front month loses momentum, this is more likely another temporary dislocation.
Levels and signals I am watching:
Front month WTI around 100
December WTI around 90
front to December spread, currently near 9
whether the curve begins flattening
the dollar and treasury yields
gasoline, diesel and jet fuel crack spreads
If oil declines, inflation expectations could cool and Treasury yields could move lower. That could reduce mortgage rates and eventually support homebuilders and housing suppliers.
For that thesis, I am watching ITB and XHB—but only if the 10-year Treasury yield confirms the move lower.
REITs could also benefit if lower inflation pulls yields and refinancing costs down. VNQ can help track whether the market is beginning to price that transition.
On the bearish side, sustained weakness in crude could eventually pressure energy producers, followed by oilfield services, equipment suppliers and energy-exposed regional banks. XLE and OIH can help identify whether weakness is moving beyond crude and into the broader energy complex.
The curve was an important warning during the previous dislocation. Once again, it may be providing more information than the headline spot price.
Watching closely to see whether the back end follows the front—or whether the front is pulled back toward the rest of the curve.
This is for informational purposes only and reflects general market observations, not investment advice. Education 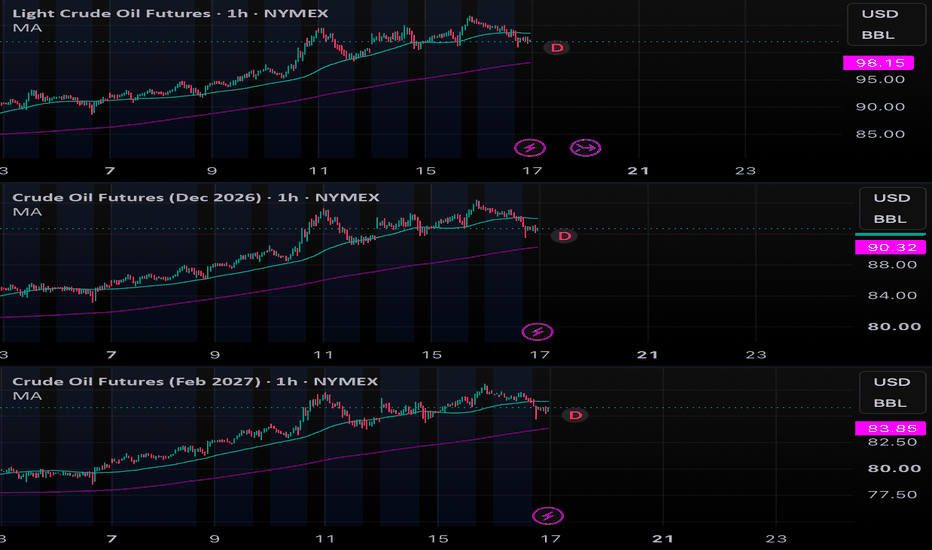
Understanding RSI 50 Level as Exponential Moving Average Trend
Overview:
In technical analysis, traders often view the Relative Strength Index (RSI) purely as an overbought or oversold indicator using the traditional 70 and 30 levels. However, the center line of the RSI indicator at the 50 mark holds a direct mathematical relationship with price trend baselines, specifically the Exponential Moving Average (EMA). When RSI crosses above or below the 50 level, it directly mirrors price crossing over its exponential moving average baseline on the main chart area.
Key Concepts Demonstrated in Chart Analysis:
1. Price Chart Alignment with RSI 50:
The main upper panel displays price action navigating within structural bands alongside a central EMA trendline. Notice how each time price tests or crosses the central moving average, the RSI value in the lower indicator panel simultaneously interacts with the 50 level.
2. Trend Confirmation Signals:
Bulish Phase: When RSI holds firmly above 50, price remains supported above the central EMA, confirming active upside momentum.
Bearish Phase: When RSI drops below 50, price trades beneath the central EMA baseline, signaling seller control and downside continuation.
3. Precision Correlation Points:
Highlighted vertical dashed lines mark the exact points where price touches its moving average baseline while RSI touches 50. These key intersection points serve as high-probability decision zones for trend re-entries, breakouts, and momentum shifts.
Trading Strategy Execution Rules:
Long Entry Rules:
1. Ensure overall price market structure is bullish and trading above the central EMA.
2. Wait for a pullback where price tests the EMA baseline while RSI drops to touch the 50 level.
3. Look for a bullish rejection pattern off the EMA baseline and RSI bouncing back above 50.
Short Entry Rules:
1. Ensure price is trading below the central EMA baseline.
2. Wait for a pullback rally where price retests the EMA while RSI rises to touch 50 from below.
3. Look for a bearish rejection off the EMA baseline and RSI turning down below 50.
Risk Management Guidelines:
Always place stop losses past structural swing points and maintain consistent risk management. Never risk more than a fixed percentage of account equity on a single setup.
Disclaimer:
This publication is strictly for educational and analytical purposes only. It does not constitute financial advice or trade execution recommendations. Always backtest strategies thoroughly on demo environments prior to live market deployment.
Education 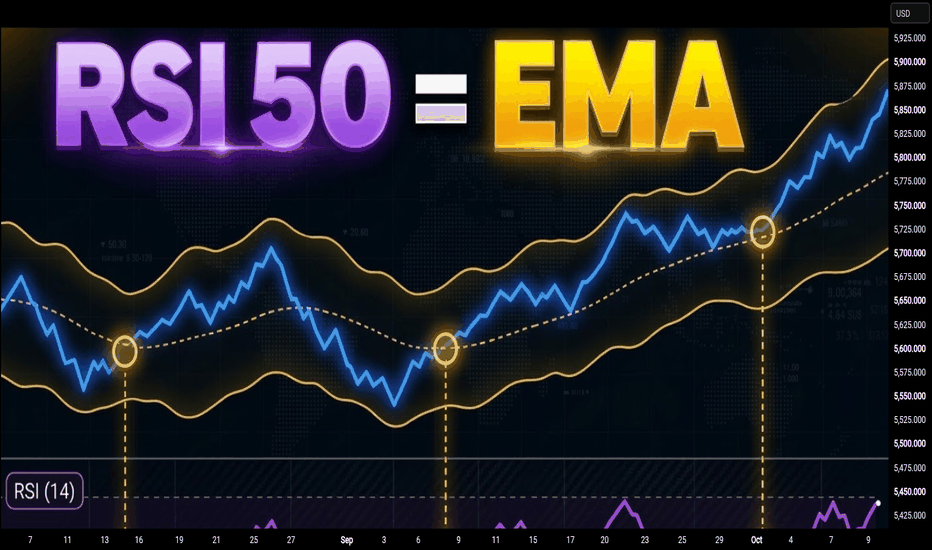
XAUUSD: A Bounce Before Another Drop? $4,214 and $4,110 in FocusMarket Overview — Bearish Structure, but Entry Timing Matters
Gold is attempting to recover after another sell-off, but the four-hour chart still favours sellers. The opportunity outlined here is a potential rebound into resistance followed by renewed weakness—not an automatic sell at the current price.
Market Structure — The August Rally Has Lost Its Momentum
The strong August advance reached roughly $4,680–$4,700 before the structure began changing. The marked CHoCH, or “change of character,” highlighted the first warning that buyers were losing control. Subsequent BOS labels—“breaks of structure”—show price moving through earlier swing lows. September’s recovery then stalled near $4,510, followed by weaker rebounds around $4,430–$4,450 and $4,400. Those progressively lower highs are the main reason to favour selling opportunities on a rebound.
Immediate Support — The Reaction Around $4,280–$4,290 Matters
The price has traded below the previous floor around $4,280–$4,290 and rebounded above it. This is a key observation: a move below support does not necessarily indicate a lasting breakdown. From a technical analysis perspective, this could be a sell-side liquidity sweep—a brief movement through previous lows followed by recovery. A completed four-hour close below this area, followed by a failed reclaim, would strengthen the bearish continuation case. Holding above it would leave room for a deeper rebound first .
First Entry Area – Aggressive Retest Around $4,310–$4,340
The smaller shaded zone represents the shallower pullback scenario. If gold rebounds into this area and struggles to move higher, it could provide an early opportunity to follow the bearish trend. However, this is the more aggressive setup as price could recover through it and continue towards the larger supply zone. A touch of the rectangle alone is insufficient; evidence that the rebound has stalled is required.
Second Entry Area – Stronger Structural Resistance Around $4,360–$4,400
The higher shaded zone is located around the latest breakdown area and close to descending trendline resistance. This combination confers greater structural significance than the shallower entry area. A recovery into this region, followed by rejection, would align with the second projected route on the chart. Gold does not need to reach this zone before falling; these are alternative setups to evaluate rather than instructions to continue adding to a losing short position.
Entry Confirmation – Allow the Rebound to Demonstrate Weakness
The entry should be confirmed by observing the rebound’s weakness.
For either zone, a practical confirmation sequence would be a rejection, a decisive close below the rebound’s most recent minor swing low and a retest that fails to recover that broken level. Traders could assess this on a 15-minute or one-hour chart while keeping the four-hour direction in view. Those lower-timeframe triggers are conditions to watch for, not signals already confirmed by this screenshot. If price moves cleanly through a zone and holds above it, that particular rejection setup has not developed.
Downside Targets — Clear the Recent Lows Before Looking Further
The recent low area around $4,250–$4,270 is the first obstacle for another decline. Below that, the chart marks $4,213.58 as the first target and $4,110.40 as the final target. The first objective is a sensible place to reassess momentum and consider reducing exposure. The deeper target becomes more relevant if selling continues through the first level and recovery attempts remain weak. A strong bullish reaction at the first target would be a reason to protect gains rather than assume the entire projected move will unfold.
Volume Profile — Useful Context, Not Proof of Future Selling
The right-hand profile shows substantial historical activity around the overhead $4,350–$4,400 region and another broad concentration lower down around $4,050–$4,125. My interpretation is that these areas deserve attention if price returns to them, as previous trading activity may produce hesitation or consolidation. However, the profile records past activity; it does not reveal future orders or prove that institutions are selling. TradingView also distinguishes its up/down volume calculations from actual buy/sell order flow.
Invalidation — What Would Make Me Reconsider the Bearish Setup?
A convincing four-hour close above $4,400, followed by a successful retest as support, would invalidate the immediate rejection setup from the upper shaded zone. This would open the possibility of a recovery towards $4,430–$4,450 and then $4,480–$4,510. Sustained trading above the September swing high near $4,510 would challenge the broader bearish structure more substantially. An individual trade’s stop should remain separate from these wider outlook levels.
Risk Management — Build the Position Around the Stop
Define the rejection high and protective stop before deciding position size. Judge the potential reward against the distance to the first target rather than relying on the final target to make the trade appear attractive. If using multiple entries, keep the combined exposure within one planned risk budget. Allow for spreads, slippage and US news-related volatility and do not wait for a four-hour candle to close after a protective stop has been reached.
LIKE AND COMMENT FOR MORE SUCH TRADING SETUPS
THE SETUPSFX_ TEAM
Short 
DeGRAM | GOLD is testing major support📊 Technical Analysis
● XAUUSD remains below the major descending resistance line, keeping the broader 2H structure bearish. Price has continued to form lower highs, while every recovery has been capped beneath the upper trendline.
● Gold is now testing the 4,260–4,290 support zone. This area has already generated strong reactions and is the key level for the current setup. If buyers defend it again, a rebound toward the 4,380–4,410 resistance zone becomes the main short-term scenario.
💡 Fundamental Analysis
● Gold remains under pressure ahead of the September 15–16 Fed meeting. Markets are pricing roughly an 89% probability of a 25 bp rate hike after stronger U.S. inflation data, while a firmer dollar and rising Treasury yields are adding pressure to non-yielding gold. Oil has also surged on renewed Middle East tensions, reinforcing inflation concerns.
✨ Summary
● Bullish rebound setup while the 4,260–4,290 support zone holds; target 4,380–4,410. A confirmed break below support would invalidate the recovery scenario and keep the broader bearish trend in control.
Share your opinion in the comments and support the idea with a like. Thanks for your support! Long 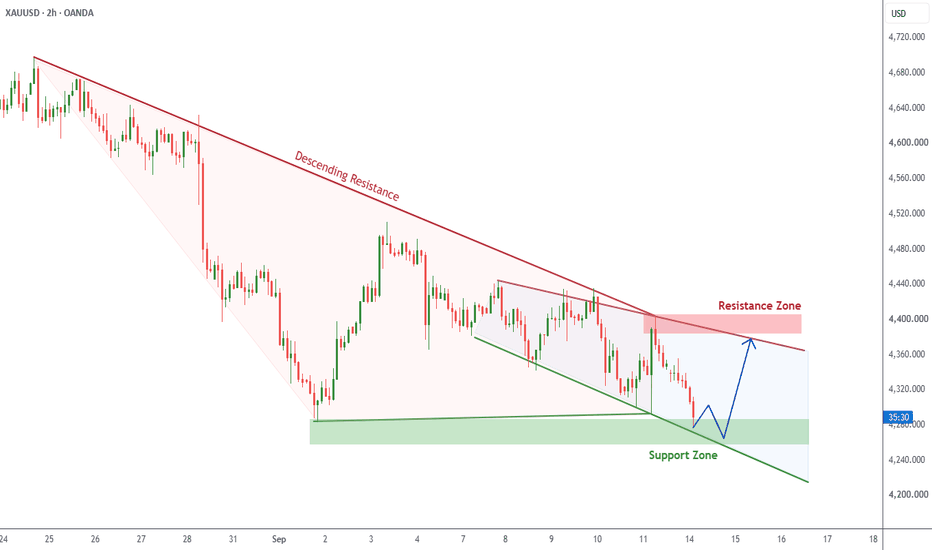
DeGRAM | XAUUSD is testing descending resistance📊 Technical Analysis
● XAUUSD remains inside a clear descending structure, with the major resistance line continuing to cap every recovery. Price is now rebounding from the lower part of the channel, but the broader 1H trend remains bearish while the market stays below the 4,370–4,390 resistance zone.
● A further recovery toward 4,370–4,390 could trigger another rejection from descending resistance. If sellers regain control there, the next downside objective is the 4,240–4,260 target zone near the lower channel support.
💡 Fundamental Analysis
● Gold is trading higher ahead of today’s crucial Fed decision, but the fundamental backdrop remains challenging. Markets are pricing roughly a 93% probability of a 25 bp rate hike, while elevated U.S. Treasury yields continue to pressure non-yielding gold. U.S. retail sales are also due today before the Fed announcement, adding another potential volatility trigger for XAUUSD.
✨ Summary
● Bearish structure remains dominant below 4,370–4,390; a rebound into resistance could be followed by another decline toward 4,240–4,260. A sustained breakout above resistance would weaken the bearish scenario.
Share your opinion in the comments and support the idea with a like. Thanks for your support! Short 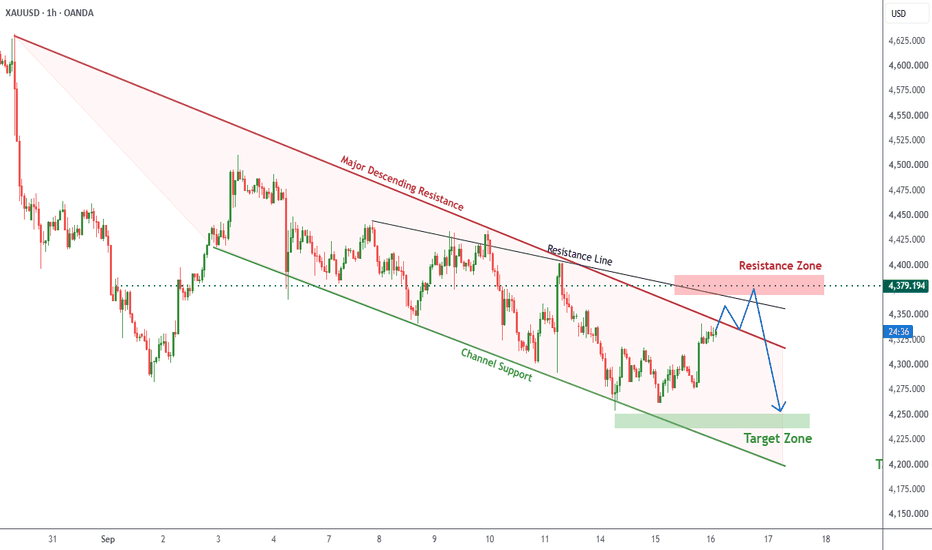
Short 
Gold next move, expecting bullish move (16-09-2026)Plz Go through the analysis carefully and do trade accordingly.
Anup 'BIAS for the day (16-09-2026)
Current price- 4340
"if Price stays above 4295-4300, then next target is 4390, 4445, 4480, 4510 & 4580 if price break this Key-area 4295-4300 , then the next target will be 4250, 4220 & 4160".
Advice-
(analysis is valid if FED doesn't hike interest rate in FOMC release)
Reasons:
1. As per Eliot wave theory, in 4H time frame, the fourth correctional wave has completing ABC correction. Now if it sustains the we will see 5th impulse wave targeting 4900.
2. in 1-Week time frame, the price already tapped imbalance now 1D,4H gave good reaction, which indicates possible bullish move.
3. in 1D time frame, the price have taken liquidity downside and it created HH low (strong low) and now it is trading near diagonal resistance (in 4-H completed 123 move ) which indicates possible bullish move.
3. in 4-H time frame price breaks the RBS zone after having made HH bottom with efficient move (123 move) and now as of publication of this analysis it is trading near diagonal resistance. it price managed to break it then we may see strong bullish move.
4. in 1-H time frame, price did MSS towards bullish direction with efficient move which indicates possible bullish move at least up to 4445 to grab upside liquidity.
5. in 15-M, 5-M it bullish structurally and moving bullish side.
Best of luck,
Caution:
Never risk more than 1% of principal to follow any position.
Support us by liking and sharing the post. Long 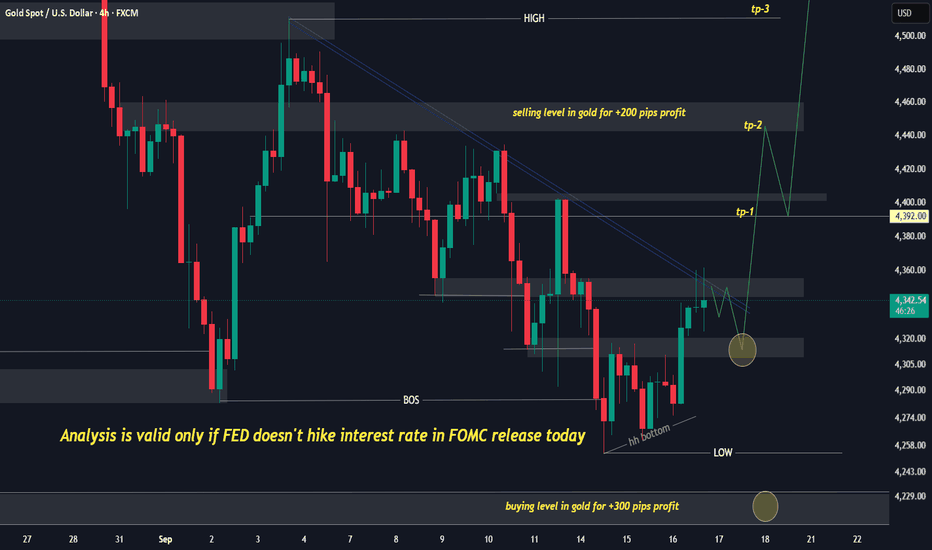
Long 
Short 
Short 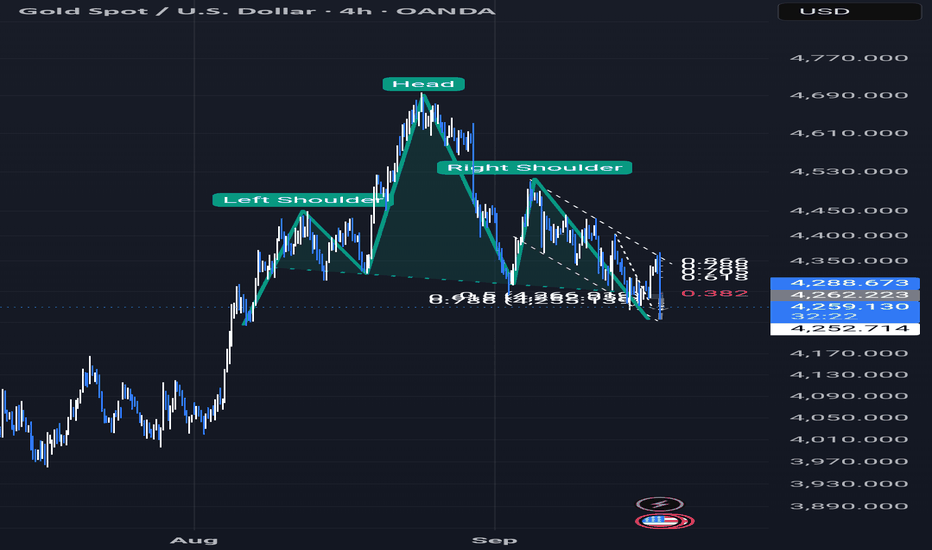
 Long
Long
Gold Watchlist: Bullish Signal Inside CompressionGold remains pressured by oil-driven inflation fears and expectations of tighter Fed policy. That keeps the macro backdrop cautious for gold.
🤖 AI Agent Signal:
The AI Agent shows a bullish reading. RSI is around 55.4, at the bullish threshold, while the MACD histogram is above zero. This points to improving short-term momentum, but the signal still needs price confirmation.
📊 Technical Analysis:
Gold is trading near $4,304 inside a narrowing triangle. Price is holding above EMA 9 near $4,295, but remains close to SMA 50 near $4,306 and below EMA 200 near $4,367.
Breakout trigger zone: $4,306–$4,335
A bullish continuation needs a clean 1H close above this zone.
Targets after breakout:
Target 1: $4,367
Target 2: $4,438
If price fails here and drops back below $4,295, the bullish signal weakens.
The AI signal is bullish, but the chart has not confirmed a breakout yet. Gold remains in compression, so confirmation matters more than prediction.
⚠️ Not financial advice. Long