XAUUSD – Bearish Structure Broken, But 4,447 Is KeyXAUUSD – Bearish Structure Broken, But 4,447 Is Key
Gold is starting to show a more constructive recovery after breaking the short-term bearish market structure.
Price is trading around 4,378 after reacting strongly from the lower support area near 4,240 – 4,260. The chart shows that the previous bearish trendline has been violated, and price is now holding above the buy order zone around 4,349. This is an important change because sellers no longer have the same clean control they had during the earlier decline.
However, gold is not fully bullish yet. The market is now entering a confirmation phase. Buyers need to defend the current support and push price above the next resistance zone before the recovery becomes stronger.
Technical view:
Gold broke the short-term bearish structure.
Price is holding above the buy order zone around 4,349.
The current reaction area is near 4,378 – 4,402.
The first important resistance is around 4,447.
This area also aligns with Fibonacci resistance and FVG structure.
If gold breaks above 4,447, buyers may continue toward 4,593.
The 4,593 area is a major liquidity and Fibonacci resistance zone.
If gold fails to hold 4,349, the recovery structure may weaken and price may retest 4,240 – 4,260.
Key levels to watch:
Current price: 4,378
Buy order support: 4,349
Short-term confirmation: above 4,402
Key resistance: 4,447
Major liquidity target: 4,593
Lower support: 4,240 – 4,260
Bullish invalidation: below 4,349
Main scenario:
If gold holds above 4,349 and breaks back above 4,402, buyers may try to push price toward 4,447.
A clean breakout above 4,447 would confirm stronger bullish recovery momentum and open the way toward 4,593.
This would turn the recent move from a simple correction into a more meaningful recovery structure.
Alternative scenario:
If gold fails to hold above 4,349, the breakout may become a false recovery.
In that case, sellers may try to pull price back toward the previous support zone near 4,240 – 4,260 before buyers appear again.
Hannah’s view:
Gold is showing the first sign of recovery, but confirmation is still needed.
The bearish structure has been broken, which is a positive signal for buyers. But the market is now sitting between support and resistance, so I do not want to chase the move too early.
Main view: gold can continue higher if 4,349 holds and price breaks above 4,447. The next larger target would be 4,593. If 4,349 fails, gold may return to the lower support area before building a stronger setup. No confirmation means no trade.
Do you think gold can break 4,447, or will sellers defend the Fibonacci resistance again?
 Long
Long
Weekly View On Japanese Yen (Week 39/2026)Weekly View On Japanese Yen (Week 39/2026)
JPY just made a 50% retracement from the recent high, compared to the recent August low.
The strong volume surges during the upmoves also suggest that we have strong buying interest coming in during the move.
We are in a cycle of yen intervention from the BOJ, in an attempt to strengthen the currency.
Going forward, I am expecting further strength in JPY, but it is better to time the trade with a supporting bullish daily candle. and the break of the bearish trend line..
DYODD, all the best and read the disclaimer too.
Feel Free to "Follow", press "LIKE" "Comment".
Thank You!
Legal Risk Disclosure:
Trading crypto, foreign exchange or CFD on margin carries a high level of risk, and may not be suitable for all investors.
The high degree of leverage can work against you as well as for you.
Before deciding to trade foreign exchange you should carefully consider your investment objectives, level of experience and risk appetite.
The possibility exists that you could sustain a loss of some or all of your initial investment and therefore you should not invest money that you cannot afford to lose. You should be aware of all the risks associated with foreign exchange trading, and seek advice from an independent financial advisor.  Long
Long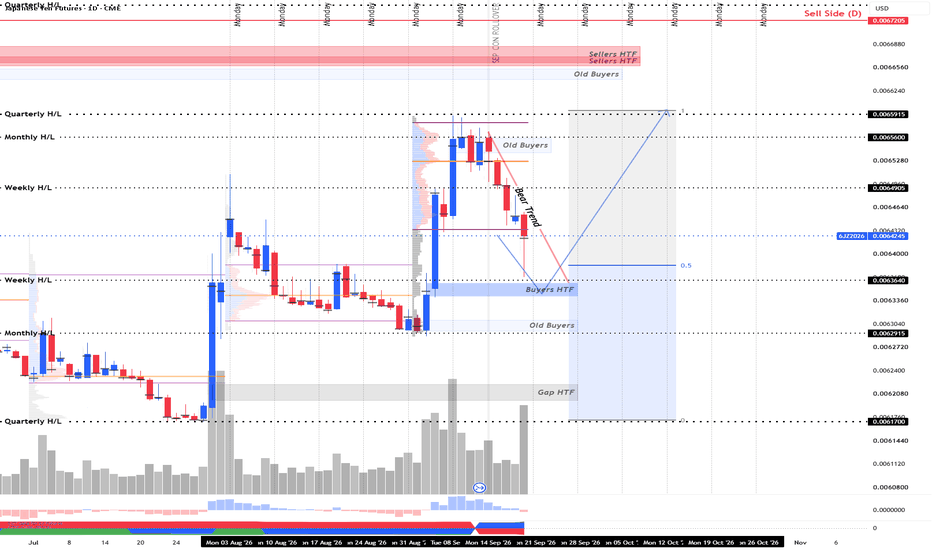
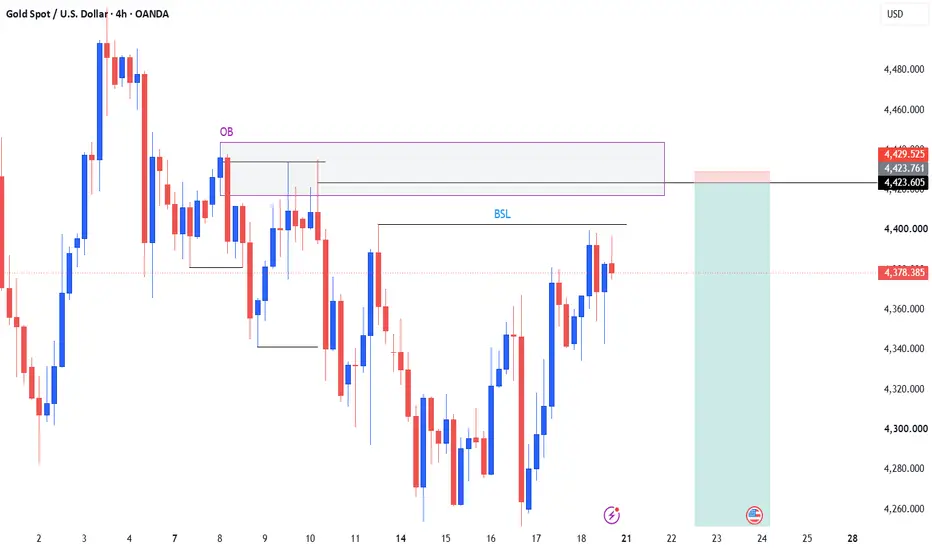
Possible Short on GoldTo provide a comprehensive and detailed Smart Money Concepts (SMC) breakdown of the chart, we have to look closely at the precise algorithmic mechanics playing out across the price action. On the left side of the chart, notice the sharp, multi-candle downward displacement that rapidly breaks prior swing lows. In SMC, this is not random selling; it is institutional sponsorship. Large market participants aggressively drive price downward, creating a structural break that dictates the macro bearish bias and leaves behind unmitigated supply zones that algorithms are programmed to revisit. Following that impulsive drop, price forms a corrective, multi-candle retracement moving upward toward the horizontal resistance lines.
This upward crawl is an intentional mitigation phase where institutional algorithms guide price back into a premium zone (specifically, the origin of the move down or the unmitigated order block) to rebalance leftover resting sell orders and fill market inefficiencies. As price creeps into this upper resistance band, it actively targets buy-side liquidity (BSL)—meaning the resting stop-losses of early short sellers and breakout buy orders from retail traders attempting to trade a reversal. Smart money uses this concentrated pocket of liquidity as fuel, absorbing the retail buy orders to effortlessly build and scale massive net-short institutional positions at the optimal high price. The shaded projection zone highlights where institutional distribution completes. Once price fully taps into that order block and clears the external liquidity above the range, traders look for a lower-timeframe Change of Character (CHoCH) or Market Structure Shift to confirm the rejection, allowing them to ride the subsequent impulsive continuation down toward deep discount targets. Short 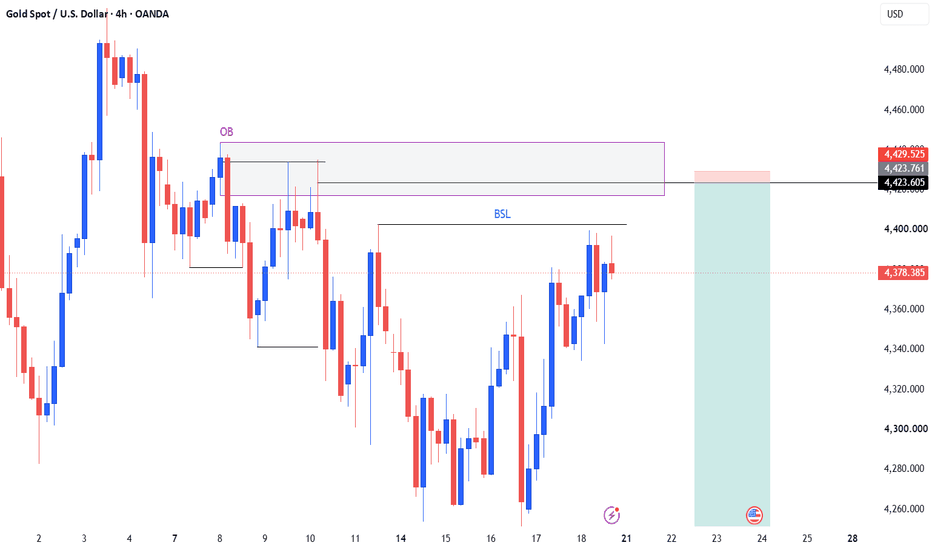
Short 
Brent 4H | 21–25 Sep 2026Last Week Recap | 14–18 Sep 2026
Brent crude prices were highly volatile throughout the week. Early in the week, Brent climbed close to $110/bbl amid concerns over supply disruptions in the Middle East, particularly damage to Saudi Arabia's oil infrastructure and developments around the Strait of Hormuz.
Prices subsequently declined toward the end of the week after Saudi Arabia increased exports through Oman, while concerns over supply disruptions began to ease to some extent.
By the end of the week, Brent closed at approximately $104.16/bbl. Oil prices continued to receive support from ongoing tensions in the Middle East but faced pressure from expectations that supply would gradually recover, as well as US crude inventory data showing a smaller-than-expected decline. Elevated oil prices also increased concerns over potential demand weakness.
Fundamental Analysis | 21–25 Sep 2026
Bias: Sideway to Bullish
This week, the market will continue to focus primarily on Geopolitical Risk and Supply Disruptions, particularly developments between the US and Iran, attacks on Saudi Arabia's energy infrastructure, and shipping activity through the Strait of Hormuz. If oil transportation does not return to normal, a Geopolitical Premium is likely to remain embedded in oil prices.
However, the upside could remain limited by Saudi Arabia's efforts to restore supply and its plans to offer additional oil exports through Oman. If tensions in the Middle East begin to ease, profit-taking could emerge and the Geopolitical Premium could gradually decline.
Another key factor to monitor is US Crude Inventories and the Demand Outlook. Recent data showed that US crude inventories declined by only around 640,000 barrels, less than the market expected. Meanwhile, oil prices above $100/bbl could begin to weigh on demand in the coming period.
Overall: Brent could remain Sideway to Bullish, with supply risks remaining the main supporting factor. However, after the strong rally and Brent approaching $110/bbl, investors should watch for profit-taking and a potential decline in the Geopolitical Premium if the Middle East situation improves.
Technical Analysis — BRENT 4H
BRENT maintains a Sideway to Bullish outlook, with price continuing to trade above the EMA200 and the uptrend line, although the market has entered a short-term consolidation phase after reaching its recent high.
If price holds above the $103.60 support, Brent could recover and retest the $113.73 resistance. Conversely, a break below $103.60 could lead to a pullback toward the $99.20 support before the next directional move is determined.
Bias: Sideway to Bullish
Resistance: 113.73
Support: 103.60 / 99.20
Target: 113.73
Cut Loss: Below 99.20  Long
Long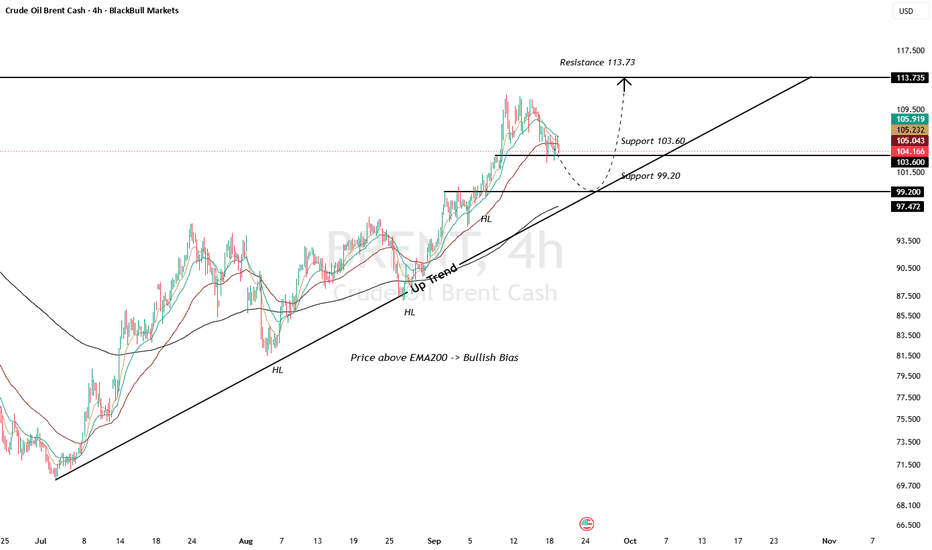
 Short
Short
Gold Analysis - Weekly Sept 19Weekly remains bearish and Daily remains bearish, while 4H and 1H are currently bullish internally. The lower-timeframe bullish structure appears to be developing as a corrective move within the higher-timeframe bearish structure.
On 4H, price has shifted from bearish to bullish structure and is currently approaching the major 4H external structural high around 4,400. A break above this high would confirm continuation of the 4H bullish structure, while a break below the established 4H higher-low structure would invalidate the current bullish sequence.
On 1H, structure remains bullish following the earlier MSS, with price continuing to form HHs and HLs. A rejection from the 4H external high does not by itself establish bearish structure. For the Daily bearish thesis to gain lower-timeframe confirmation, the 1H should first break its current HL, form a bearish MSS/CHOCH, and subsequently establish a LH and LL.
Therefore, the current market is structurally split: Weekly/Daily bearish, while 4H/1H bullish. The key question is whether the 4H/1H bullish structure can break the higher-timeframe structural resistance or whether the lower-timeframe bullish sequence fails and re-aligns with the Daily/Weekly bearish structure. Long 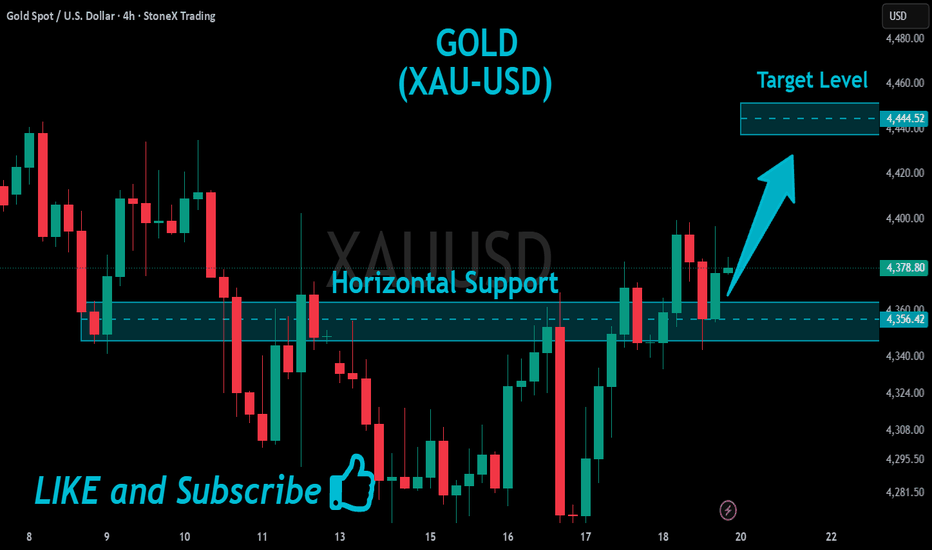
XAUUSD — Bullish Retest After Post-Fed RecoveryMarket Pulse
Gold is holding its post-Fed recovery as lower oil prices, a softer U.S. dollar and easing Treasury yields give buyers some breathing room.
However, the Fed has started tightening again and further rate hikes remain possible. This means Gold may stay volatile even while the short-term recovery continues.
What the Chart Says
XAUUSD is showing a stronger bullish H1 structure after the sharp recovery from the 4,260 area.
Price pushed through the previous CHoCH and reached the 4,390–4,400 main resistance area before starting the current pullback.
Gold is now trading around 4,369, close to the rising support trendline.
The first area I am watching is 4,348–4,358. This zone sits close to the previous breakout structure and could become the first place where buyers return.
If the correction becomes deeper, the 4,325–4,337 area is the stronger support zone below.
As long as these areas hold, the current move still looks like a bullish pullback rather than a full reversal.
Levels That Matter
4,398–4,410 — Main resistance
4,365–4,370 — Rising trendline / current structure
4,348–4,358 — First pullback zone
4,325–4,337 — Main support zone
4,260–4,270 — Post-Fed swing low
My Main Plan
The main plan remains bullish.
I prefer waiting for Gold to complete the pullback around 4,348–4,358.
If buyers defend this zone and bullish confirmation appears, price could recover toward 4,390–4,400 again.
A deeper move into 4,325–4,337 could still offer a valid continuation setup if support holds.
What I Need to See
I want the rising trend structure to remain intact and the pullback to create another higher low.
A sustained H1 break below 4,325 would weaken the immediate bullish setup and increase the risk of a deeper correction.
Final Read
The H1 structure still favors buyers after the strong post-Fed recovery, but Gold is now correcting from resistance.
For now, I prefer waiting for the pullback and bullish confirmation rather than chasing price higher, with 4,398–4,410 remaining the main upside area. Long 
Long 
Silver: A Correction Within Uptrend May Be CompleteSilver has made a very nice move to the upside, and we can clearly count five waves higher from the July lows, confirming that support was in place at least temporarily. In a basic Elliott Wave bullish setup, a five-wave impulsive advance is normally followed by a three-wave correction. If that correction remains corrective, it can represent a temporary pullback before the larger bullish structure resumes.
However, notice that silver came close to the 71.50 resistance level that we discussed previously, from where we saw a pretty strong reversal lower. Price also broke below the lower trendline support of the impulsive channel, which caused a deeper and complex WXY correction. We are now wondering if this correction has already completed, as the market is attempting to break above the upper channel resistance near 66.60.
A daily and weekly close above 66.60 would provide a stronger bullish confirmation and suggest that the ABC correction is complete. In that case, the next important resistance and upside target would again be the 71.50 area.
Basic Elliott Wave Bullish Setup Formation
The basic Elliott Wave guidelines are that wave 2 should not retrace beyond the start of wave 1, wave 4 should not overlap wave 1 in a standard impulse, and wave 3 cannot be the shortest of waves 1, 3, and 5. Once five waves are completed, an ABC correction can retrace part of the entire advance before the larger bullish trend resumes. In the current silver setup, the key question is whether the recent complex WXY correction has already found its low and whether the break above 66.60 can confirm the next bullish phase. Long 
Long 
Long 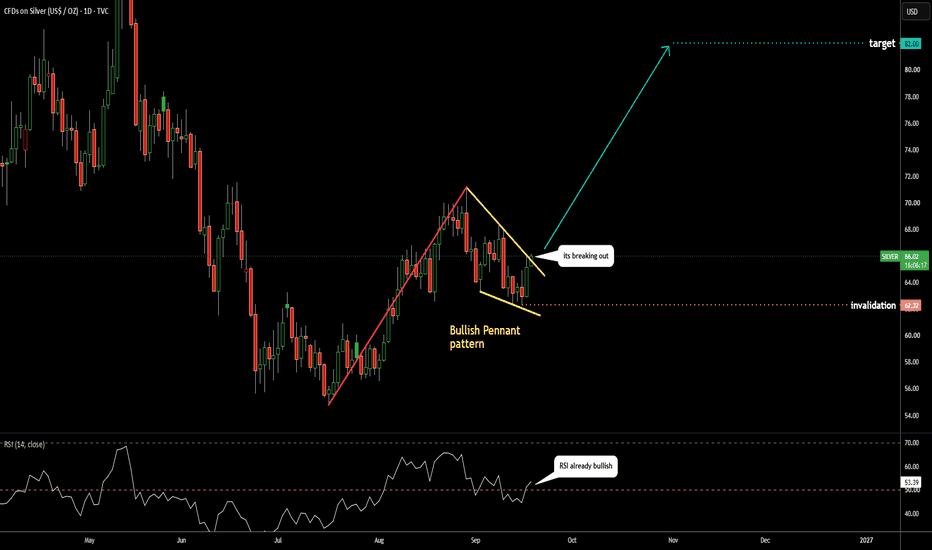
XAU/USD (Gold) 4H: Bullish Reversal at $4,254 SupportTechnical Analysis
Pattern Structure: On the 4-hour timeframe, Gold (XAU/USD) is completing a Falling Wedge / Descending Channel structure following a pullback from peak levels above $4,500.
Key Support Zone ($4,254 – $4,280): Price bounced directly off the major structural support demand zone (~$4,254). The lower boundary of the wedge aligns with this key historical level, forming a strong confluence zone.
Current Price Action: Gold is trading around $4,350, approaching the upper falling trendline resistance of the wedge pattern.
Trade Projection:
Pullback / Retest: A minor pullback toward the lower wedge boundary or $4,280–$4,300 zone is projected before a definitive breakout attempt.
Upside Target 1: Minor resistance region around $4,400.
Upside Target 2: Major resistance level at $4,481 – $4,500.
Fundamental Analysis
Central Bank & Real Yield Dynamics: Gold has rebounded above $4,300 as markets absorb recent macroeconomic developments, including Federal Reserve interest rate expectations and global central bank demand.
Inflation & Commodity Pressures: Elevated energy prices (crude oil firming near $100+) and ongoing structural inflation trends keep safe-haven demand intact.
Macro Backdrop: Safe-haven allocations and long-term debasement hedges continue to provide a solid baseline demand for precious metals despite short-term interest rate volatility.
Trade Parameters Summary
Level Price Level (USD) Notes
Primary Support $4,254.35 Major horizontal demand zone & wedge floor
Immediate Pivot / Entry Zone $4,280.00 – $4,320.00 Pullback buy zone / Trendline retest area
Intermediate Resistance $4,400.00 First structural supply zone
Major Target / Resistance $4,481.80 – $4,500.00 Primary pattern objective
Disclaimer
This analysis is strictly for educational and informational purposes only and does not constitute financial or investment advice. Trading Forex and precious metals involves significant risk of monetary loss. Always conduct your own research, use proper risk management, and consult a certified financial advisor before placing any live trades. XAGUSD 4H | Demand Zone Reaction & Bullish Continuation SetupXAGUSD 4H — Smart Money Structure & Key Levels
Silver is currently trading around 64.63, with price reacting from the marked demand/support area around 62.40–61.90. The recent structure shows a recovery from the lower demand zone, while the chart is approaching important resistance levels.
Market Structure
Previous price action established multiple BOS and CHoCH formations, showing shifts in market structure.
The recent reaction from the 62.40–61.90 demand zone indicates that buyers are defending this area.
The current move is approaching 65.32, which is an important short-term structure/resistance level.
A confirmed break and close above 65.32 could provide additional bullish structure confirmation.
Key Resistance Zones
65.32 — Immediate resistance / confirmation level
68.20 — Major supply/resistance zone
71.04 — Higher-timeframe resistance / weak-high area
If price reaches the 68.20–71.04 region, watch the reaction carefully for rejection, liquidity sweep, or another structural shift.
Key Support / Demand
62.40–61.90 — Primary demand zone marked on the chart.
A sustained hold above this area keeps the recovery structure relevant. A decisive breakdown below the zone would weaken the bullish setup and require a fresh market-structure assessment.
Trade Plan
Rather than entering solely because price reaches a level, wait for confirmation such as CHoCH/BOS, rejection, or a valid retest on the lower timeframe. This can help reduce entries based only on anticipation.
Important: This is a technical analysis scenario, not a guaranteed trade signal. Always manage risk according to your own strategy and avoid risking more than you can afford to lose. Long 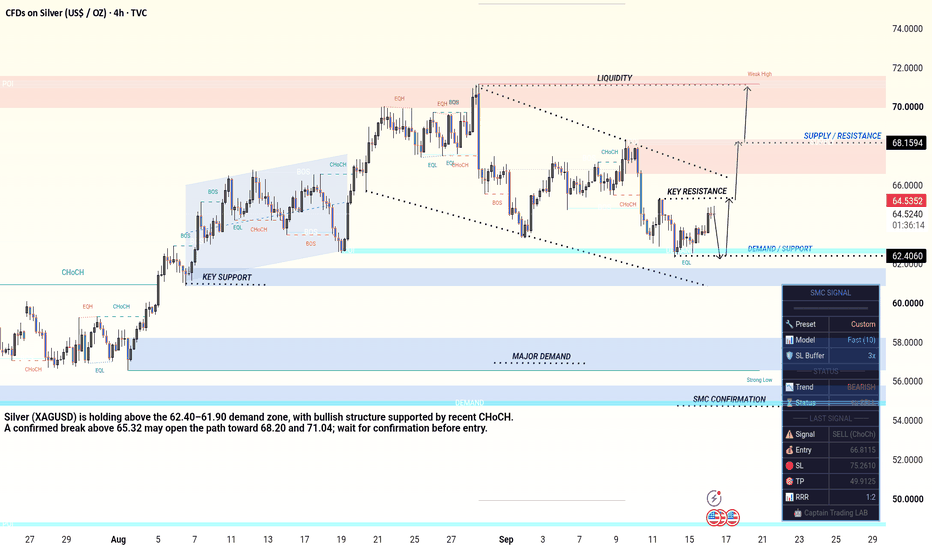
XAUUSD: Can Sellers Push Gold Toward the 4,240 Support Zone?Hello everyone, here is my breakdown of the current XAUUSD setup.
Market Analysis
XAUUSD previously formed a Rounding Top near the highs before breaking lower and shifting bearish. Price then entered a downward channel, where multiple breakouts above the Resistance Zone were rejected and price moved back lower.
Currently, XAUUSD is trading below the 4,400 Resistance Zone while holding above the 4,240 Support Zone and respecting the downward channel. The recent rejection suggests sellers may attempt another move lower.
My Scenario & Strategy
As long as XAUUSD remains below the 4,400 Resistance Zone and respects the downward channel, the bearish scenario remains valid. A continuation lower could push price toward the 4,240 Support Zone (TP1).
However, a breakout and close above 4,400 would weaken the bearish outlook and increase the possibility of further upside.
That’s the setup I’m tracking. Thank you for your attention, and always manage your risk. Short 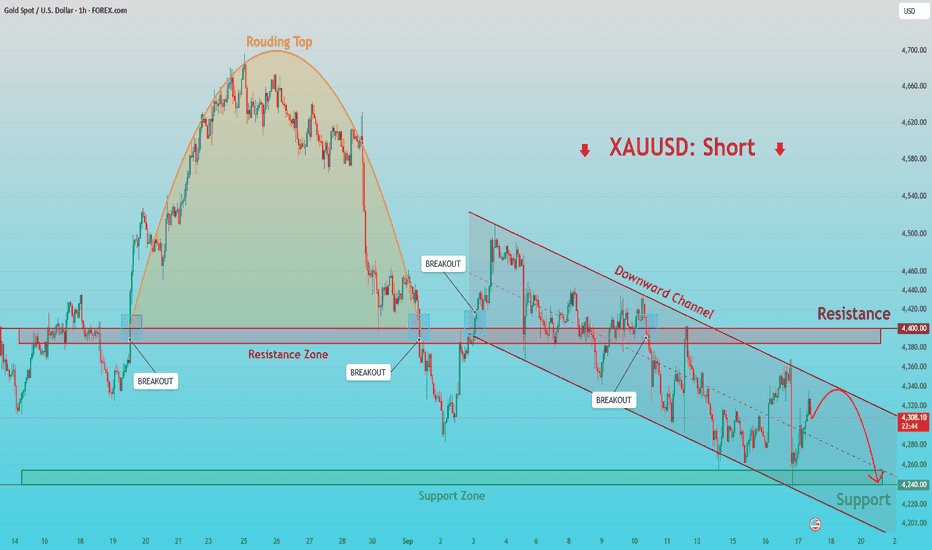
Long 
Short 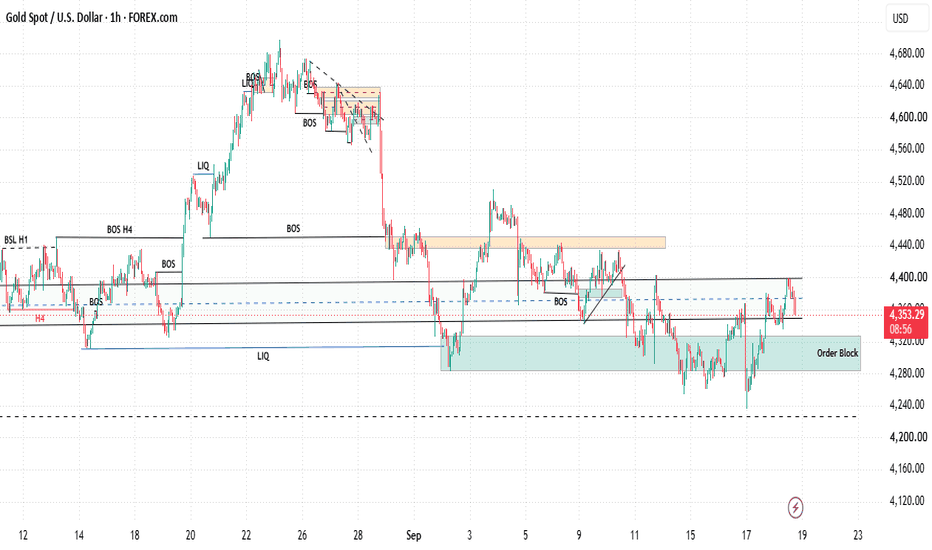
XAUUSD Bullish Reversal Toward ResistanceXAUUSD is showing a bullish recovery from the **4,260–4,270 support zone** after breaking the descending trendline. The recent **CHoCH (Change of Character)** indicates a potential shift toward bullish momentum. Price is now holding above the **4,335–4,345 area**, which can act as a near-term support.
If buyers maintain control above this area, the next major objective is the **4,401 target**, followed by the **4,420–4,440 resistance zone**.
**🎯 Target:** 4,401
**🛡️ Key Support:** 4,335–4,345
**📈 Resistance Zone:** 4,430–4,440
Bullish continuation while price holds above the CHoCH/support area.
Long 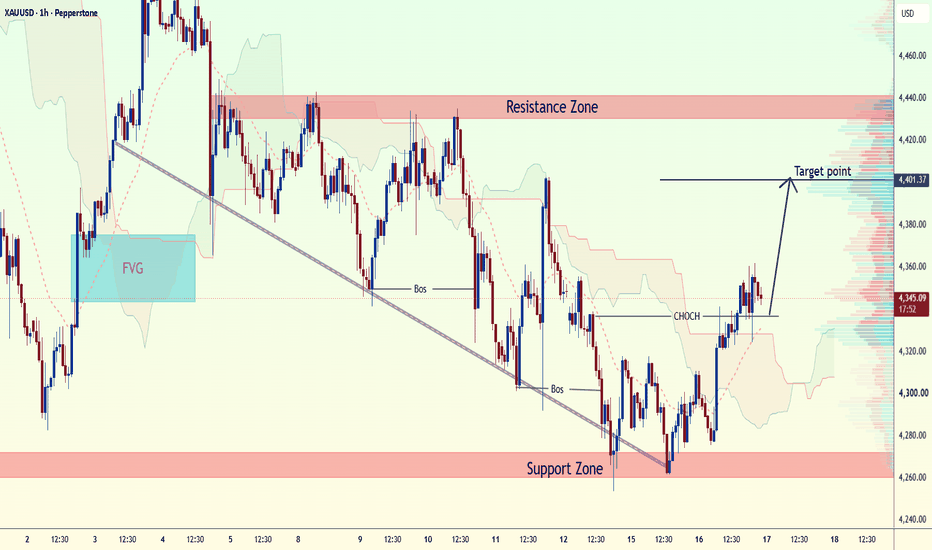
Short