Long
Long
THE KOG REPORTTHE KOG REPORT:
In last week’s KOG Report we had a pretty simple plan, short down into defence, let price attack the lower defence box, wait for a reversal, and then long back up!
It was another choppy week, most of the captures were made on the scalps and intra-day charts rather than the swing, but as you can see we did come down in the end and bounce. The first attempt was during the PMI release where we hit the hot spot and bounced, the 2nd was on Friday where we bounced the defence box and managed to capture a long to end the week.
It was actually a tremendous week in Camelot, not only on Gold but the EA’s and algo’s are performing on numerous pairs for our traders and the hit rate is consistently impressive.
So, what can we expect in the week ahead?
As a reminder, we have FOMC this week so expect more choppy price action and a lot of sudden erratic movement, usually stop hunts. So again for this week, this report is only applicable for the first half of the week and again, it’s going to be a scalp only half of the week until FOMC has made the move.
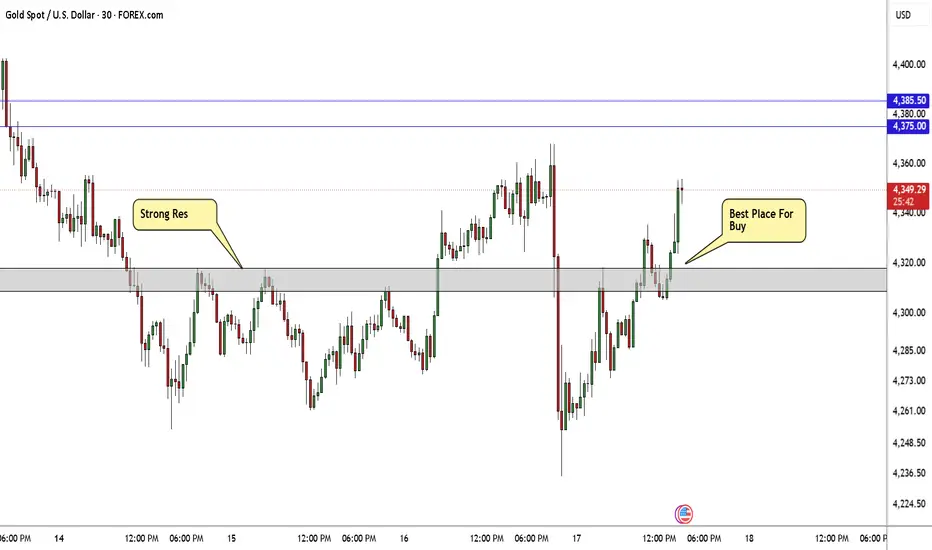
We have 3 key levels here, above the 4355-60 region, below the 4330 region and then a very important level of 4320. This level of 4320 has potential here if we reject the higher resistance level on the open, but it’s a level that needs to be watched for a break!
Failing to breach 4320 could give the opportunity to then attempt the break of 4400 again but that first hurdle above is the 4395-9 region which must break to go higher, rejection there can again bring us down this time breaking below 4300 with the ideal target region being around the 4210 level.
In Summary:
Levels to monitor: 4320 needs to break, 4355-60 needs to break, key level above 4399, overall bearish below 4399.
KOG’s bias of the week:
Bullish above 4360 with target above 4383
Bearish below 4330 with target below 4296
As always, we’ll update traders during the week and hopefully release the FOMC KOG Report shortly before the event.
Please do support us by hitting the boost button, leaving a comment, and giving us a follow. We’ve been doing this for a long time now providing traders with in-depth free analysis, education, targets and indicators on Gold, so your likes and comments are very much appreciated.
As always, trade safe.
KOG
MESZ Sep 17: Bullish Above 7656 — Targets 7720, 7750 & 7770MESZ bounced strongly from yesterday’s lows and is now trading around 7,716, giving the short-term structure a bullish tone.
The first intraday pullback area I’m watching is around 7,682. If buyers defend that zone, the first upside liquidity target is 7,720.
Above 7,720, the next target is 7,750, followed by the major resistance area around 7,770.
The descending higher-time-frame trendline is still in play, so I’ll be watching carefully for reactions as price approaches those upper levels.
On the downside, 7,656 is the key level protecting the bullish structure.
Key levels: 7,682 pullback zone, 7,720 first target, 7,750 second target, 7,770 major resistance, 7,656 key support.
Bullish: hold 7,682 → 7,720 → 7,750 → potentially 7,770.
Bearish warning: lose 7,656 with confirmation → bullish structure weakens.
Not financial advice. No confirmation, no trade. CME_MINI:MESZ2026  Long
Long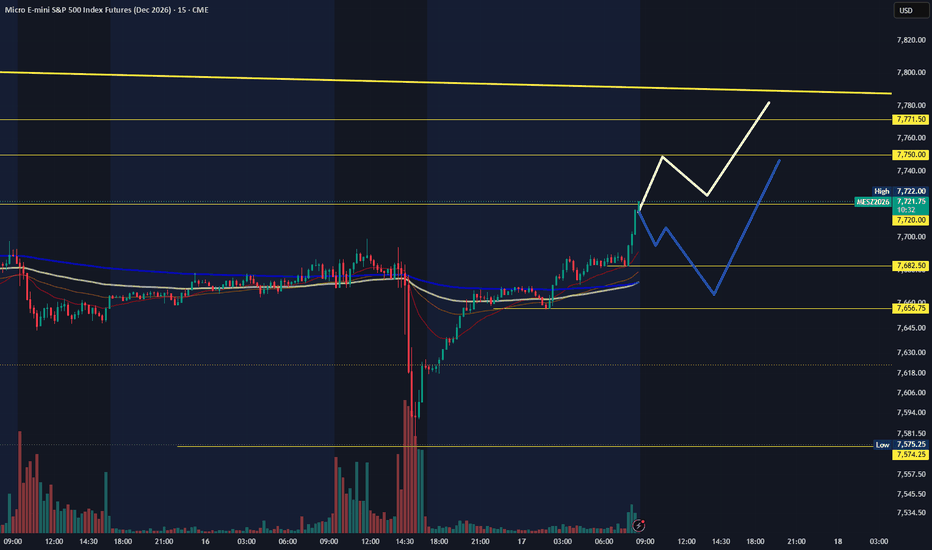
Long 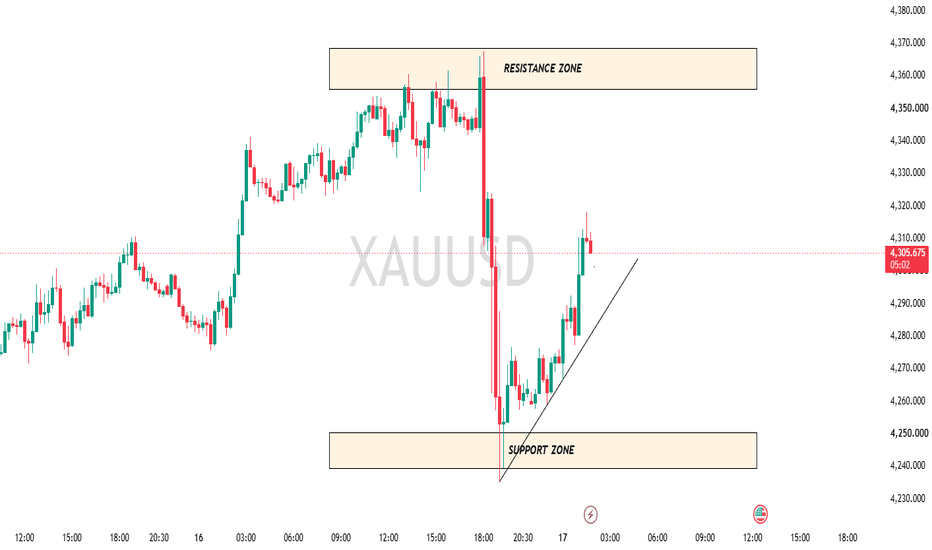
Gold / U.S. Dollar (XAUUSD)🟡 Gold / U.S. Dollar (XAUUSD)
Could a Breakout from This Compression Define Gold’s Next Medium-Term Move? 📊🔥
Hello everyone and welcome back to all my TradingView followers! 👋📈 I hope you are all doing well and trading with patience, discipline and proper risk management.
Today, we are looking at Gold versus the U.S. Dollar (XAUUSD), a market currently influenced by a combination of global uncertainty, USD strength, U.S. interest rates, Treasury yields and geopolitical risks. 🌍⚠️
🌍 Fundamental View | Higher Rates, Stronger USD and Pressure on Gold 💵📈
Global markets remain highly volatile.
On one side, geopolitical tensions and economic uncertainty continue to support demand for safe-haven assets. On the other side, the latest increase in U.S. interest rates and higher Treasury yields can create pressure on non-yielding assets such as gold.
The Federal Reserve recently raised its policy rate by 25 basis points to a range of 3.75%–4.00%. The possibility of further restrictive policy has supported the U.S. dollar and increased the opportunity cost of holding gold.
Reuters
+1
The potential short-term mechanism is:
Hawkish Fed → Stronger USD → Higher Bond Yields → Higher Opportunity Cost → Pressure on Gold 📉
However, gold is not driven by interest rates alone.
Other important factors include:
🔹 Geopolitical tensions 🔹 Safe-haven demand 🔹 Central-bank purchases 🔹 Investment flows 🔹 Recession concerns 🔹 Sovereign debt and fiscal risks
Therefore, the reaction to higher rates is not always one-directional. Still, in the short term, a stronger dollar and higher Treasury yields may remain important headwinds for gold. ⚠️
📊 Technical Analysis | XAUUSD
On the provided chart, gold has entered a compressed consolidation structure after a previous bearish move.
This short-term compression is developing inside a broader 4H structure, and price is now approaching important technical decision zones. 👀
🔴 First Resistance Zone:
4368 – 4402
This is the key resistance area near the current price.
Above this zone, the next important resistance is around:
🎯 4474
🟡 Main Support Zone:
The major support area is approximately:
4260 – 4270
The smaller short-term consolidation area around 4310–4325 may also be relevant for intraday reactions.
🐂 Bullish Scenario | Confirmed Breakout for Medium-Term Longs 📈
If price breaks above the 4368–4402 resistance zone with strong momentum and confirms the breakout on the 4H timeframe, the structure could shift in favor of buyers.
A more reliable bullish sequence would be:
Breakout → Retest → Confirmation 🎯
After a confirmed breakout, the 4474 area could become the next important resistance and potential target.
For a medium-term long setup, a temporary move above resistance may not be enough. Ideally, traders should look for:
🟢 A 4H candle close above resistance 🟢 Price acceptance above the breakout zone 🟢 A successful retest 🟢 Reduced selling pressure during the retest
🐻 Bearish Scenario | Breakdown of the Compression and Support 📉
If gold fails to break the resistance zone and selling pressure returns, the 4260–4270 support area becomes extremely important.
A confirmed breakdown below this zone could indicate that the short-term bullish structure is weakening and that a deeper correction may develop.
In that case, it may be more reasonable to wait for:
Breakdown → Failed Retest → Continuation
The bearish scenario could become stronger if the breakdown occurs alongside:
💵 A stronger U.S. dollar 📈 Higher Treasury yields 🏦 Expectations of tighter Fed policy 🌍 Increasing global risk aversion
Under these conditions, fundamental and technical pressure could reinforce each other.
🧠 Final View
Gold is currently approaching an important decision point.
Fundamentally, higher U.S. interest rates and a stronger dollar may create short-term pressure on gold. However, geopolitical uncertainty and safe-haven demand can still provide support.
Technically, price is trading inside a compressed structure, making the reaction to the key levels particularly important:
🔴 Break and confirmation above 4368–4402: higher potential for a move toward 4474. 🟢 Support holds around 4260–4270: further consolidation and another bullish attempt remain possible. 🐻 Confirmed support breakdown: the probability of a deeper correction increases.
For now, the key is to wait for a confirmed breakout or breakdown, preferably supported by 4H price action, because volatile markets can produce false breakouts. ⚠️
🗳️ What is your view? 🤔
Where do you think gold is heading next?
🟢 Bullish: Breakout above 4368–4402 and a move toward 4474 🔴 Bearish: Breakdown below 4260–4270 and a deeper correction 🟡 Neutral: Continued compression between support and resistance
Share your opinion in the comments! 👇💬
⚠️ Disclaimer |
English: This analysis is for educational and informational purposes only and does not constitute financial or investment advice. Trading financial markets involves substantial risk, especially when leverage is used. Always conduct your own research and apply proper risk management before making any investment decision.
🏷️ Tags
#Gold #XAUUSD #GoldTrading #GoldAnalysis #PreciousMetals #USD #USDollar #FederalReserve #Fed #InterestRates #TreasuryYields #BondYields #Inflation #SafeHaven #Geopolitics #Forex #Commodities #TechnicalAnalysis #FundamentalAnalysis #TradingView #MarketAnalysis #RiskManagement #Bullish #Bearish #Breakout #GoldPrice Gold Rises Again as Selling Pressure Eases📊 Market Overview:
XAU/USD is currently trading around 4,310–4,320 USD, after rebounding strongly from a low near 4,235 USD in the previous session. On September 17, gold reached around 4,318 USD, while Reuters reported that gold gained more than 1%, supported by a weaker USD and easing oil prices.
After the Fed raised interest rates and signaled that further tightening could remain possible, gold continues to face pressure from U.S. yields and expectations for higher interest rates. However, the USD's pullback from a 7-week high, along with lower oil prices, is supporting gold's short-term recovery.
📉 Technical Analysis:
• Key Resistance: 4,315–4,325 / 4,345–4,360 USD
• Nearest Support: 4,285–4,295 / 4,255–4,270 USD
• EMA: Price is attempting to reclaim the EMA 09 after the strong rebound from 4,235. However, the short-term structure has not fully turned bullish yet, as the medium-term moving averages remain above price. A TradingView-based analysis also identifies 4,316 as an important confirmation level; a clear break above this area could open the way toward 4,347.
• Candlestick / Volume / Momentum: The sharp decline toward 4,235–4,260 created a long lower wick, followed by strong dip-buying that pushed gold back above 4,300. RSI is currently around the neutral 48–50 zone, indicating that selling pressure has eased, but buyers have not yet gained full control.
📌 Outlook:
Gold could continue its short-term recovery if it holds above 4,285–4,295 and decisively breaks above 4,315–4,325. In that case, the next target could be 4,345–4,360.
Conversely, if gold is rejected below 4,315–4,325 and breaks below 4,285, selling pressure could return toward 4,255–4,270. The broader structure still requires caution as the Fed maintains a relatively hawkish stance.
💡 Proposed Trading Strategy:
🔻 SELL XAU/USD at: 4,320–4,325
🎯 TP: 40/80/200 pips
❌ SL: 4,328
🔺 BUY XAU/USD at: 4,285–4,295
🎯 TP: 40/80/200 pips
❌ SL: 4,278 Long 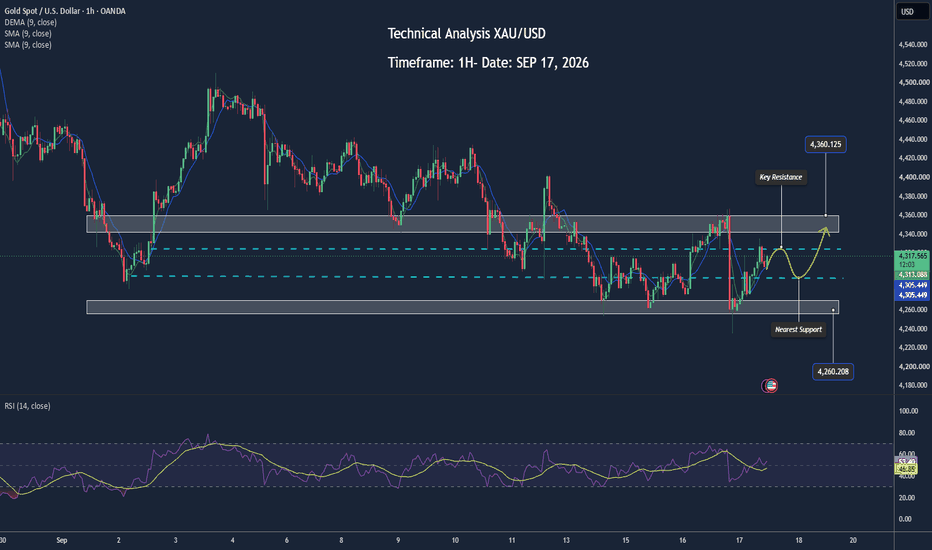
XAUUSD 1D | Liquidity, Imbalance & Institutional Price StructureXAUUSD 1D | Liquidity, Imbalance & Institutional Price Structure
This educational Gold chart provides a detailed study of daily candle behavior, liquidity movements, institutional price structure, Fair Value Gaps (FVG), BOS, CHoCH, supply, demand and important reaction areas.
The purpose of this analysis is to understand why each candle sequence creates a particular market reaction, rather than treating individual candles as isolated buy or sell signals.
Early Bullish Expansion — February
The chart begins with Gold recovering from the lower price region. The initial candles show relatively controlled buying, with several candles closing progressively higher.
The smaller bullish candles indicate that buyers are gradually absorbing available selling pressure. As the candle bodies become larger, bullish momentum increases.
A strong bullish displacement then breaks above previous short-term highs. This is important because the candle does not simply create a wick above resistance—it establishes a stronger closing position.
This structural break creates the first important BOS and confirms a change in short-term order flow.
Strong High Formation
After the initial expansion, Gold reaches the 5,400 area.
The candles near this region become more volatile. Some candles produce long upper wicks, showing that buyers continue testing higher prices while sellers begin responding.
The reason the high becomes important is the combination of:
Previous High + Liquidity + Rejection + Failure to Continue
The subsequent bearish candles confirm that the buying momentum is temporarily weakening.
FVG Development
During the strong directional candles, several Fair Value Gaps are created.
These FVGs represent areas where price moved rapidly and relatively little two-sided trading occurred.
When later candles return toward an FVG, the reaction becomes educationally important.
A bullish reaction from an FVG can indicate that buyers are defending the imbalance, while a clean breakdown through it can show that the imbalance is losing relevance.
An FVG alone should never be treated as guaranteed support or resistance.
March Structure & CHoCH
As Gold moves through March, the candles become more mixed.
Bullish candles attempt to recover previous highs, but bearish candles repeatedly appear around the upper supply region.
Eventually, price begins breaking an important short-term higher-low structure.
This produces a CHoCH-type transition.
The key reason this matters is that the market is no longer maintaining the same sequence of higher highs and higher lows.
The candle close below structure provides more information than a simple intraday wick.
Bearish Displacement — March to June
After the structural shift, Gold develops a prolonged bearish phase.
The larger bearish candles demonstrate stronger selling pressure.
Between these bearish impulses, smaller bullish candles appear. These candles represent temporary retracements because sellers continue to control the broader structure.
The repeated pattern becomes:
Bearish Impulse → Small Recovery → Lower High → Bearish Impulse
This sequence creates multiple Lower Highs and Lower Lows.
Several bearish displacement candles also leave FVGs behind, providing visible evidence of inefficient downside movement.
BOS & Structural Breakdown
As price continues lower, an important bearish BOS develops.
The significant candle is the one that closes below the previous structural low.
This is different from a candle that only briefly trades below support and closes back above it.
A decisive close indicates stronger acceptance at lower prices and gives the bearish structure more confirmation.
June–July Demand Formation
Gold eventually reaches the lower 4,000–4,200 region.
Here, the character of the candles changes.
Instead of continuous large bearish bodies, candles become smaller and begin producing longer lower wicks.
The reason is that sellers are still attempting to push lower, but buyers are absorbing the selling pressure.
Several candles repeatedly fail to establish new lows.
This creates an important demand and liquidity formation area.
Weak Low & Liquidity
The 3,927.190 area becomes a major structural reference.
Repeated tests around the low create sell-side liquidity.
A liquidity sweep can occur when price temporarily moves below an established low and then rapidly returns above it.
The important confirmation comes from the candles following the sweep.
A single wick does not automatically confirm a reversal; sustained bullish closes and a structural shift provide stronger evidence.
August Market Structure Shift
From the lower demand area, Gold begins producing stronger bullish candles.
The first bullish candles establish the initial recovery.
As subsequent candles close above previous short-term highs, the recovery develops into a more structured bullish move.
The CHoCH/MSS around this phase indicates that short-term order flow is shifting from bearish to bullish.
The important candle sequence is:
Demand Reaction → Bullish Displacement → Break of Short-Term High → Higher Low → Continuation
August Bullish Expansion
Gold then accelerates upward.
Several candles display strong bullish bodies with relatively small upper wicks.
This indicates that buyers are maintaining control through the daily closes.
The expansion also creates fresh bullish FVGs.
When price later retraces into these areas, the candle reaction determines whether the imbalance is being respected or invalidated.
September Resistance Reaction
Gold reaches the 4,664–4,772 region, where the chart shows a significant supply/FVG area.
The candles entering this zone begin showing rejection.
Several candles have upper wicks, indicating that higher prices are being challenged by sellers.
The reason this region is important is that it combines:
Previous Structure + Supply + FVG + Liquidity
When multiple factors overlap, the area becomes a meaningful decision zone for educational analysis.
Recent Pullback
After the resistance reaction, Gold begins producing consecutive bearish candles.
The bodies become more prominent as price moves away from the upper supply area.
However, this decline should not automatically be classified as a complete bearish reversal.
The important question is whether the current bullish higher-low structure is broken.
Until major support is decisively lost, the move can technically remain a corrective retracement within the broader recovery.
4,439 Decision Area
The 4,439.311 region is currently an important internal structural reference.
Price has reacted around this level multiple times.
Bullish candles attempting to reclaim the area would indicate renewed buying interest.
Bearish candles closing below it would show increasing downside pressure.
The reaction of the next daily candles is therefore more important than simply touching the level.
4,347 Current Price Area
Gold is currently trading around 4,347.180.
The latest candles show a battle between buyers and sellers.
The recent bearish candles pushed price lower, but the lower wicks around the support region indicate that buyers are still responding.
This creates a short-term decision area.
A strong bullish candle followed by a higher close would provide evidence of recovery, while continued bearish closes would increase the possibility of a deeper retracement.
4,263–4,122 Demand Structure
The 4,263.746 to 4,122.835 region represents an important lower demand/FVG area.
If price retraces into this region, candle behavior should be monitored closely.
Important bullish evidence would include:
- Long lower-wick rejection
- Bullish engulfing candle
- Strong daily close
- Failed breakdown
- MSS/CHoCH
- Bullish displacement
The combination of these signals would provide stronger confirmation than any single candle pattern.
3,927 Major Structural Low
The 3,927.190 area remains the major lower structural reference visible on the chart.
A future test of this area would be significant because it represents the previous weak-low/liquidity region.
If sellers break below it with strong bearish displacement and daily acceptance, the previous bullish recovery structure would require reassessment.
Potential Bullish Continuation Path
The projected arrows on the chart represent a potential bullish scenario, not a guaranteed price path.
For the bullish structure to strengthen, Gold would need to reclaim the internal resistance around 4,439.311 and then challenge 4,664.937.
A confirmed daily breakout above the upper resistance region could bring the next major liquidity area around 4,772.524 into focus.
Above that, the 5,179.341 region represents a major higher-timeframe resistance/liquidity reference.
The quality of a breakout should be judged by the daily candle close, body strength and follow-through, rather than a temporary wick.
Candle-by-Candle Reading Method
This chart demonstrates that every candle should be evaluated through its relationship with the surrounding candles.
A bullish candle near demand has a different meaning from a bullish candle directly underneath major supply.
A bearish candle inside an established bullish trend may simply represent a pullback, while a bearish candle that breaks a protected higher low can represent a meaningful structural change.
Therefore, the analysis should follow:
Candle Body → Wick → Closing Position → Previous High/Low → Liquidity → FVG → Structure → Confirmation
This approach helps distinguish ordinary market noise from meaningful displacement.
Complete Market Structure
The complete Gold structure visible on the chart can be summarized as:
Bullish Expansion → Major High → CHoCH → Bearish Displacement → BOS → Demand Formation → Liquidity Sweep → MSS/CHoCH → Bullish Recovery → FVG Formation → Supply Reaction → Current Pullback → Decision Zone
The key educational levels are:
5,179.341 — HTF Liquidity / Resistance
4,772.524 — Buy-Side Liquidity
4,664.937 — Supply Mitigation
4,439.311 — Internal Range High
4,347.180 — Current Price
4,263.746 — Demand Reaction Area
4,122.835 — Institutional Demand
3,927.190 — Major Structural Low
The chart is designed to demonstrate how liquidity, imbalance and market structure interact with daily candle behavior. No single candle, FVG, BOS, CHoCH or level should be considered sufficient confirmation by itself.
Educational Disclaimer: This chart is strictly for educational and informational purposes only and does not constitute financial, investment or trading advice. Market conditions can change rapidly, and no setup, direction, breakout, target or price level is guaranteed. Always conduct your own analysis, wait for appropriate confirmation and use proper risk management before making any trading decision. Long 
Long 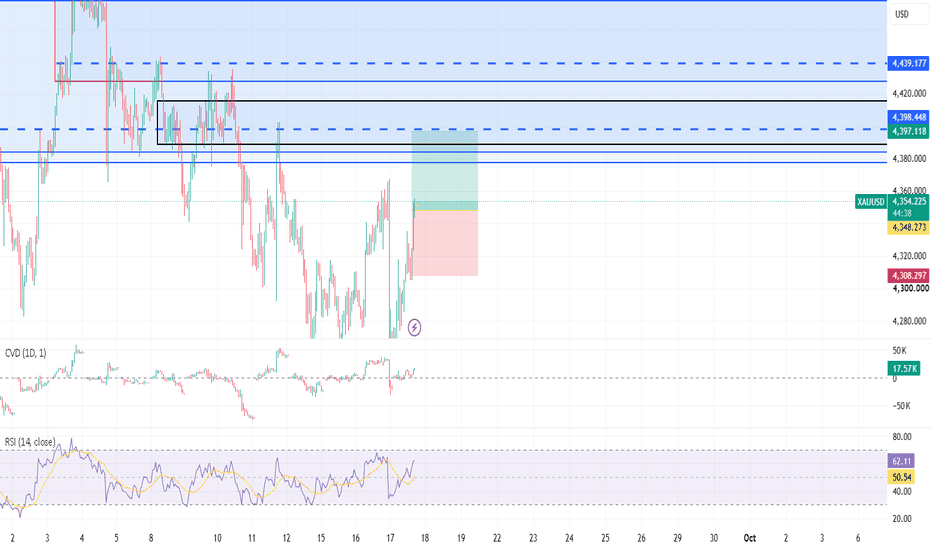
XAU/USD Buy Setup – Bullish Continuation Toward 4,420Gold is showing a bullish structure after bouncing from the 4,315–4,325 support zone shown on your chart. Price has formed higher lows and is moving above short-term resistance, indicating buyers remain in control. The marked support area is acting as a strong demand zone, and as long as price stays above it, the upside scenario remains valid.
The chart suggests a continuation move toward the 4,400–4,420 target area, which matches your highlighted resistance zone. A breakout above recent highs could accelerate momentum toward these levels. However, gold remains volatile due to recent Federal Reserve decisions, U.S. yields, and geopolitical developments. Recent market reports show gold rebounding after Fed-related volatility, while lower yields and safe-haven demand continue to provide support.
Reuters +1
Key Levels
Support: 4,315–4,325
Resistance: 4,380 / 4,400 / 4,420
Bullish Bias: Valid above 4,315
Risk Area: A break below 4,300 could weaken the buy setup Long 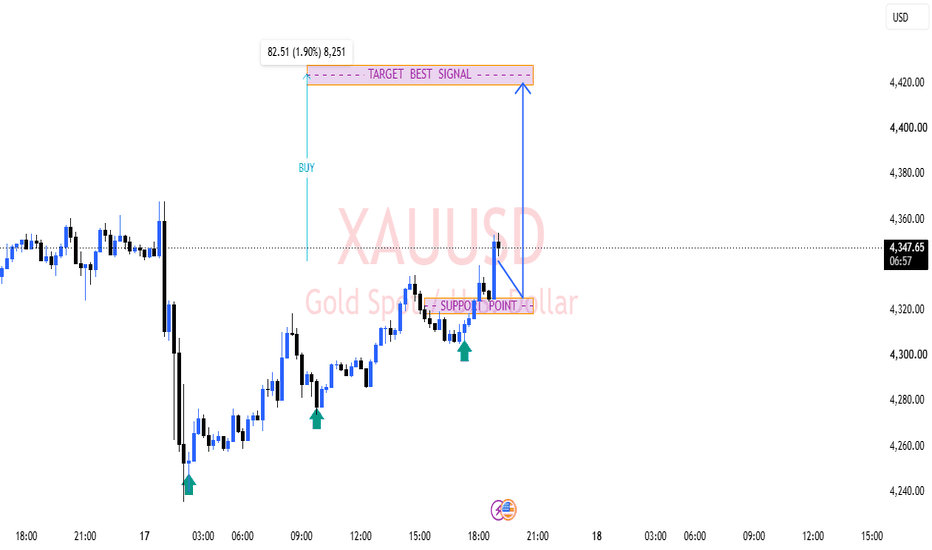
Long 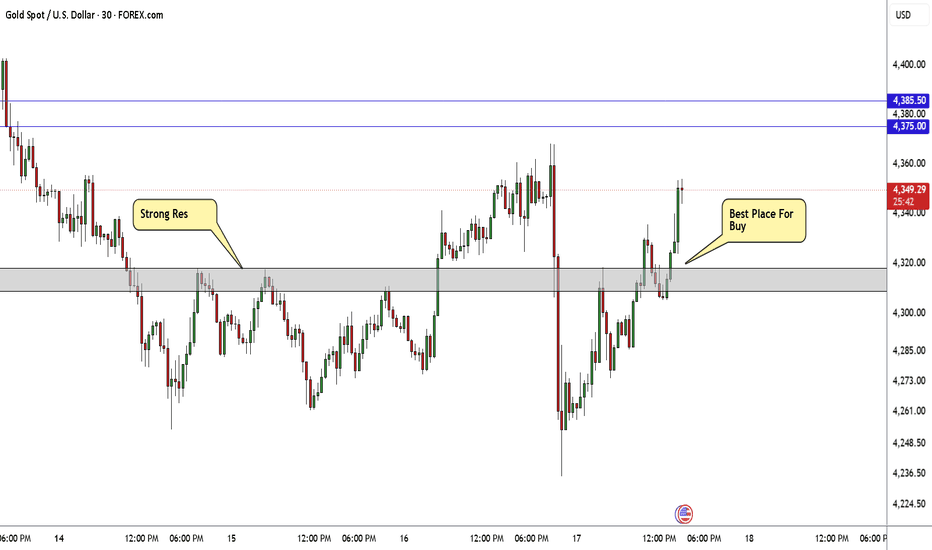
Gold pushed out of its value area into the US open, 4337 nowOANDA:XAUUSD , US session read from my KenKem Master Volume Profile (MVP) indicator & strategy.
CONTEXT
The US session opens at 12:30 UTC. Price ran from about 4324 to 4353 in three bars just before the open, and now trades above VWAP (about 4302) and above the EMA stack. The value-area high near 4337.5 has been cleared and the net-volume read leans to buyers, but a vertical move into an open often gets tested before it extends.
KEY ZONES
- Resistance / supply: 4354 (session high), then 4367 (prior swing high)
- Support / demand: 4337.5 (value-area high), then 4324
- Point of Control (volume magnet): about 4296 on M15, with the master POC near 4290
SCENARIOS (to watch, NOT signals)
Bullish: holds above 4337.5 on a closing basis, room toward 4354 then 4367 (acceptance above value).
Bearish: loses 4337.5, opens 4324 then the EMA cluster near 4310 (failed breakout back into value).
Range/unclear: stuck between 4337.5 and 4354, stand aside until a decisive close.
Invalidation: a close below 4324 voids this map.
WHAT THE MVP TOOL IS SHOWING
The Master Volume Profile plots rolling value areas (VAH/VAL), the Point of Control, and a net-volume pressure read to locate where volume is building or drying up. This idea is the qualitative output of that tool; the strategy's internal thresholds, gating and entry/exit logic are not disclosed.
Built with the KenKem Master Volume Profile indicator & strategy.
Technical analysis only, by KenKem's algorithm, NOT financial advice. Trade your own plan and manage your risk.
XAUUSD 4H | SMC FVG & Trendline EducationThis chart explains the complete price movement through Smart Money Concepts (SMC), market structure, liquidity, FVG, supply/demand and trendline behavior. Each candle has a purpose and gives information about the balance between buyers and sellers.
1. Initial Bearish Candles — Selling Pressure
The first sequence of bearish candles shows that sellers are dominating the market. The reason for the downward movement is strong selling momentum, with price continuously moving toward lower levels.
2. Consecutive Bearish Candles — Momentum Continuation
As the bearish candles continue, their bodies show that sellers are still in control. Buyers are unable to create a meaningful reversal, so price keeps respecting the bearish structure.
3. Small/Rejection Candle — Selling Pressure Weakens
When a smaller candle appears after the strong bearish move, it indicates that momentum is slowing. The reason is that sellers are beginning to face buying interest around the lower liquidity/demand area.
4. Lower-Wick Rejection — Buyer Response
The candle with a noticeable lower wick shows that price was pushed lower but buyers rejected those prices. This is important because it suggests that sell-side liquidity may have been collected before the reaction higher.
5. First Strong Bullish Candle — Demand Reaction
The strong bullish candle confirms that buyers are entering with greater strength. The reason for this move is the reaction from the demand/liquidity area combined with weakening bearish momentum.
6. Bullish Continuation Candles — Momentum Shift
The next bullish candles continue moving upward and begin creating higher prices. This shows that the short-term order flow is shifting from sellers toward buyers.
7. Strong Bullish Displacement — Structure Change
A larger bullish candle pushes through an important previous swing area. This is significant because strong displacement can indicate a Market Structure Shift / CHoCH.
8. FVG Formation — Price Imbalance
The rapid bullish movement leaves an imbalance between candles, creating a Fair Value Gap (FVG). The reason for the FVG is aggressive buying that moves price too quickly for balanced trading to occur.
9. Follow-Through Bullish Candles — Buyer Control
The candles after the displacement continue higher instead of immediately returning below the broken structure. This confirms stronger bullish participation and supports the developing bullish structure.
10. Pullback Candle — Temporary Profit Taking
A bearish or smaller pullback candle appears as price moves higher. This does not automatically mean a reversal; the reason can simply be profit-taking and temporary selling pressure after the previous bullish expansion.
11. FVG/Structure Retest — Decision Area
When price returns toward the previous imbalance or breakout area, the candles become important for confirmation. Buyers need to defend the zone; otherwise, price can move deeper into the previous structure.
12. Bullish Reaction — Support Confirmation
The bullish reaction from the retest shows that buyers are still active. The reason for the reaction is that the previous resistance/imbalance area is being treated as a potential support zone.
13. Trendline Interaction — Dynamic Resistance
As price approaches the descending trendline, candles become more sensitive. The trendline represents dynamic resistance, so traders watch for either rejection or a confirmed breakout.
14. Breakout Candle — Momentum Confirmation
A strong candle breaking through the trendline is important because it shows buyers are attempting to overcome the previous dynamic resistance. A candle close beyond the trendline provides stronger confirmation than a simple wick.
15. Retest Candles — Breakout Validation
The following candles help determine whether the breakout is being accepted. If price holds above the broken trendline and structure, the previous resistance can potentially act as support.
16. Strong Bullish Expansion — Continuation
Another sequence of bullish candles indicates renewed buying momentum. Higher highs and higher lows demonstrate that buyers are maintaining control of the developing structure.
17. Upper Liquidity Approach — Target Area
As price moves toward the previous swing high and upper resistance, the market approaches an area where liquidity may be concentrated. This is where traders should watch candle bodies, wicks, and rejection carefully.
18. Resistance/Rejection Candles — Supply Response
Any upper wick or bearish reaction near the premium area shows that sellers are responding. The reason is that higher prices can attract profit-taking and selling interest.
19. Current Structure — Decision Point
The latest candles should be read in relation to the trendline, FVG, structure and nearby liquidity. Rather than relying on one candle, the important question is whether price continues to respect the current structure.
🎓 Educational Lesson
The complete sequence can be understood as:
Bearish Pressure → Liquidity Sweep → Demand Reaction → CHoCH → Bullish BOS → FVG Formation → Retest → Trendline Break → Continuation → Liquidity/Resistance
The key lesson is that one candle alone does not confirm a trade setup. The strongest educational approach is to study how each candle contributes to the larger story of liquidity, momentum, structure and price reaction. Education 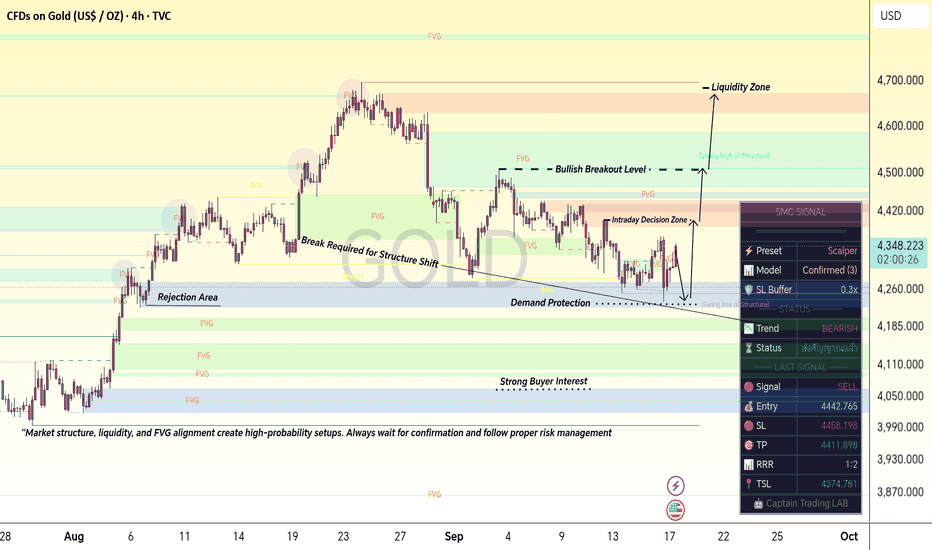
Gold Spot / U.S. Dollar — 45-Minute ChartXAU/USD is showing a recovery from the lower demand area, with price moving back above the recent consolidation zone.
📌 Chart Structure
Entry area: 4,286.143
Stop level: 4,247.667
Target area: 4,466.095
Risk range: about 38.5 points
Potential range: about 180 points
Risk-to-potential ratio: approximately 1:4.7
Price has reacted from the 4,270–4,285 support/demand area and is now approaching the 4,330–4,350 region, where previous price activity was visible.
If price continues to hold above the entry zone and maintains the current upward structure, the next important area to watch is the upper supply zone around 4,470–4,485.
A move back below 4,247 would invalidate the structure shown on the chart and indicate that the lower zone needs to be reassessed.  Short
Short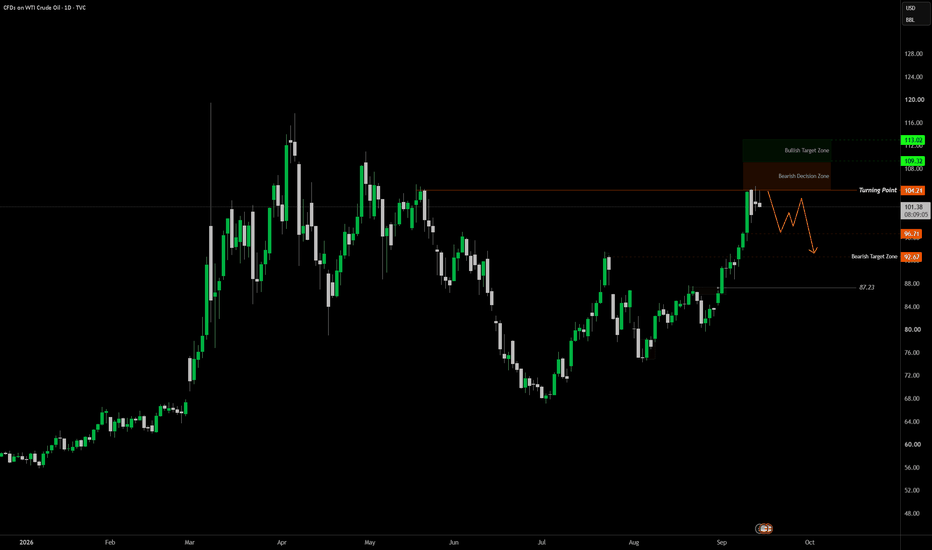
Long 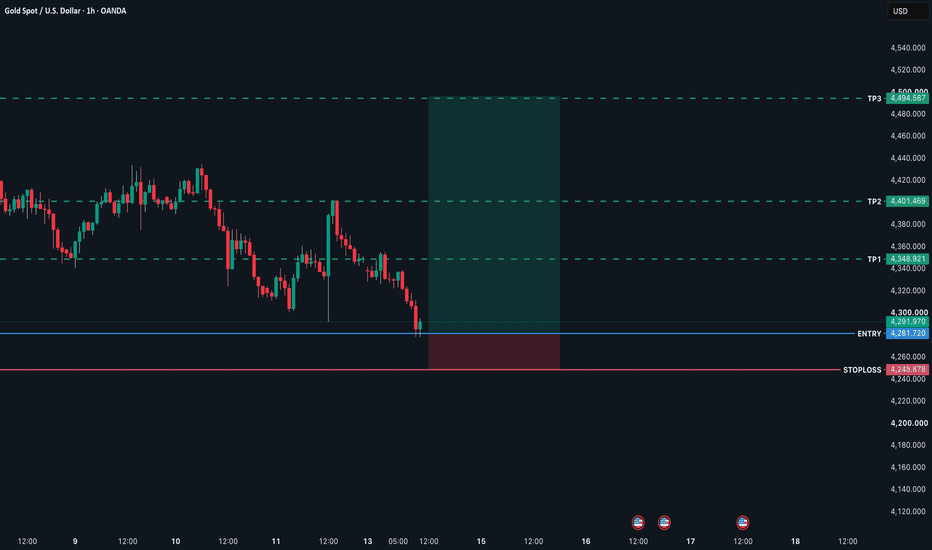
Long 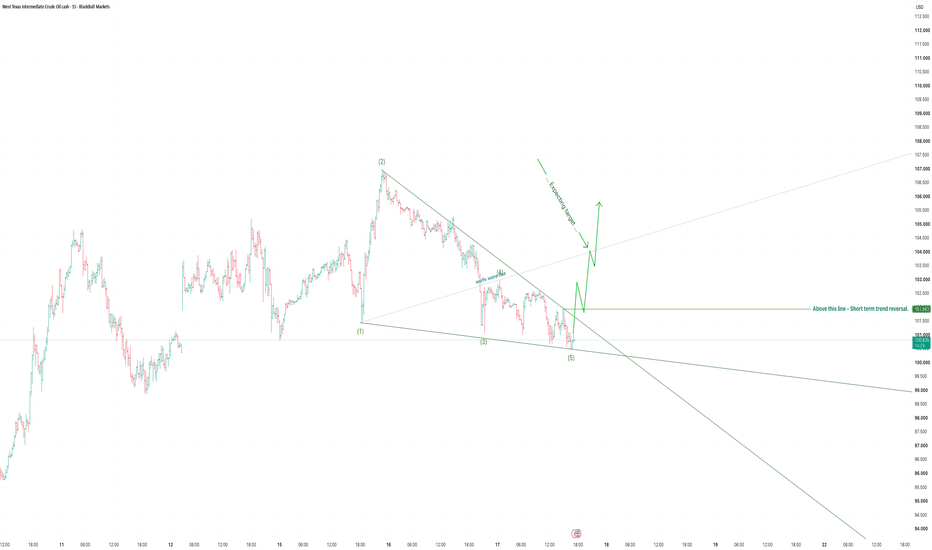
Gold : $4,300 Held — I’m Watching $4,360 NextThis is the latest version of my KCGI trading manual. Well, it seems my previous bearish analysis failed due to the FOMC. Although it's a bit frustrating, it's not a big deal.
Gold dropped to $4,235 after FOMC, but buyers pushed it back above $4,300. Right now, Gold is around $4,328.
So here comes the key point: $4,300 will be my latest focus.I’m bullish above it, but I’m not buying $4,328. Because the next real test is $4,360.
So what follows is my actual trading plan.
I’m wait for a 4H close above $4,360.
If Gold breaks $4,360 and then retests $4,350–$4,360 successfully:
Entry: $4,350–$4,360
TP1: $4,400
TP2: $4,440
Initial stop: $4,295
If I enter and price pulls back, I won't immediately panic.
My planned add-on zone is $4,300–$4,310, but only if this area holds on the 4H chart.
If $4,300 also fails:
No more adding.
Final stop: $4,235.
That's the important difference from my previous trade: I'm defining the maximum loss before adding to the position.
I hope this time it will be successful. The risk-reward ratio of the last trade was so good that I couldn't resist, even though it caused me to lose a lot of money on the xau800x leveraged CFD on Bitget.
But I won't make the same mistake again this time. $4,360 will be my bullish confirmation line; I will wait and not chase until it is broken. Long 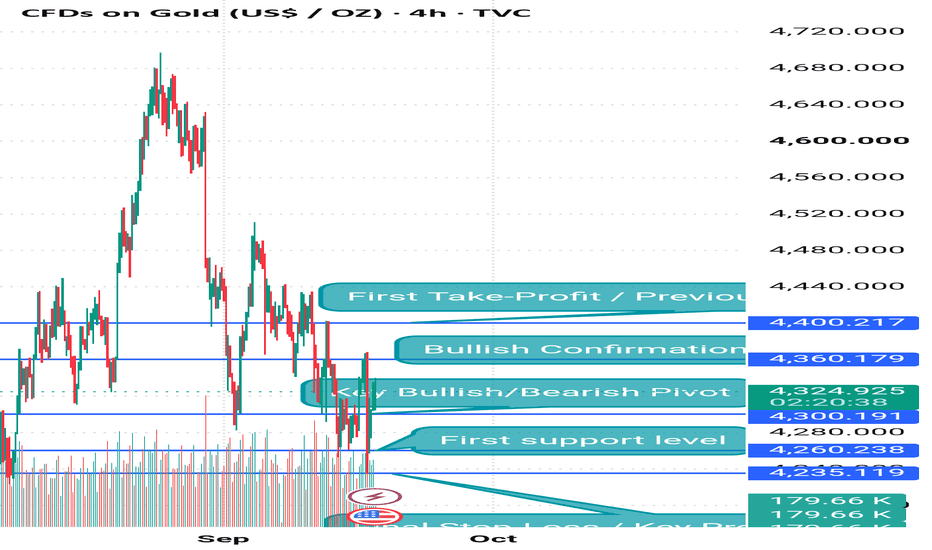
Short 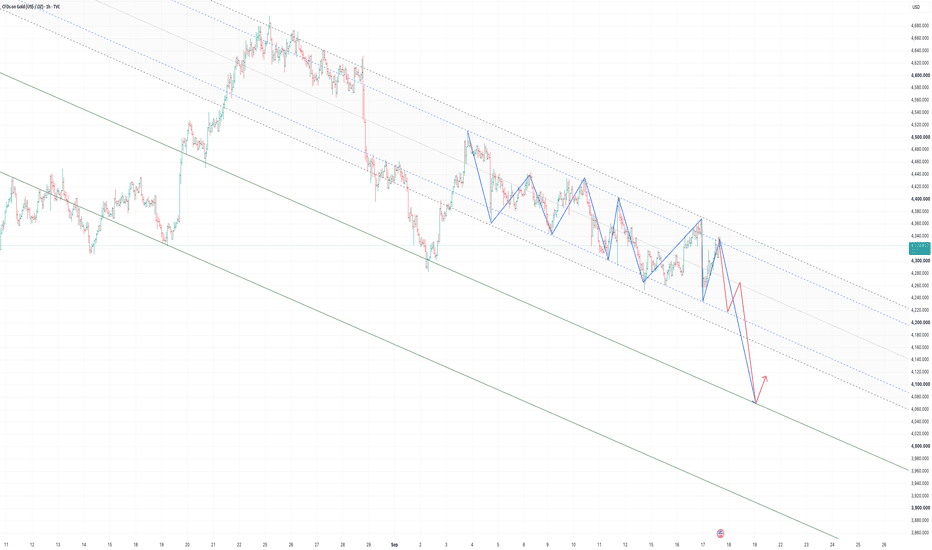
Short