• Products
  • Community
  • Markets
  • Brokers
  • More
Get started
  • Markets
  • /South Africa
  • /Stocks
  • /Ideas
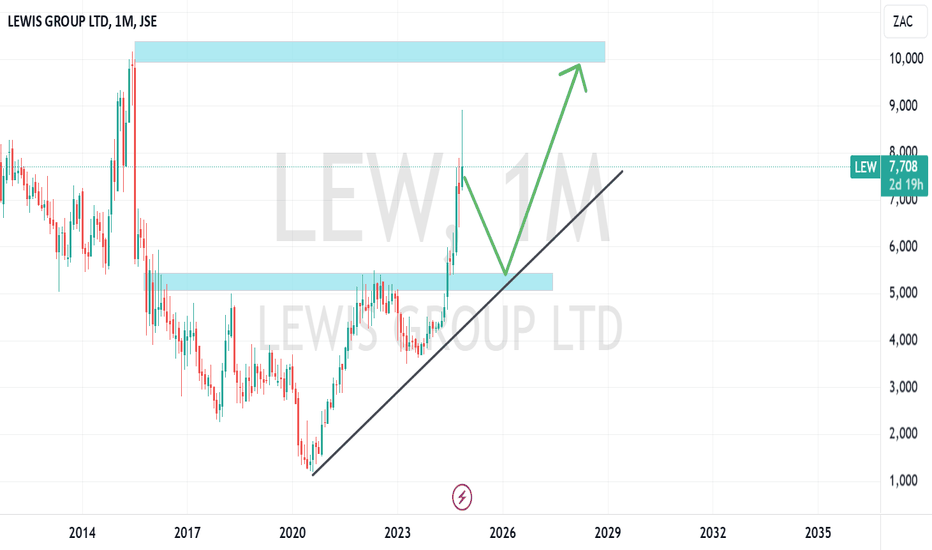
Pullback and retest of major support watch patiently for pullback and retest at major support.
JSE:LEWLong
by Zanokuhle_Capital
Updated
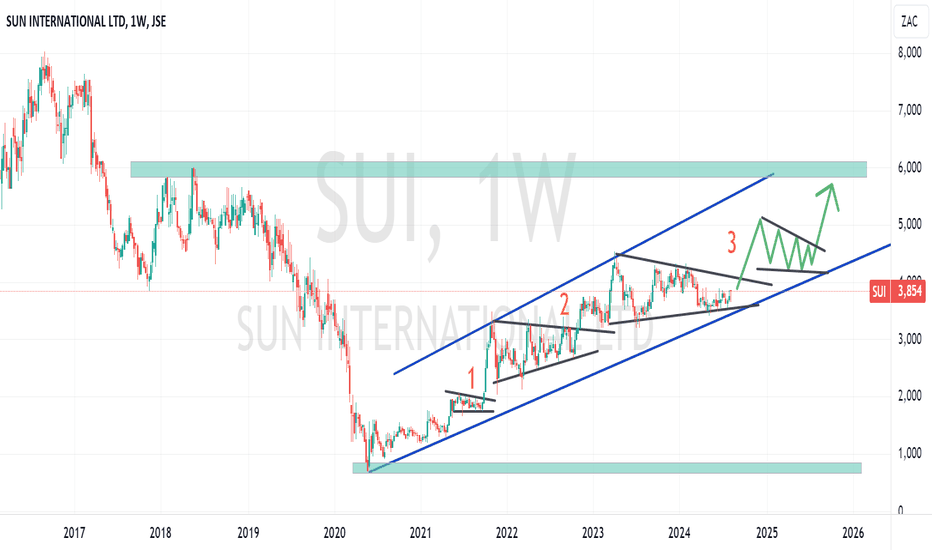
Huge breakout expectedForth wave of the bullish trend expected. buy at current price.
JSE:SUILong
by Zanokuhle_Capital
Updated
Optasia (Channel VAS Investments): AI Fintech, Profitable, The chart is difficult to ignore. Price has been trending lower for months and there is no denying that. The market is clearly demanding more evidence before assigning a higher valuation to the business. At the same time, momentum indicators are beginning to show something worth watching. RSI remains relatively weak and reflects the broader downtrend, but it has stabilized instead of making new lows. Stochastic RSI has rolled over from higher levels and is currently cooling off rather than signaling immediate upside. In other words, the chart is not screaming "buy" today. What it is saying is: "show me more." For me, this is not yet a completed setup. A stronger setup would require: RSI establishing a clear uptrend instead of moving sideways. Stochastic RSI turning higher again after resetting from elevated levels. Price starting to build higher lows rather than continuing the sequence of lower highs. A decisive break of the current downtrend structure. If those pieces begin to align, the technical picture could become much more interesting. What makes me keep watching despite the weak chart is the business itself. Unlike many AI stories that are still burning cash while selling future promises, Optasia is already operating at scale and generating real profits. The company has built an AI-driven fintech platform focused on financial inclusion across emerging markets. Rather than targeting wealthy customers with premium financial products, Optasia serves millions of underbanked consumers who often have limited access to traditional banking services. Its platform analyzes thousands of behavioral data points in real time and uses artificial intelligence to make lending decisions within seconds. The system is integrated directly into telecom operators, mobile wallets and financial institutions, allowing customers to access credit almost instantly through services they already use every day. What I find particularly interesting is that this is not just another AI company adding "artificial intelligence" to investor presentations. AI is the core of the business model. The technology determines risk, pricing, eligibility, fraud detection and customer acquisition. Without the AI infrastructure, the business would not function at its current scale. The company has also demonstrated that its model can scale internationally. It operates across dozens of countries, works with major telecommunications providers and financial institutions, and continues expanding into new markets. Its customer reach is already measured in the hundreds of millions of potential users. The long-term opportunity is substantial. A large percentage of adults across Africa and many emerging markets remain underserved by traditional banking systems. That creates a massive addressable market for AI-based credit scoring and digital financial services. Optasia is attempting to position itself directly in the middle of that trend. Of course, risks remain. Regulation, competition, credit quality, country exposure and execution all matter. The company must prove that it can continue expanding while maintaining credit discipline and protecting margins. That is why I am not looking at this chart and calling a bottom. I am looking at a company with a very interesting business model, real profitability, genuine AI integration and significant growth ambitions, while the market continues to keep the stock under pressure. For now, the fundamentals look stronger than the chart. The next step is for the chart to start agreeing with the business.
JSE:OPA
by JAROSLAWWANCZEWSKI
66
PBT Holdings: A Double-Digit Dividend Yield Hidden Inside a TechLooking at the chart, I do not see a breakout. I do not see strong momentum in the share price. What I see is something much more interesting. The stock has spent a long time moving sideways while investor interest remains extremely limited. Price has barely moved, yet momentum indicators have gradually improved. RSI has recovered from depressed levels and Stochastic RSI has strengthened considerably, suggesting that selling pressure may be fading even though the market has not yet rewarded the stock. That does not guarantee higher prices. It simply means that momentum is improving before the price has started to reflect it. PBT Holdings is a South African technology company focused on data analytics, data engineering, software development, insurance technology and digital transformation. What separates PBT from many smaller technology companies is that it is built around real enterprise demand rather than speculative future expectations. The company works with organizations across financial services, insurance, healthcare, telecommunications and retail. These industries continue investing in technology regardless of whether AI is the market's favorite topic this quarter. What makes the story even more attractive is the dividend.Almost 10%!! In most technology companies investors are asked to wait for potential future returns. PBT is different. Shareholders are already being rewarded today. The dividend is not a side note or a small bonus attached to the investment case. It is one of the central pillars of the story. The chart still requires patience. The business does not. Sometimes the most interesting opportunities are the companies nobody is talking about while they continue doing the right things behind the scenes.
JSE:PBT
by JAROSLAWWANCZEWSKI
Anticipating Trend Exhaustion & Long ReversalStrategic Entry: The "Deep Dive" Target: You’re eyeing an entry under 4,702. This represents a final flush out below the Wave 5 floor shown on the chart, likely hunting for liquidity before a trend shift. Reversal Confirmation: While the entry is aggressive (bottom-fishing), the long-term trend reversal isn't technically "locked in" until we see the first Lower High (LH) signal at 6,003. A break and hold above that level would mark the structural shift from a bearish to a bullish regime. The Fundamental Timing Earnings Catalyst: Since Woolworths' financial year ends on June 30, we are currently in the final quarter of their 2026 fiscal year. Full-year results are typically released in early September. The Opportunity Window: Buying under 4,702 in the coming weeks/months positions you ahead of the year-end reporting cycle. Fundamental Catalyst Institutional Stability : The Public Investment Corporation (PIC) maintains a major stake in WHL. This institutional floor provides a level of long-term stability that retail-heavy stocks often lack. The "Private School" Pivot : Woolworths has successfully captured a high-margin niche by integrating into the private school ecosystem (tuckshops and uniforms). By providing a premium, convenient service where competitors like Spar or Pick n Pay have struggled to gain a foothold, they’ve secured a consistent, "recession-proof" revenue stream from a high-LSM demographic. Operational Resilience : While the broader retail sector faces headwinds, WHL’s ability to maintain brand equity and pivot into specialized convenience service models sets the stage for a strong recovery as macro conditions stabilize.
JSE:WHL
by KhoraCapital
Updated
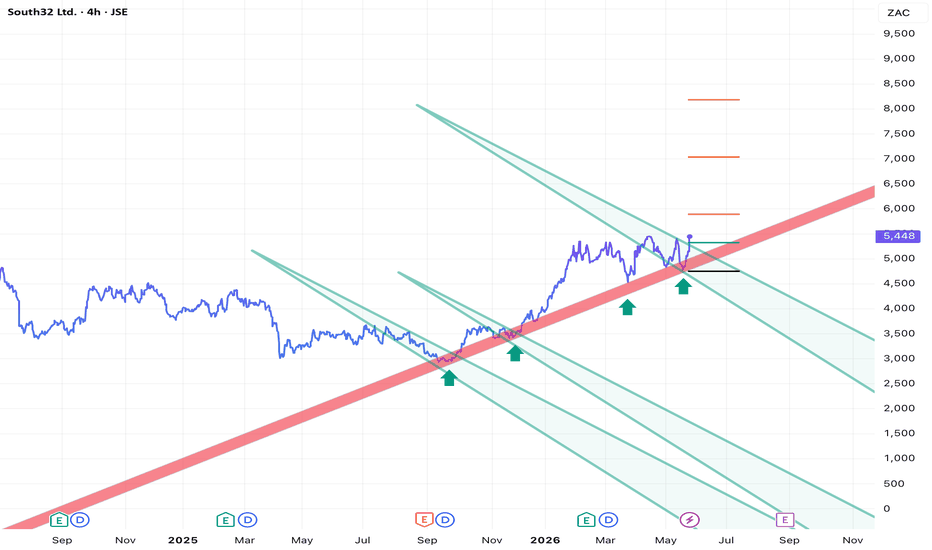
South32 (S32) Acceptance Confirms Above Green VTAcceptance confirmed above the green Value Triangle (VT). Structure remains valid above the red Boundary Line (BL), with repeated VT behaviour supporting the migration higher. Orange T1 levels remain active above current price action. Exit on close below the red BL. Sector context: Mining and materials remain mixed but supportive, with continued focus on copper, aluminium and energy-transition metals across the global diversified miners space. Ticker-specific news: Recent focus remains on South32’s portfolio optimisation and operational recovery momentum across manganese and alumina assets; no major new company-specific catalyst emerged this week.
JSE:S32Long
by VMS-Phil
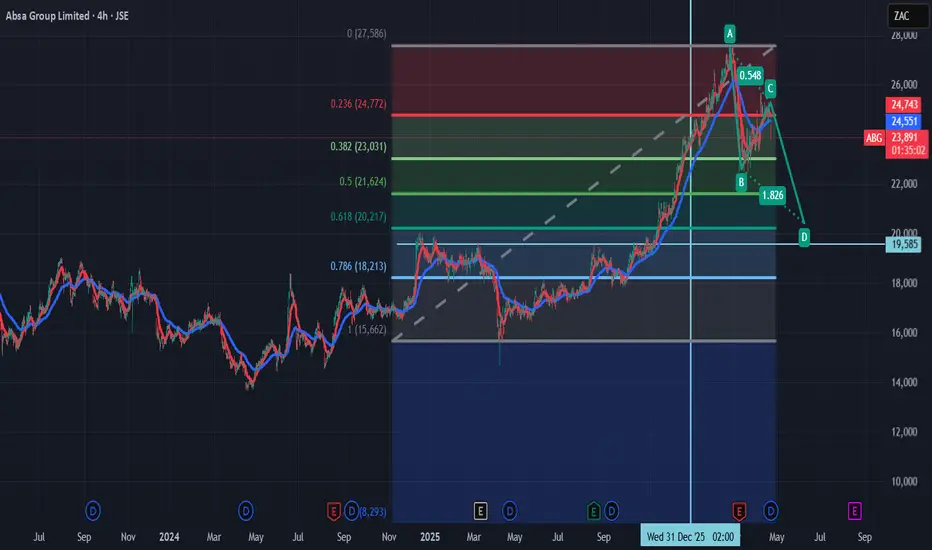
Absa Group (ABG): Exhaustion & Retracement AnalysisThe stock is currently showing signs of exhaustion after a sustained run, moving into a corrective AB=CD structure. Technically, this bearish harmonic pattern suggests a natural "cooling off" period is overdue. We are looking for price to gravitate toward the 50% to 61.8% Fibonacci retracement zone, which represents a critical area for seasonal loading and trend re-evaluation. Fundamentally, this retracement is being driven by a "triple threat" of local and global factors. The recent oil tanker fires have sent energy prices soaring, pushing domestic inflation high. This has forced the SARB to pivot from a cutting cycle to potentially anticipating rate hikes, which historically triggers a rise in banking sector defaults. Combined with the uncertainty of the upcoming 2026 municipal elections, these headwinds are creating a perfect environment for institutional profit-taking, making the 50–61% zone the primary target for the next impulsive leg.
JSE:ABG
by KhoraCapital
Updated
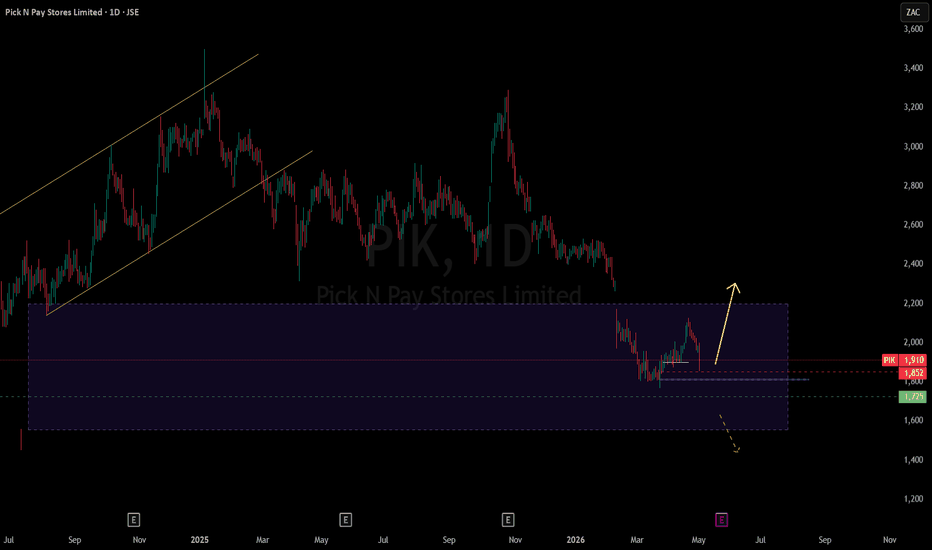
Pick N Pay's Rebellion : Rally Against SELL Ratings? On the 11th of July 2024, JSEPIK opened 33% lower after setting out the terms of a 4 billion-rand rights offer of 252.2 million shares at R15.86 each. Demand then came into play and the share ticked higher, smooching near R35 by January 2025. Price eventually came down to rebalance part of the July 2024 price action and found support around R17.70, leaving a R2.25 (14%) gap before price gained 20% to R21.24 in 1 month. This was a potential signal that there are still some buyers interested in the stock. Price has since come down to retest that short rally to confirm demand. With recent news of labour restructuring (retrenchments), Analysts have taken it as one of the final blows to the business, however here at 'The Chartroom' we remain optimistic and we see an opportunity that may be building up as long as that R14% gap remains open. We expect price to bullishly retest R18.52 to confirm residual buying sentiments with a 3% Stop Loss around R17.95. The last zone to look at is around R17.25 with a 1.5% Stop Loss at R17.00. From the Unaudited Group Condensed Interim Financial Statements for the 26 weeks ended 31 August 2025, a significant reduction in Net Loss was reported amongst other factors. We shall see if the business has a chance to get its ducks in a row over the near short term. Below R16.40 the share price may sink even further, erasing any buy sentiments that may have been lingering.
JSE:PIKLong
by The_Chartroom
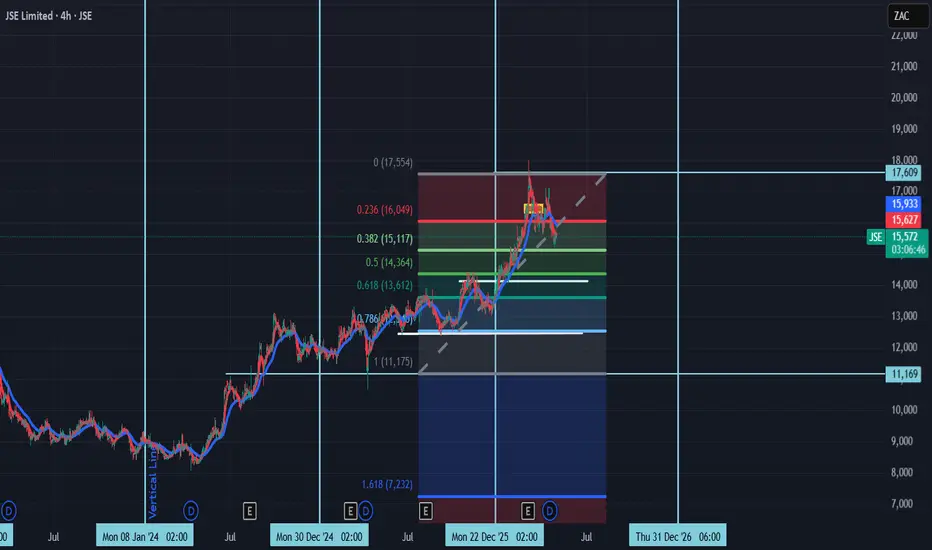
The Correction1. Technical Outlook: The 14,191 Pivot on the 4-hour chart, the price is currently hovering around 15,611 after a period of sustained growth. The Correction Target: The white line identified at near Fib zone of (0.50) 14,191 represents a critical structural level—the previous higher high that often acts as a landing zone during a retracement. Downside Risk: If price fails to find support at 14,191, the next significant floor sits near the 12,500 region, which aligns with previous consolidation zones from late 2025. 2. Fundamental Expansion: Balance Sheet Growth Asset vs. Liability Growth: As of December 2025, Total Assets grew by 21.32% to reach 67.54B, while Total Liabilities increased by a slightly higher 22.53% to 62.48B. Net Debt: The net debt position moved from -2.50B in 2024 to -2.99B in 2025. While this indicates a strong cash-to-debt ratio (net cash), the sheer scale of the balance sheet expansion during a high-interest-rate environment can lead to valuation sensitivity. Industry Headwinds: The broader South African Financials industry has already begun to cool, dropping 1.8% in the final week of April 2026.
JSE:JSE
by KhoraCapital
SBK's actual rally has not yet started - false rally in play!While SBK is up today by close to 2 percent, it is only a bear market rally says Elliott Wave. Standard Bank Group Limited (ticker symbol: SBK) remains wave 4 just like majority of the JSE listed stocks especially those included in the JSE Top 40 Index. However, Elliott also warns that the bottom is nearing!
JSE:SBK
by ElliottWaveSpot
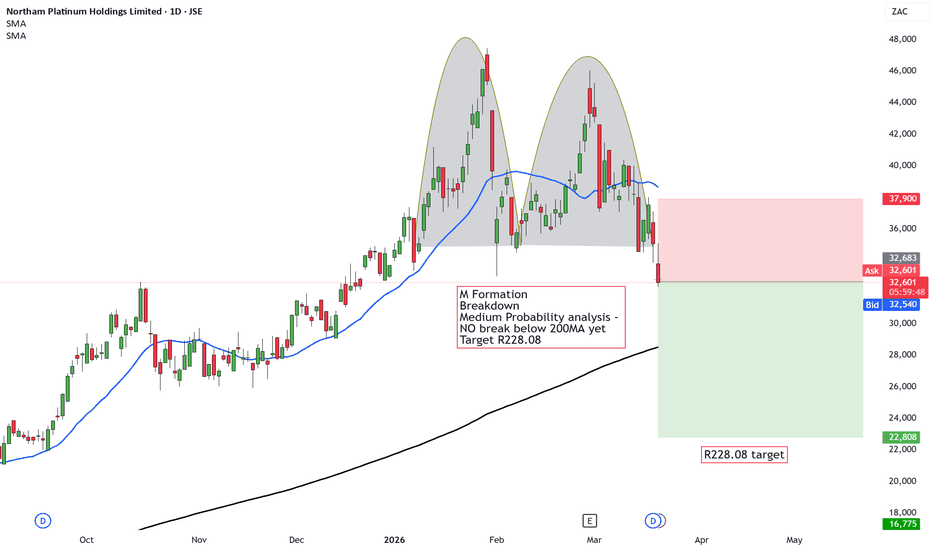
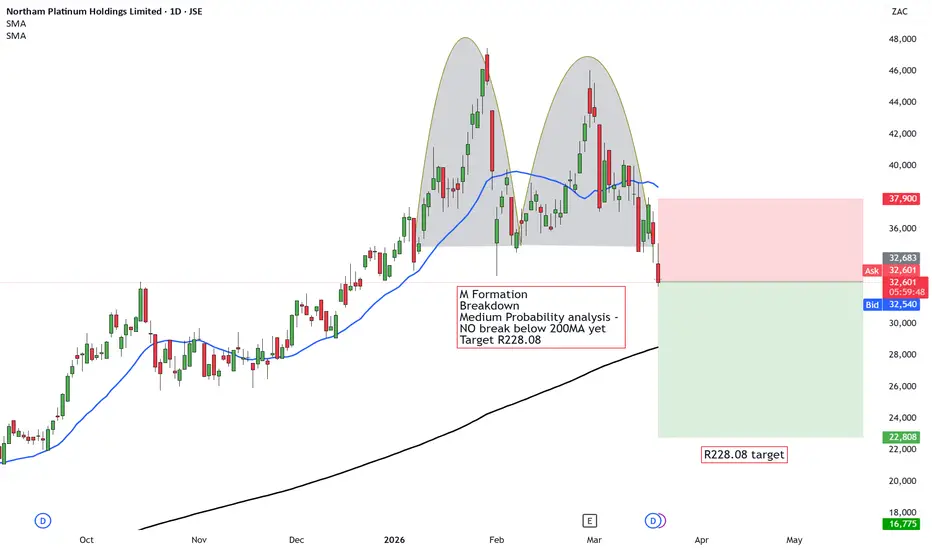
Northam Platinum about to crack down to R228? 📊 Quick Snapshot 🏭 PGM miner focused on platinum, palladium, and rhodium 🇿🇦 Operations based in South Africa 💰 Very sensitive to commodity cycles 🔻 Why Downside Is Likely 📉 Demand Is Weakening Global growth is slowing, reducing demand for PGMs 🛢️ War Is Pushing Costs Up Higher oil prices are increasing mining costs and squeezing margins 🌍 Macro Environment Is Soft China and Europe are slowing, which weighs on commodities 📉 Technical Breakdown A double top has formed, showing distribution Price has broken support, and below 20MA It's a Medium Probability trade due to the price NOT breaking below 200MA - YET! 🎯 The next downside target sits around 22,800
JSE:NPHShort
by Timonrosso
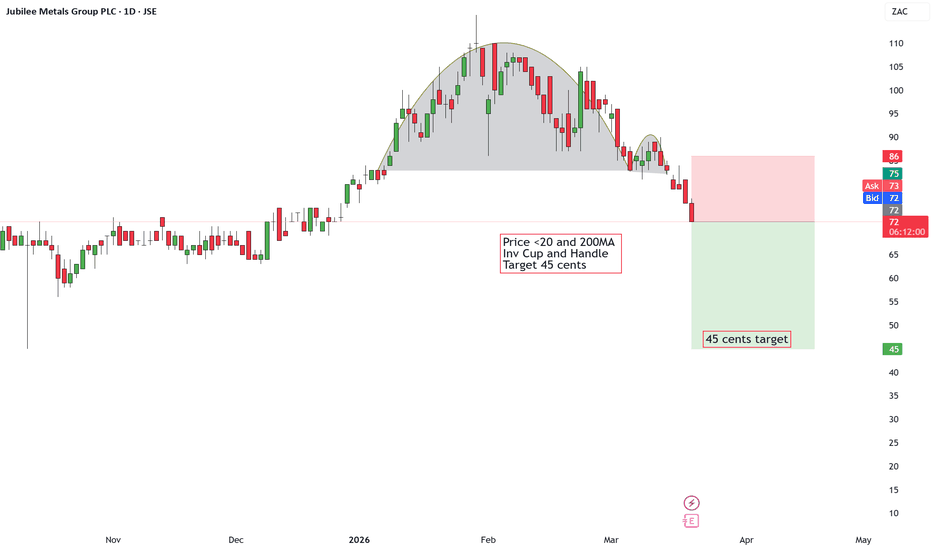
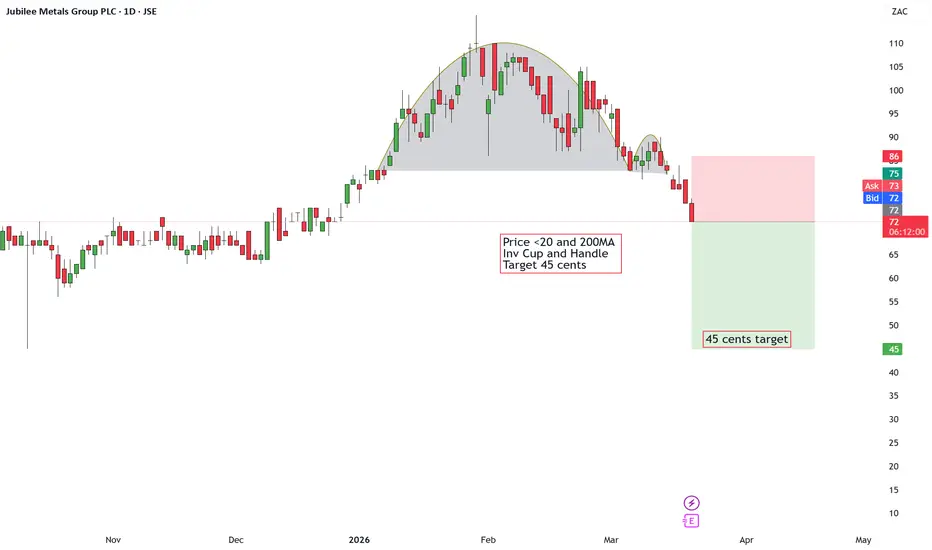
Is this the end of Jubilee Metals - Target to 45 cents? Metals recovery (copper focus) 🔻 Why Downside (Fundamentals) 📉 Weak Earnings - Loss + falling expectations ⚠️ Transition Risk - Selling assets → uncertainty Selling Pressure - Big holders = volatility risk Higher oil from war = higher costs + inflation pressure → bearish for industrial/processing companies like Jubilee. 📉 Technicals Below 20MA and 200 MA = bearish Inverse cup & handle → breakdown 🎯 Target: ~45c
JSE:JBLShort
by Timonrosso
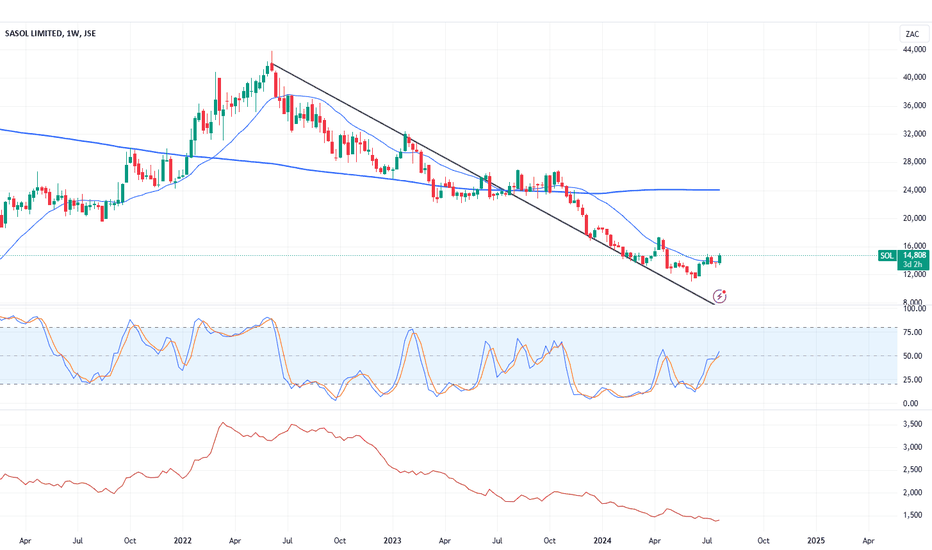
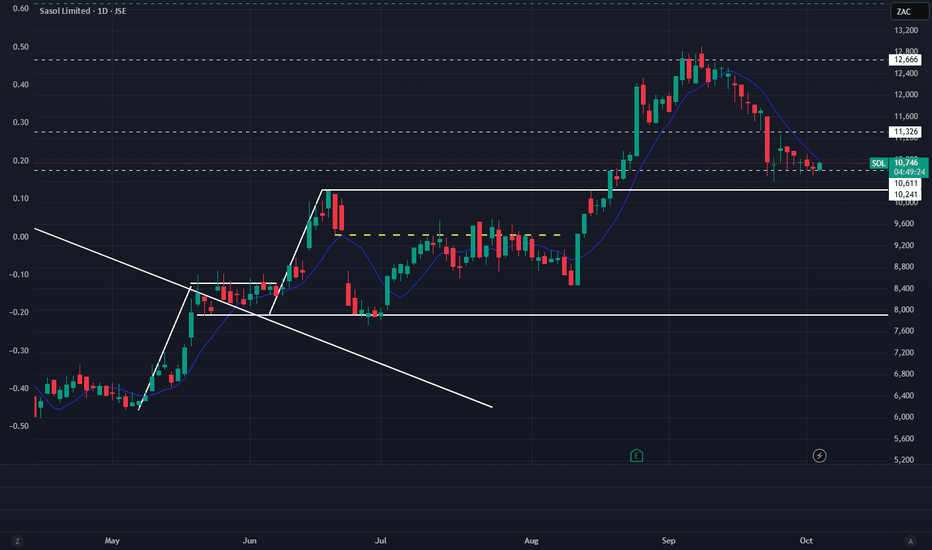
Time to buy some Sasol againIt looks like Sasol is holding support pretty well. Time to buy again we think
JSE:SOLLong
by Herenya
Updated
11
CSB, Cashbuild Ltd | SA home improvement retailer📌 **CSB | Cashbuild Ltd (JSE: CSB)** 🏗️ SA home improvement retailer with regional footprint across SADC. 💹 **Current Price:** ~R140 📈 **52-Week High:** R200 📉 **52-Week Low:** R120 📊 **All-Time High:** ~R504 (chart reference) ✍️ **Latest News:** Q2 FY2026 update reflects operational trends; dividend yield remains ~4.3%. . 📰 Latest News & Drivers: • Cashbuild released a second quarter FY2026 operational update in late Jan 2026. • Dividends remain part of returns — paid semi-annually with ~R6.26 total last year (~4.29% yield). • Recent sentiment has been weighed by economic pressures and consumer demand weakness, impacting margins. . . #JSE #CSB #Cashbuild #SAEquities
JSE:CSB
by Prof_Invests_ZA
Prosus N.V. – diversified global internet & tech invest💹 Current Price: ~R875 (≈ 87 500 ZAc) – delayed price from recent data. 📈 All-Time High: ~125 581 ZAc (≈ R1 255.81) – historical peak. 📉 All-Time Low: ~31 044 ZAc (≈ R310.44) – March 2022 low. 📰 Latest News & Market Drivers: • Prosus and Naspers plan to remove their cross-holding structure – a structural corporate action that could affect valuations. • Recent interim financial results and updates on the share repurchase programme released via SENS reflect ongoing capital return initiatives. • Ongoing buybacks and insider confidence continue to support sentiment amid structural discount concerns.
JSE:PRX
by Prof_Invests_ZA
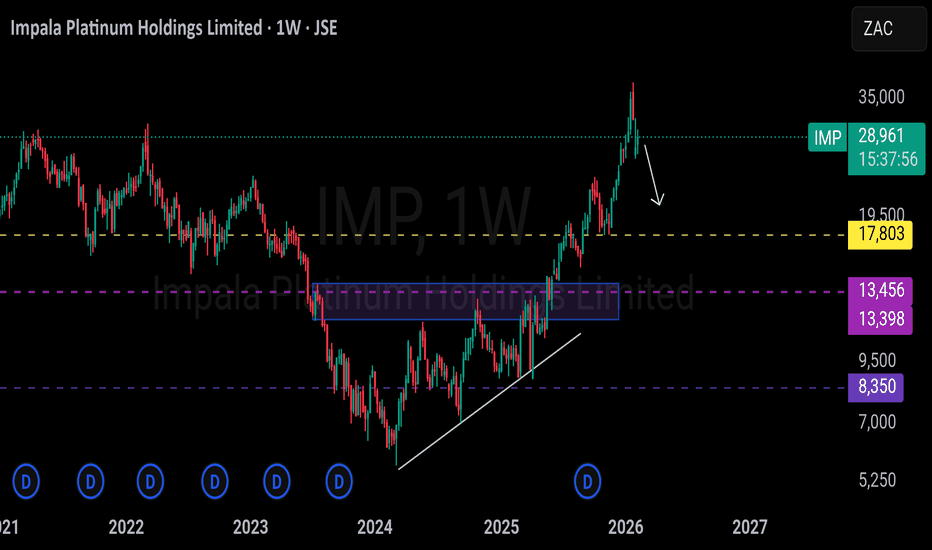
Impalas break from grazing at Platinum Holdings JSE:IMPWhen the Market opened on Monday the 7th of April 2025 Impala Platinum Holdings had buyers taking it off from lows around R87.12, onto a rally that persisted up to a new All-Time-High around R379.48. The instrument went on to print a bearish-piercing candlestick pattern on the Weekly Time Frame over the last week of January 2026, indicating strong profit taking and a signal for the instrument to potentially have a steep pullback. Currently the stock is trading around R289.61 marking a steep 23.7% decline in share price from the ATH. Should this bearishness persist, the stock may trickle down further as profit taking continues. Levels on the downside the instrument may reach are: R178.00 A zone between R133 and R136 A zone between R77 and R83.50 Medium term sentiments are bearish so long price remains below R311.00
JSE:IMPShort
by The_Chartroom
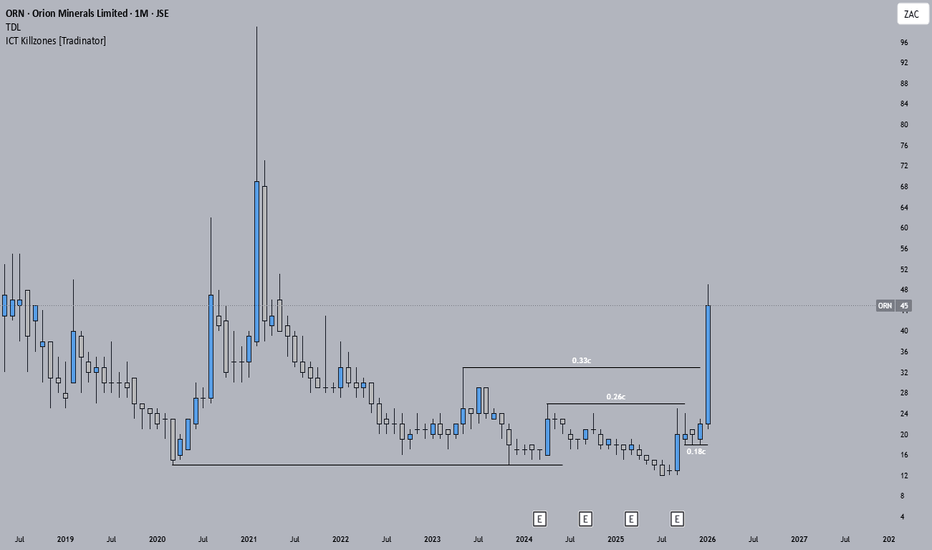
Orion Minerals Limited (ORN) - JSE Orion’s shares have been volatile over recent months after capital raising news and project developments. In late 2025, the stock traded lower compared with earlier highs, with a notable drop (~17.4%) reported around October 2025 following its financial results and ongoing work programs. At that time, shares were trading around the ~19 c level, down from ~22 c a year earlier. Orion is progressing its flagship Prieska Copper-Zinc Mine project, moving toward construction and aiming for first concentrate production by late 2026. The project has signed a framework financing and offtake term sheet with Glencore (US$200–250 million) to support development and future concentrate sales. ummary of the current picture: Orion Minerals is in a development phase, heavily focused on funding and advancing its copper-zinc projects. Share price has moved lower compared with earlier peaks, partly due to capital raises and operating losses, while the company builds toward projected production milestones by late 2026. Insider participation and project financing deals are notable catalysts watched by the market, though broader analyst sentiment remains cautious.
JSE:ORNLong
by Prof_Invests_ZA
4Sight (4SI) - JSEforming what appears to be a Higher Low (HL) on the chart. After the sell-off, the structure suggests that buyers stepped in earlier than the prior low, indicating a possible shift in market dynamics. Since establishing this HL, price has been attempting to move higher, reflecting renewed bullish pressure as the market looks to build on the recent low and challenge resistance areas above. The current action suggests that the downside may have been mitigated for now, and the developing structure could be an early indication of accumulating strength.
JSE:4SI
by Prof_Invests_ZA
SASOL (SOL)- JSEPrice has recently struggled near key resistance levels and is showing signs of slowdown after multiple attempts to push higher, which could signal a short-term pullback to structural support zones. 📌 Summary This idea assumes a temporary pullback first, offering a “buy low” opportunity ahead of a larger upside continuation. The trade plan doesn’t chase short-term strength — it anticipates a measured retracement into strong technical support before committing capital.
JSE:SOL
by Prof_Invests_ZA
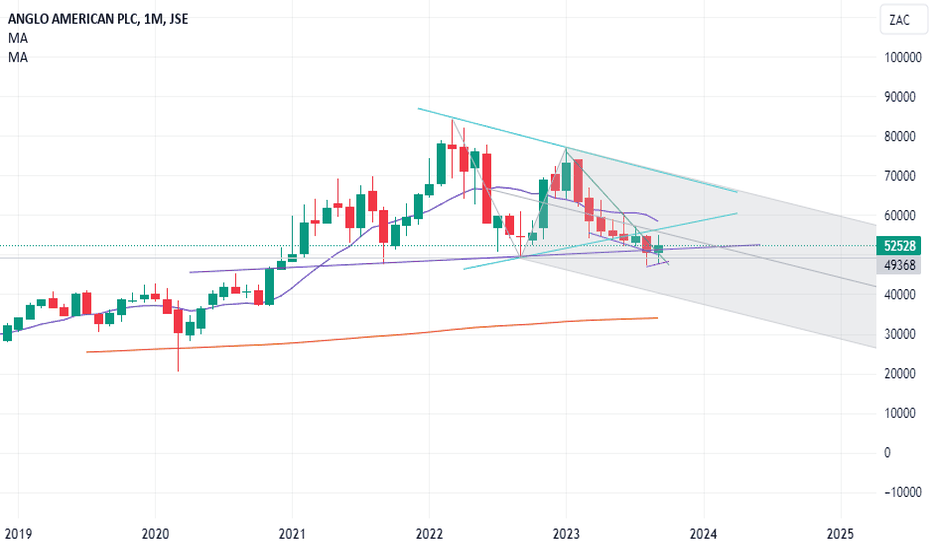
Anglo American Monthly ViewAnglo American is in pursuit of a yearly low, first we look for a swing low, then a close above the 10 period moving average. At a minimum the yearly low will see price breach the upper resistance of the Pitchfork. In terms of time, we are within a time after a long cycle from the COVID lows.
JSE:AGLLong
by runyamhere
Updated
SASOL to revisit Covid lows of 2020 as Oil prices pullbackFrom our November 2023 analysis, medium-long term sentiments were strongly bearish towards R71. Price did behave as expected and went as far as printing a low around R53.01 in May 2025 before going on to print what seems to be developing into a Head and Shoulders price pattern between September and November 2025. If this Bearish pattern successfully forms and breaks below the zone between R77.00 and R83.00, then price may trickle down to levels between R18.00 and R25.00 as Oil prices seem to also be preparing for a short pullback into the buyers zone. Anticipated levels if the R77.00 ~ R83.00 fails as support: R42.00 R20.77 (2020 Low) R18.16 Should the R77.00 - R83.00 level succeed as support, price may see a rise to: R149.00 R229.00 Current sentiments on SASOL : BEARISH November 2023 analysis available here :
JSE:SOLShort
by The_Chartroom
22
MTN SAMTN is a major Telecoms company providing voice,sms, internet services. THESIS - Clear bullish 5 waves - Waiting for wave 2 @50/61.8fib zone - Catching Wave 3 is our interest Big swing Setup
JSE:MTNLong
by judevigor
MTN SOUTH AFRICA - BULLISH SETUPMTN is a major Telecoms company providing voice,sms, internet services. THESIS - Clear bullish 5 waves - Waiting for wave 2 @50/61.8fib zone - Catching Wave 3 is our interest Big swing Setup
JSE:MTNLong
by judevigor
11
112233445566778899101011111212131314141515161617171818191920202121222223232424252526262727282829293030313132323333343435353636373738383939404041414242
…999999

Made by humans

Select market data provided by ICE Data Services. Select reference data provided by FactSet. Copyright © 2026 FactSet Research Systems Inc.Copyright © 2026, American Bankers Association. CUSIP Database provided by FactSet Research Systems Inc. All rights reserved. SEC filings and other documents provided by Quartr.© 2026 TradingView, Inc.

More than a product
  • Supercharts
Screeners
  • Stocks
  • ETFs
  • Bonds
  • Crypto coins
  • CEX pairs
  • DEX pairs
  • Pine
Heatmaps
  • Stocks
  • ETFs
  • Crypto coins
Calendars
  • Economic
  • Earnings
  • Dividends
  • IPOs
More products
  • News Flow
  • Portfolios
  • Fundamental Graphs
  • Yield Curves
  • Options
  • Macro Maps
  • Pine Script®
Apps
  • Mobile
  • Desktop
Community
  • Social network
  • Wall of Love
  • Refer a friend
  • House Rules
  • Moderators
Ideas
  • Trading
  • Education
  • Editors' picks
Pine Script
  • Indicators & strategies
  • Wizards
  • Freelancers
  • Paid Spaces
Tools & subscriptions
  • Features
  • Pricing
  • Market data
  • Gift plans
Trading
  • Overview
  • Brokers
  • Brokers comparison
  • The Leap
Special offers
  • CME Group futures
  • Eurex futures
  • US stocks bundle
About company
  • Who we are
  • Space mission
  • Blog
  • Help Center
  • Careers
  • Media kit
Merch
  • TradingView store
  • Tarot cards for traders
  • The C63 TradeTime
Policies & security
  • Terms of Use
  • Disclaimer
  • Privacy Policy
  • Cookies Policy
  • Accessibility Statement
  • Security tips
  • Bug Bounty program
  • Status page
Business solutions
  • Widgets
  • Charting libraries
  • Lightweight Charts™
  • Advanced Charts
  • Trading Platform
Growth opportunities
  • Advertising
  • Brokerage integration
  • Partner program
  • Education program
Community
  • Social network
  • Wall of Love
  • Refer a friend
  • House Rules
  • Moderators
Ideas
  • Trading
  • Education
  • Editors' picks
Pine Script
  • Indicators & strategies
  • Wizards
  • Freelancers
  • Paid Spaces
Business solutions
  • Widgets
  • Charting libraries
  • Lightweight Charts™
  • Advanced Charts
  • Trading Platform
Growth opportunities
  • Advertising
  • Brokerage integration
  • Partner program
  • Education program
Look FirstLook First