ICICIBANK Massive Weekly Breakout with Volume ConfirmationLooking at the weekly timeframe for ICICI Bank, the stock has just delivered a textbook breakout above a major long-term resistance zone.
Chart Analysis:
For several months, the stock faced heavy supply near the 1,470 level. Last week, it shattered this resistance with a massive, full-bodied bullis
Where the world does markets
Join 100 million traders and investors taking the future into their own hands.
Get started for free$0 forever, no credit card needed

Supercharged
Supercharts

NIFTY 50 – Bearish Setup Near Resistance | 15-Min ChartNIFTY is approaching a key resistance zone around 25,020–25,060, where selling pressure was previously observed.
After a sharp decline, the price has recovered towards this zone but is showing signs of rejection. I am watching for a possible continuation of the bearish move if sellers regain contro
IRM Energy: How I Use Fibonacci to Study a DowntrendApoorv Dubey | SEBI Registered Research Analyst
Fibonacci retracement can help us study a falling market too. Instead of measuring a pullback after a rally, we can use it to map a recovery after a decline.
Here’s how I’m using IRM Energy’s monthly chart as an educational example.
1. Start with t
ADANI GREEN ENERGY - BULLISH SetupAdani Green appears to be developing a larger bullish impulse structure. The larger Wave 1 (yellow) and Wave 2 (yellow) are marked on the chart.
From the 2026 low, a fresh impulsive structure has developed with Wave I–II–III (white) , and the stock appears to be completed through Wave IV (whi
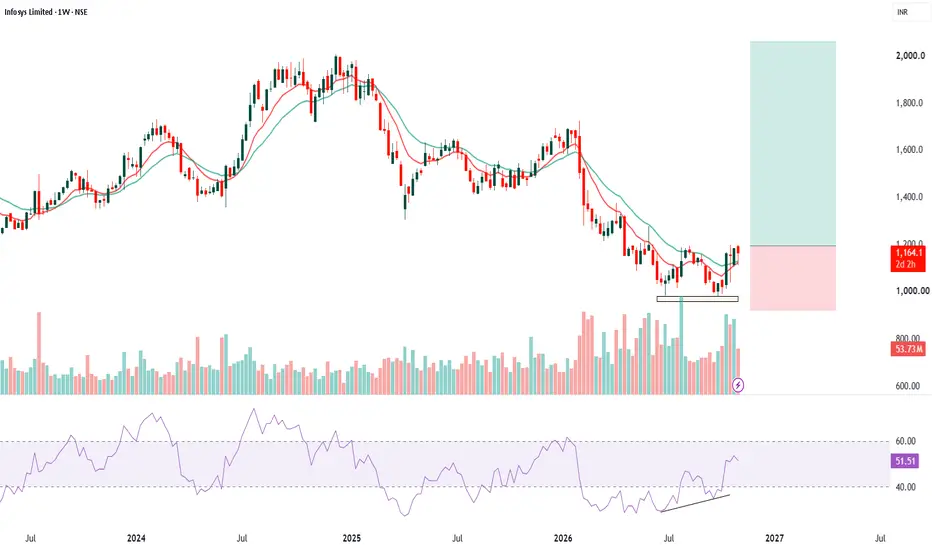
INFY | Fake Demand Area ! Major Potential Supply SideInfosys Ltd. stock is showing sings of a potential trend reversal on the monthly chart. The stock has formed a"M" type structure or "Double Bottom" structure around the 980-990 zone, indicating buying interest at lower levels and the possibility of accumulation. But the price momentum and an early s
Nifty Soars 8.58% in a Week: Can the Diwali Rally Continue?The Indian stock market has given investors a reason to celebrate ahead of Diwali.
After a prolonged period of weakness, the Nifty 50 has staged a powerful comeback, gaining an impressive 8.58% in a single week and closing at 25,030.35 on November 6.
Even more encouraging, the index has recorded s
Diwali Pick - Samvat 2083 - PGINVIT📊 Script: PGINVIT
Key highlights: 💡⚡
📈 Powergrid Infrastructure Investment Trust Its An Alternative Investment Option.
📈 Company is owned by Government.
📈 Company gives payout every Quarter which is 4 times a year.
📈 Its gives yearly around 12% return (not fixed)
📈 Example - if you invest 100,000r
Gold (XAUUSD) Weekly Analysis [09 - 13 Nov, 2026]Probable Scenario Analysis of Gold (XAUUSD) FOREXCOM:XAUUSD for the week (09th Nov - 13th Nov, 2026).
⏺ Present Scenario
Gold (XAUUSD) is in a bearish structure. There is no evidence of a confident bullish setup yet. However, there is an equal probability of reversal (bearish to bullish). Con
INFY Double BottomInfosys Ltd. is showing signs of a potential trend reversal on the weekly chart after a prolonged correction. The stock has formed a double-bottom structure around the ₹950–980 zone, indicating buying interest at lower levels and the possibility of accumulation. The recent recovery above the 10 and
Nifty 1D: Breakaway Gap Meets Overextended ResistanceOverview 📊
Following a sharp structural decline, the Nifty 50 (1D chart) has printed a classic bullish trend reversal pattern, punctuated by an aggressive surge in short-term buying momentum. 🚀 While the structural breakout remains highly valid, a confluence of immediate overhead resistance suggest
See all editors' picks ideas
Confluence Profile█ OVERVIEW
Confluence Profile is a tool for finding places where several independent technical factors point to a similar price level. It does not give buy or sell signals. Instead, it shows where Fibonacci levels, Order Blocks, Fair Value Gaps and volume nodes cluster on the chart, and how many of
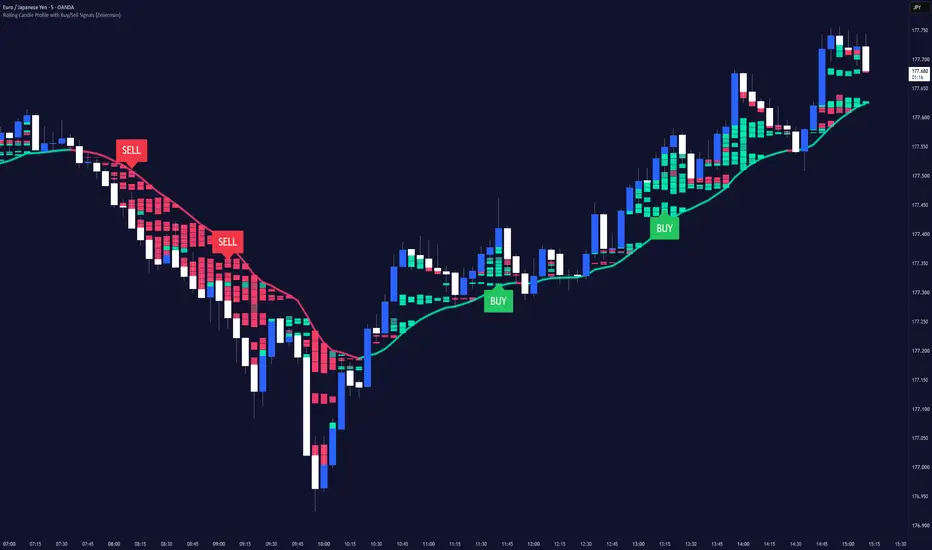
Rolling Candle Profile with Buy/Sell Signals (Zeiierman)█ Overview
Rolling Candle Profile with Buy/Sell Signals (Zeiierman) is a dynamic price-pressure indicator that visualizes buying and selling dominance, directional pressure concentrations, and weak-pressure regions directly on the chart.
The indicator constructs a 12-layer Rolling Pressure Prof
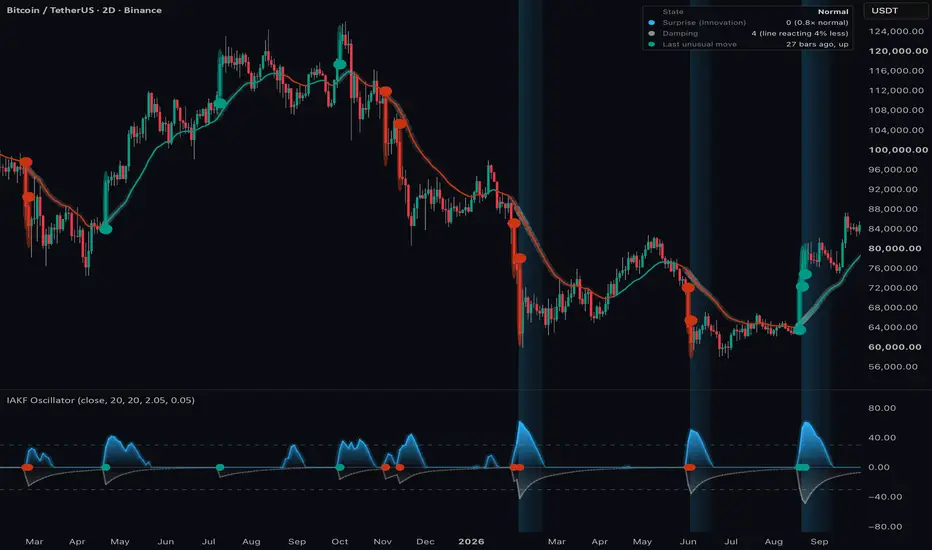
Innovation Adaptive Kalman Filter Oscillator█ OVERVIEW
The Innovation Adaptive Kalman Filter (IAKF) is a modern implementation of the Kalman filter that uses its own prediction errors to detect abnormal measurements and adapt its measurement-noise estimate.
This indicator is an oscillator that adapts recent research in GPS and inertial nav
Market Matrix (Zeiierman)█ Overview
Market Matrix (Zeiierman) is a multi-timeframe market analysis dashboard that brings together price structure, trend, momentum, and market strength into six compact indicator panels.
Instead of switching between multiple indicators and timeframes, Market Matrix displays higher-timefr
RedK Indicator Amplifier (RedK i-Amp)🟩 What is RedK i-Amp?
-------------------------------
RedK i-Amp is not an indicator in itself - it's a "wrapper" utility that "amplifies" another "source" indicator by improving its visual and alerting capabilities.
RedK i-Amp hooks to another indicator's plot and enables the addition of the fol
TASC 2026.10 A Low-Risk ETF-Trading Strategy█ OVERVIEW
This script implements concepts from a short-term ETF investment strategy outlined by Markos Katsanos in the article "Selecting Strong ETFs While Avoiding Sharp Overbought Reversals" from the October 2026 edition of TASC Traders' Tips . The strategy analyzes Katsanos' custom relative s
Buyers & Sellers Profile + Dynamic S/R (Zeiierman)█ Overview
Buyers & Sellers Profile + Dynamic S/R (Zeiierman) is a volume-profile and market-structure indicator designed to combine a large rolling Buyers/Sellers Volume Profile with dynamically generated support and resistance levels.
Instead of treating the volume profile and swing structure
Vol-Control Fund PositioningThe investors who sell because nothing happened
In 2017 the American stock market was so calm that a whole class of institutional portfolios held more equities than their own capital, simply because the rules they follow told them to. Reconstructed with the model behind this indicator, their estim
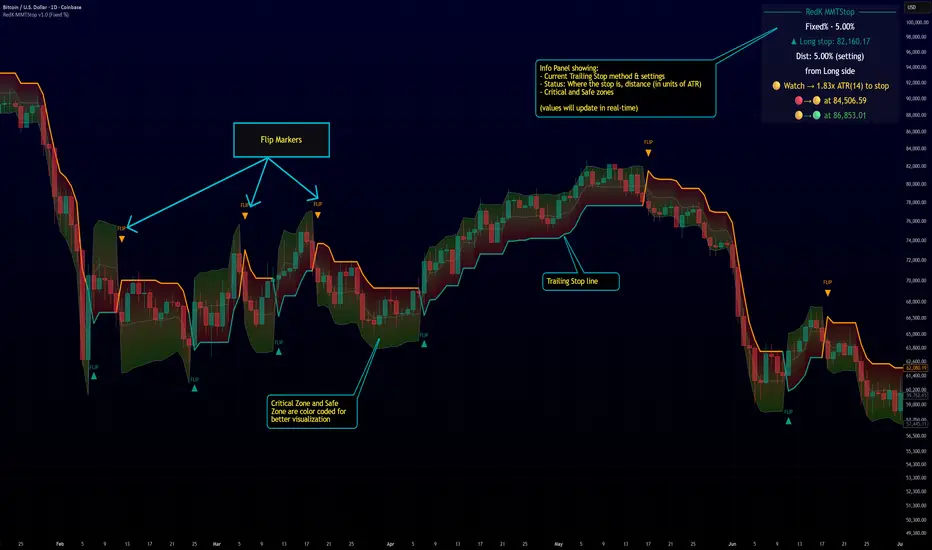
RedK Multi-Modal TrailingStop (RedK MMTStop)█ RedK MMTStop - Release Notes
Introduction & background
RedK MMTStop is a Multi-Modal Trailing Stop indicator - Let's quickly explore the "trailing stop" concept first as a refresher - then explain what a multi-modal trailing stop indicator does.
A "Trailing Stop" is what helps traders avoi
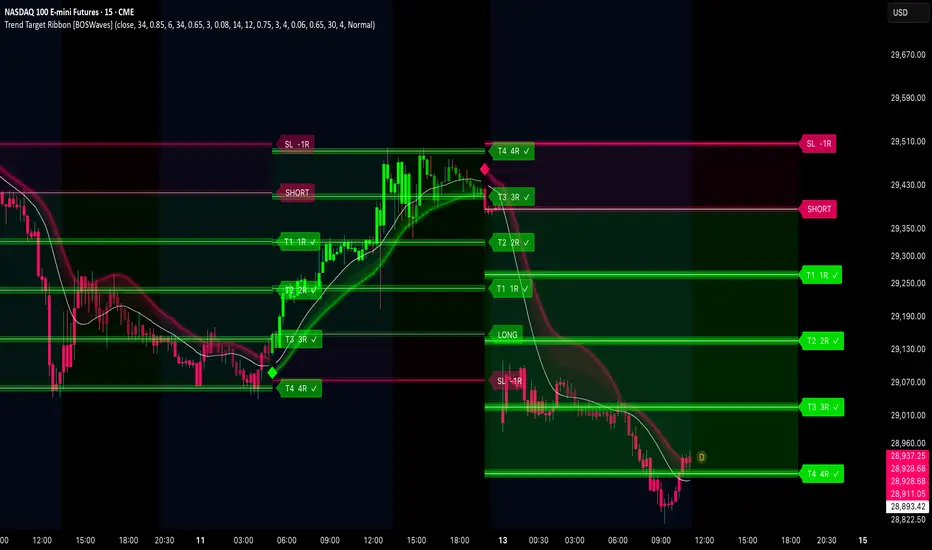
Trend Target Ribbon [BOSWaves]Trend Target Ribbon - ALMA Conviction Trend Detection with Integrated Structure-Based Position Planning and R-Multiple Target Tracking
Overview
Trend Target Ribbon is an ALMA-based trend identification system that combines slope-normalized momentum confirmation with standard deviation band
See all indicators and strategies
Community trends
INFY | Fake Demand Area ! Major Potential Supply SideInfosys Ltd. stock is showing sings of a potential trend reversal on the monthly chart. The stock has formed a"M" type structure or "Double Bottom" structure around the 980-990 zone, indicating buying interest at lower levels and the possibility of accumulation. But the price momentum and an early s
IRM Energy: How I Use Fibonacci to Study a DowntrendApoorv Dubey | SEBI Registered Research Analyst
Fibonacci retracement can help us study a falling market too. Instead of measuring a pullback after a rally, we can use it to map a recovery after a decline.
Here’s how I’m using IRM Energy’s monthly chart as an educational example.
1. Start with t
ADANI GREEN ENERGY - BULLISH SetupAdani Green appears to be developing a larger bullish impulse structure. The larger Wave 1 (yellow) and Wave 2 (yellow) are marked on the chart.
From the 2026 low, a fresh impulsive structure has developed with Wave I–II–III (white) , and the stock appears to be completed through Wave IV (whi
ICICIBANK Massive Weekly Breakout with Volume ConfirmationLooking at the weekly timeframe for ICICI Bank, the stock has just delivered a textbook breakout above a major long-term resistance zone.
Chart Analysis:
For several months, the stock faced heavy supply near the 1,470 level. Last week, it shattered this resistance with a massive, full-bodied bullis
MCX: Cup and Handle Breakout – Is a New Uptrend Starting?MCX is showing a strong chart structure on the daily timeframe. After a good rally, the stock went through a long consolidation and formed a Cup and Handle pattern. During this period, trading volume gradually reduced, showing a contraction in activity.
Now the stock has moved above its previous Al
GRSE GARDEN REACH SHIPBUILDERS & ENGINEERS LTDGRSE Repeating the same pattern also filled the gap only volume is lacking once the smart money enters with Huge volume good up side can be seen, for the tgts 3337 & 3514 this is my personal view please also do your own research and fundamental Analysis before investing....
ALEMBIC PHARMACEUTICALS–Strong Weekly Breakout from Golden Zone📈 ALEMBIC PHARMACEUTICALS – Strong Weekly Breakout! Is a New Bullish Trend Beginning?
━━━━━━━━━━━━━━━━━━━━
🏢 COMPANY & BUSINESS THEME
━━━━━━━━━━━━━━━━━━━━
Alembic Pharmaceuticals is an Indian pharmaceutical company engaged in manufacturing and marketing branded formulations, generic medicines and
AARTIDRUGS after 5 years Breakout or Breakdown?AARTIDRUGS is showing signs of a potential trend reversal on the weekly chart after a prolonged correction but there could be a little more downside.
In the last 5 years the stock has traded between 323 to 567. The current stage looks very decisive; the stock could go further downward or it could re
Muhurat Pick - Samvat 2083 - Diwali Pick - Long Term📊 Script: ZENSAR TECH
📊 Sector: IT SECTOR
⏱️ C.M.P 📑💰- 568
🟢 Target 🎯🏆 - 750
📊 Script: NEWGEN
📊 Sector: IT SECTOR
⏱️ C.M.P 📑💰- 440
🟢 Target 🎯🏆 - 600
📊 Script: TMPV
📊 Sector: AUTO SECTOR
⏱️ C.M.P 📑💰- 292
🟢 Target 🎯🏆 - 400
📊 Script: TIINDIA
📊 Sector: AUTO SECTOR
⏱️ C.M.P 📑💰- 2170
🟢
See all stocks ideas
Community trends
BTC: RELIEF RALLY OR ANOTHER LEG DOWN?BTC | Short-Term Trading Plan
BTC is currently trading within a key range. Keep your eyes on this box. A breakdown could trigger a sharp sell-off and amplify market fear.
Breakout upward: Watch for a retest of premium zones to look for short opportunities.
Breakdown: Wait for a pullback before lo
BTCUSD Long run after $1 billion in leveraged positions were liCrypto traders who bet on higher prices just had a very expensive couple of days.
More than $1 billion in leveraged positions were liquidated as Bitcoin, Ethereum, XRP, and Solana all fell below key price levels. A widely shared market post put the wipeout at $1 billion in just 10 minutes. Broader
Bitcoin (BTC) Weekly: The 72K - 75.5K Multi-Year PivotTimeframe: Weekly (1W)
Asset: Bitcoin Perpetual / USDT (BTCUSDT)
Market Structure Overview:
On the macro weekly chart, Bitcoin is currently testing the critical 72,000 - 75,500 horizontal purple band. This zone represents the original breakout origin that anchored the 2024 All-Time High expansion,
BTCUSD Market Structure AnalysisBitcoin is currently showing bearish market structure following a strong rejection from the 81,000 resistance region. Price experienced a sharp downward move, breaking below the previous support area and confirming a shift in market momentum toward the sellers.
The upper supply zone between 78,400
Bitcoin Market Analysis and Short Term Bearish OutlookBitcoin is currently trading around 75,762 after experiencing a significant bearish correction from the 80,500 resistance region. The chart shows a strong shift in market structure, with sellers maintaining control following the sharp downside move.
Price is currently consolidating in a narrow rang
BTCUSD 30min Timeframe Analyses ! Bearish Side DirectionLet's flow the bearish trend market. This zone also important after 'L Swap'. Need a "M" type structure. Then Second top also need a Bearish Engulfing 2cp Candlestick Pattern. Then Go with the bearish trend.
Important Area :
1) 30min timeframe 75,045 - 74,904
2) Need a 'M' type structure or 'Doubl
Trading Journals: Check Execution Against Your PlanA trading journal records how a decision was made, how it was carried out and what followed. Its value comes from comparing the original plan with actual behaviour across a series of trades.
1. Record the reason using information available at the time.
For this weekend review, use the BTCINR four-
See all crypto ideas
Bullish Continuation From Mitigation POIMarket Context
Gold is holding near $4,120 after extending its recovery, supported by a softer U.S. dollar and lower oil prices that have eased near-term inflation concerns. However, stronger U.S. payrolls keep December Fed tightening expectations elevated, while October CPI due Tuesday remains a k
H2 Pullback Before Recovery ExpansionGold is trading around 4,099, holding above the latest recovery structure after rebounding sharply from the late-October swing low.
The macro backdrop remains restrictive in the short term. Strong October payrolls strengthened the dollar, lifted Treasury yields and increased expectations for anothe
XAUUSD: Can Gold Break 4,146 and Extend the Rally?
Gold has recovered strongly from its recent lows, but the next bullish move may depend on something more important than momentum: whether buyers can break the 4,146 resistance and defend the structure afterward.
The recovery is gaining attention, yet the broader market still faces an important str
XAUUSD | 1H/4H Analysis & Trading Strategy |November 9Hello, traders! 👋
Hope your trading is going well! 🚀
📊 4-Hour Trend Analysis
Gold has climbed back above the MA5, MA10, and MA20, indicating that the overall bullish structure remains intact. If the price holds above 4109, it could retest 4140–4148, with a breakout potentially pushing gold toward 4
XAUUSD Multi-Timeframe Closing Structure | Camarilla Levels, MA Gold (XAUUSD) Market Structure & Liquidity Framework
In this setup, we track institutional volume and liquidity sweeps around critical extremes rather than relying on delayed retail signals. Validations strictly follow Day Close and Week Close structures to filter out false breakout wicks.
Technic
XAUUSD – Gold's Recovery Paves the Way Toward $4,250Gold is off to a positive start this week, quickly reclaiming the $4,100 level. According to Reuters on November 9, gold has found support from a weaker US dollar and easing oil prices, which have helped calm inflation concerns. Although stronger-than-expected US employment data has kept markets cau
XAUUSD H2: 4,029 Holds - Is 4,200 the Next Trap?
Weekly Market Recap
Gold experienced a major shift in momentum this week.
November 2-4: Sellers dominated, with repeated bearish BOS pushing gold towards 3,869-3,900. Recoveries remained limited below 4,000.
November 6: Strong buying pressure emerged from 3,915, driving gold towards 4,140 and c
XAUUSD — Wave 5 Expansion Toward 4,280
From Kelly’s view, gold remains inside a developing bullish recovery structure after completing a corrective Wave (4) from the 4,147 resistance area. Price is currently trading around 4,108, while buyers are attempting to rebuild momentum above the marked Fibonacci support.
The key idea is simple:
See all futures ideas
EURUSD: Structural Rebound from Support — Target 1.11962⚡ EURUSD: Structural Rebound from Support — Target 1.11962 🚨
• Ticker: FOREXCOM:EURUSD (Euro / U.S. Dollar)
• Timeframe: 15-Minute (15m)
• The Thesis: Spotting the institutional accumulation block at local support before the retail crowd catches the breakout momentum.
🔍 THE MARKET MATRIX (Key Ar
Eurusd weekly Updates level 9.11.2026..13.11.2026*🟡 EUR USD – WEEKLY UPDATE 🟡 ⏰*
*Validity: 9-11-26 to 13-11-26*
*🔹 Bullish Scenario (BUY)*
*• Trend Confirmation: Above 1.128*
*• Targets: 1.132 – 1.137*
*🔻 Bearish Scenario (SELL)*
*• Trend Confirmation: Below 1.108*
*• Targets: 1.104 – 1.095*
*🔄 Key Reversal / Entry Level: 1.118*
AUDUSD Sell position idea Price is on a downtrend
Below 20MA
Break out and retest on the new area of value
Broke support and it has been retesting the new resistance
Daily confirmation candle - price is below resistance
Take profit is the next large area of value, New support
Price has came to an area to enter, making it
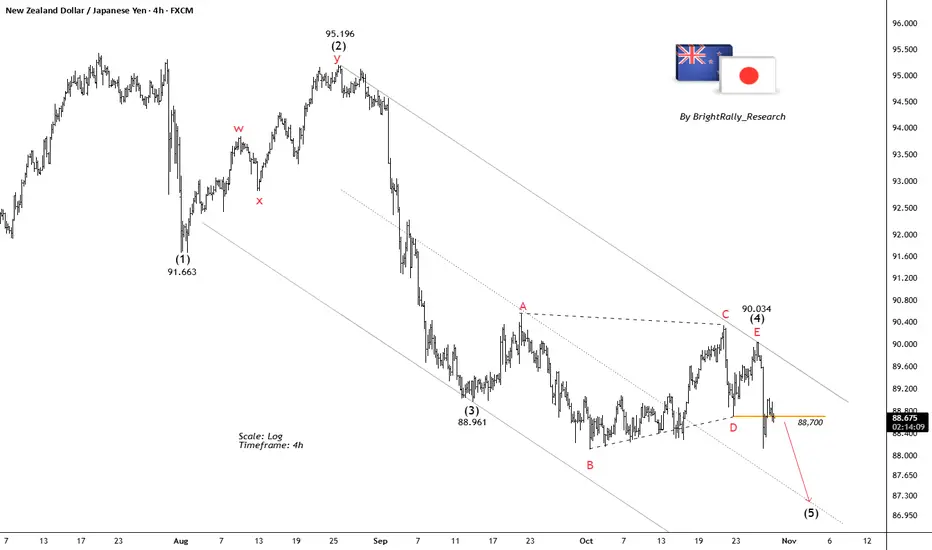
NZDJPY: Bearish Wave (5) Could Target Lower LevelsNZDJPY is showing a potential bearish Elliott Wave structure on the 4H chart, with price facing rejection near the descending trendline. Wave (4) may be complete, suggesting a possible continuation into bearish Wave (5).
Key support is at 88.70. A confirmed break below this level could open the way
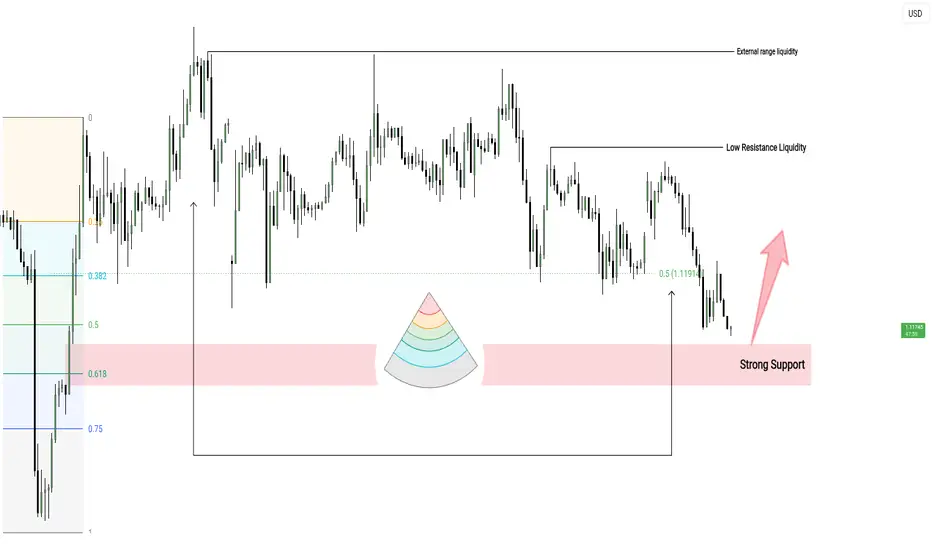
EUR/USD Setup: External Liquidity & Support AnalysisWelcome to this comprehensive technical analysis breakdown for the EUR/USD chart, exploring advanced smart money concepts, liquidity pools, and institutional price delivery mechanics based on the provided image. This educational guide examines how major financial institutions define structural range
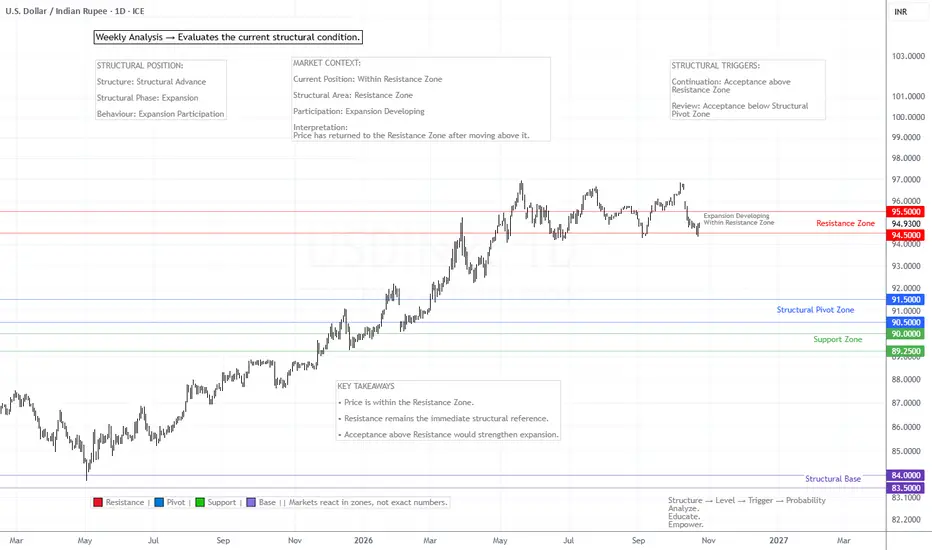
USDINR — Weekly Structural Observation | Week 4325 October 2026
Introduction
USDINR has returned within its established Resistance Zone. In Week 41, price was positioned above Resistance; the Week 43 observation places it back inside the same zone.
The primary structural levels remain unchanged. The current focus is on price behaviour and acc
See all forex ideas
Trade directly on Supercharts through our supported, fully-verified, and user-reviewed brokers.