Long
Long
$JPIRYY - Japan's CPI (December/2025)ECONOMICS:JPIRYY
December/2025
source: Ministry of Internal Affairs & Communications
- Japan’s annual inflation eased to 2.1% in December 2025 from 2.9% in the prior month, the lowest since March 2022. Food inflation fell to a 13-month low (5.1% vs 6.1%), driven by the slowest rise in rice prices in 16 months.
Price growth also eased across clothing (2.0% vs 2.3%), transport (1.9% vs 3.3%), healthcare (0.7% vs 0.8%), household items (1.6% vs 1.8%), and communications (6.2% vs 6.9%).
Energy costs turned negative, with electricity (-2.3% vs 4.9%) and gas (-2.1% vs 0.7%) falling for the first time in four months, reflecting subsidy effects.
Education costs declined further (-5.6% vs -5.6%). In contrast, recreation inflation held steady (at 2.3%), while housing (1.0% vs 0.9%) and miscellaneous goods (0.8% vs 0.6%) edged higher. Core inflation slipped to 2.4% from 3.0%, the lowest since October 2024, though still above the central bank’s 2% target for the 45th straight month.
Monthly, CPI fell 0.1%, reversing November’s 0.3% gain and marking the first drop in nine months. Profits Rising, Credit Failing = CRASH!The Private Sector Isn’t Leveraging for Growth — So Why Are You Buying?
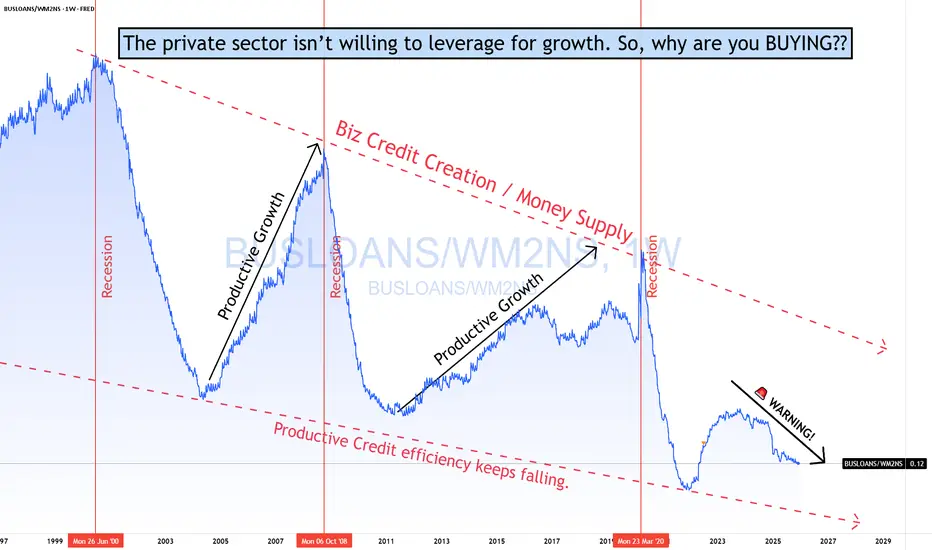
This chart cuts straight to the engine of the bull run in the stock market.
The blue line represents commercial and industrial loans relative to the money supply — a proxy for productive private-sector credit creation.
When it rises, businesses borrow to expand.
When it falls, they don’t.
Right now, "They Don't" it’s falling.
What history shows
A rollover in business credit efficiency precedes every recession:
Not GDP.
Not jobs.
Not inflation.
Credit moves first.
The structural issue
Each recovery now requires:
More money
More leverage
For less productive growth
That’s the law of diminishing returns to credit — and the long-term trend is down.
Why 2020 didn’t fix this
The post-COVID spike was emergency borrowing, not expansion. Once it passed, credit efficiency collapsed to new lows and never recovered.
That’s the tell:
The private sector isn’t willing to leverage for growth.
Why policy can’t save it
The Fed can cut rates and add reserves.
It can’t create profitable opportunities.
When ROI falls, borrowing stops — regardless of policy.
Bottom line
Expansions don’t end when rates rise.
They end when businesses stop borrowing productively.
If the private sector won’t leverage for growth,
Ask yourself what you’re buying.
#FAFO GTFO & STFO!
If you enjoy the work:
👉 Drop a solid comment
Let’s push it to 6,000 and keep building a community grounded in raw truth, not hype.
Velocity Of Money Rolling Over Again!The Real Interpretation
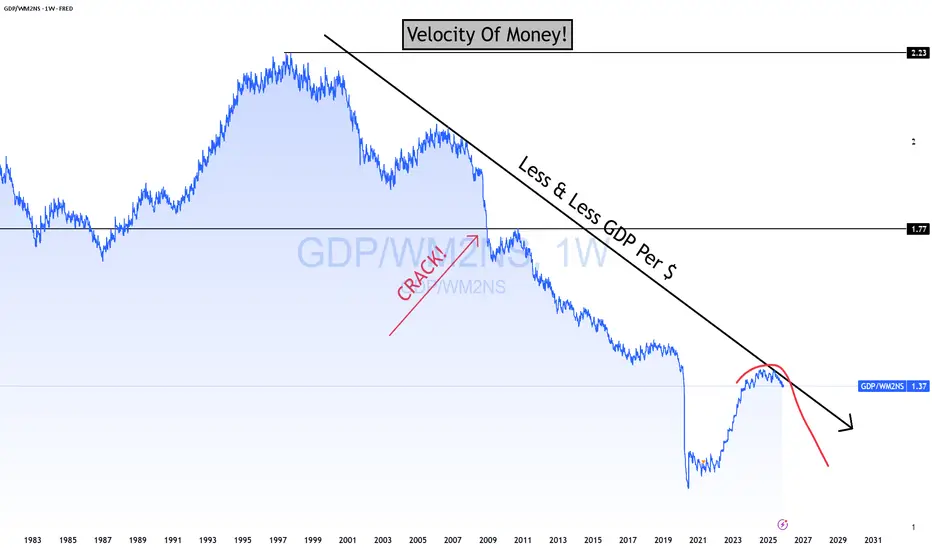
This chart is telling one story:
Money supply growth has massively outpaced real output for decades.
It lines up perfectly with:
Falling real productivity
Stagnant wages
Declining borrower quality
Rising debt-to-GDP
Asset inflation decoupling from fundamentals
The economy shifting from productive borrowing → consumption and asset speculation
You don't fix this with “policy choices.”
You fix it with real wealth creation, which requires creditworthy borrowers — not printing.
Forward-Looking View
Unless:
Productivity rises
Real output accelerates
Borrowers gain real income strength
Capital flows into productive sectors instead of financial games…this ratio won’t materially rise.
That means:
Every new dollar is buying less GDP
Long-term growth potential is fading
More money chasing fewer productive opportunities
More fragility in the credit system
It’s a classic late-cycle fiat symptom.
Here are questions to ask:
If “money creation” creates growth, why is GDP-per-dollar collapsing?
Why did 40 years of money expansion not produce proportional GDP?
If borrowers create loans, where are the new productive borrowers?
Why did QE cause asset inflation but no sustainable GDP boost?
If the system is “fine,” why does each new dollar buy less real output?
Perma Bulls, MMTers, Politicians etc.. can’t answer those without admitting the private-sector engine is weakening.
The less productive output per $ while the markets keep rising & rising will only produce less and less profit per share over time. No matter how much lipstick they put on that pig. Eventually, the economy & markets will CRASH! They always correct themselves in the end.
Perma Bulls have no exit strategy and will go down with the boat!
MMTers will want Gov to borrow and spend EVEN MORE! despite the empirical self-evident fact that print and play doesn't work!
Politicians will borrow and spend even more, claiming they will "STIMULATE THE ECONOMY"
I got all that from just one chart? NO! The entire spectrum of data.
Here is one
THANK YOU for getting me to 5,000 followers! 🙏🔥
Let’s keep climbing.
If you enjoy the work:
👉 Drop a solid comment
Let’s push it to 6,000 and keep building a community grounded in truth, not hype. Short 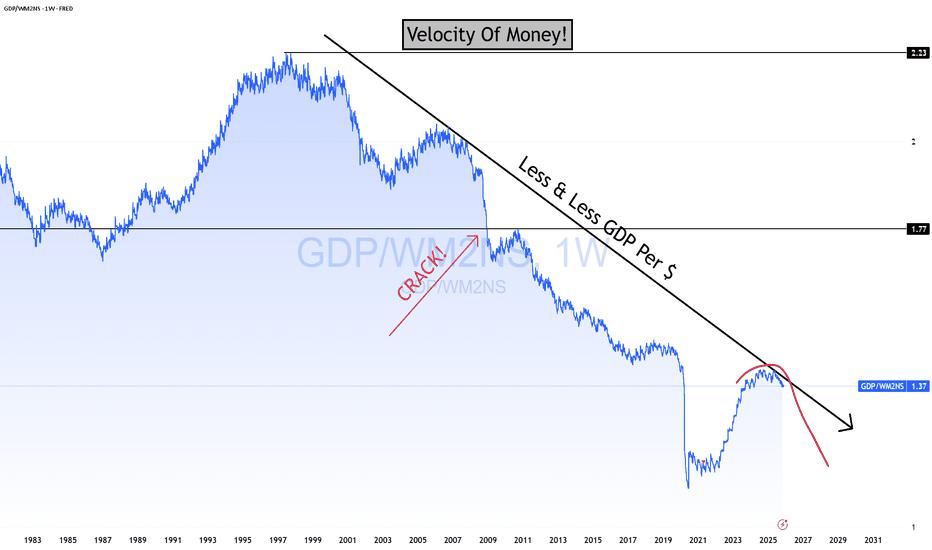
$GBIRYY - U.K CPI (December/2025)ECONOMICS:GBIRYY 3.4%
December/2025 +0.2%
source: Office for National Statistics
- U.K consumer price inflation rose to 3.4% in December 2025, up from November’s eight-month low of 3.2% and slightly above market expectations of 3.3%.
This year-end acceleration, the first since July, could complicate the Bank of England’s efforts to guide inflation back toward its 2% target, though the rise is expected to be temporary thanks to government interventions.
The increase was largely driven by higher prices for alcohol and tobacco, which jumped to 5.2% from 4.0% in November due to the timing of tobacco duty changes, and transport costs, which rose to 4.0% from 3.7% on the back of higher airfares.
Additional upward pressure came from food and non-alcoholic beverages (4.5% vs. 4.2%). Services inflation, a key gauge of domestic price pressures for the BOE, edged up slightly to 4.5% from 4.4%, below expectations.
Core inflation, which excludes volatile items like unprocessed food and energy, remained steady at 3.2%, marking its lowest level since December 2024. Why “End the Fed” Is a Dangerous For Investors“Hate & End the Fed” sounds bold and rebellious. It plays well on social media.
In the real world, it is one of the most dangerous ideas an investor can support.
Not because the Federal Reserve is perfect — it isn’t.
But because its independence is the firewall that prevents politicians from abusing it and collapsing the dollar’s currency payment system.
What People Get Wrong About the Fed
The Fed does not:
Print money and spend it
Fund government deficits
Buy Treasury bonds at issuance
Decide fiscal policy
Those actions are illegal.
The Fed’s job is narrow and operational:
Run the payment system
Set short-term interest rates
Manage bank reserves
Act as settlement agent for Treasury
Ending the Fed would not end “money printing.”
It would remove the last institutional constraint between politics and the payment system.
What Replaces the Fed If It’s “Ended”?
There are only two possibilities:
Direct political control of money
A Treasury-run payment system
Both are historically disastrous.
Without an independent settlement authority:
Spending pressure becomes electoral pressure
Rates become political tools
Inflation is postponed, not prevented
Currency credibility erodes
Markets recognize this instantly.
Why Investors Should Care (Deeply)
Capital does not fear central banks.
Capital fears loss of constraint.
Once investors believe:
Monetary discipline is optional
Rates are politically set
The payment system can be bent for votes
They reprice risk:
Bond yields rise
FX weakens
Equity multiples compress
Capital seeks safer jurisdictions
This is how reserve currencies lose trust — slowly, then all at once.
The Irony
The loudest voices shouting “End the Fed” often claim they oppose money printing.
Ending the Fed would enable exactly that — not through a central bank, but through politicians with no operational firewall.
Right now:
Treasury must fund the TGA
Spending follows funding
The Fed only settles
Remove the Fed, and you don’t get freedom — you get political currency.
Final Thought
The Federal Reserve does not exist to protect bankers.
It exists to limit power — especially political power.
End that constraint, and the dollar’s payment system becomes a political instrument.
Laws
U.S. Constitution – Article I, Section 8: Congress may tax and borrow; it cannot print or spend by decree.
U.S. Constitution – Article I, Section 9: No money may be drawn from the Treasury without lawful appropriation.
Federal Reserve Act §14: The Fed may purchase Treasury securities only in the secondary market, not at issuance.
Federal Reserve Act §10B & §13(3): Fed lending must be collateralized; unsecured lending and funding Treasury are prohibited.
Treasury General Account (TGA) rules / post-1980s reforms: Treasury must spend from a positive TGA balance; no Fed overdrafts.
Markets don’t debate slogans.
They price consequences.
This is not POLITICAL! This is COUNTING!
#FAFO
If you enjoy the work:
👉 Drop a solid comment
Let’s push it to 6,000 and keep building a community grounded in raw truth, not hype.
$CNBOT - China's Balance of Trade (December/2025)ECONOMICS:CNBOT
December/2025
source: General Administration of Customs
- China posted a record USD 1.189 trillion trade surplus in 2025, with exports rising 5.5% while imports were flat.
Faced with Trump's tariffs, Chinese exporters shifted production away from the US market and toward alternative destinations, particularly the EU and Southeast Asia.
In December alone, the surplus reached USD 114.1 billion, marking the seventh time monthly surpluses exceeded USD 100 billion last year.
Exports grew by 6.6% yoy, after a 5.9% in November, surpassing expectations of 3.0% growth, marking the fastest pace since September, driven by a surge in exports to non-US markets, as governments have sought to diversify export destinations since Trump’s victory in the November 2024 presidential election and to deepen trade ties with ASEAN and the EU.
Meanwhile, imports rose 5.7% yoy, beating expectations of 0.9% and marking the fastest pace in six months.
China’s trade surplus with the US fell to USD 23.25 billion in December,
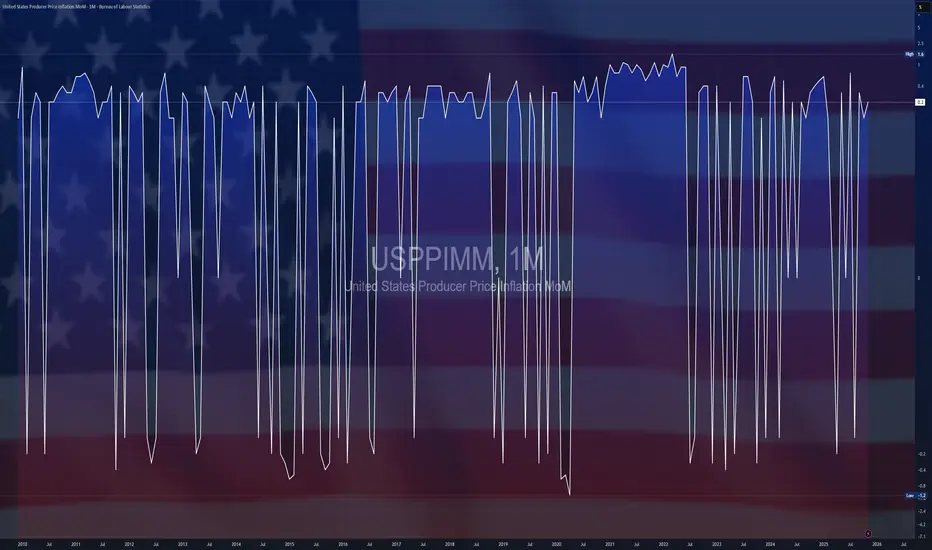
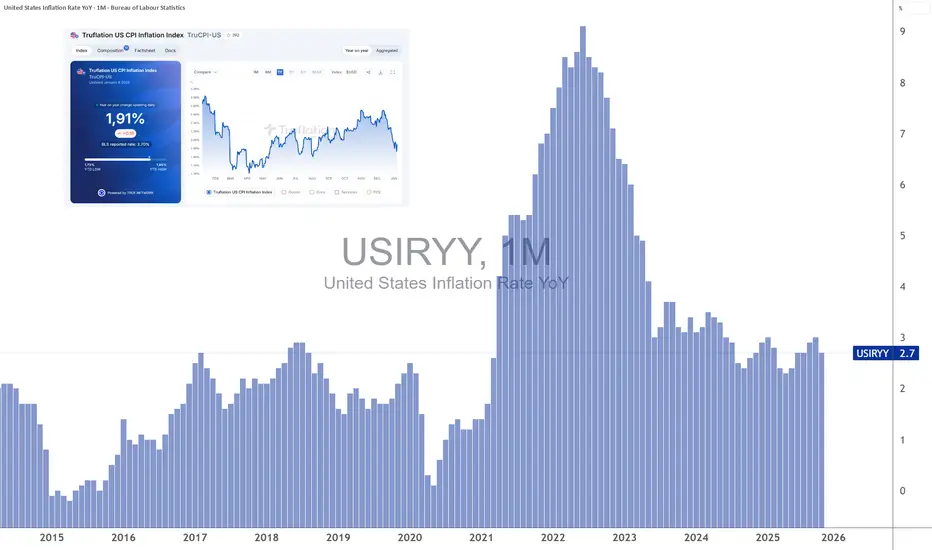
down from USD 23.74 billion in November. Is US Inflation Already Below 2%?After recent geopolitical noise and US employment data, this second week of January marks the major return of US inflation indicators through the CPI and PPI releases. While the sharp drop in inflation in November surprised markets, real-time inflation measures now appear to have fallen back below 2%. Is this credible? Has US inflation truly been defeated, allowing the Federal Reserve to resume cuts to the federal funds rate in the first quarter of 2026?
Tuesday, January 13, 2026, brings the release of US inflation data via the CPI index. Recall that the previous update showed headline US inflation declining to 2.7%, with core inflation easing to 2.6%. This decline surprised the market, and the key issue surrounding the January 13 release is whether it confirms the renewed disinflationary trend in the US economy.
It is worth noting that several highly respected real-time inflation indicators, particularly the CPI and PCE estimates provided by Truflation, have already returned to the Federal Reserve’s 2% target, or even slightly below it.
Truflation’s data currently indicate real-time CPI inflation around 1.9%, with PCE inflation slightly above 2%, yet still very close to the Fed’s target. These indicators, updated daily, offer an advanced view of price dynamics well ahead of official statistics, which are published with a delay. Historically, Truflation has often captured inflation turning points more quickly, explaining the growing attention paid to these measures by institutional investors.
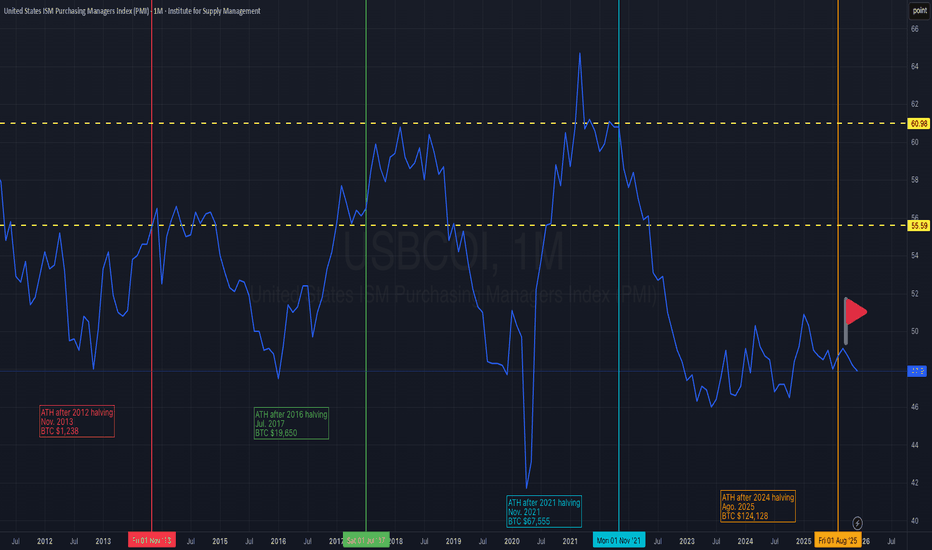
Beyond these aggregate indicators, leading components of inflation also confirm a disinflationary environment. ISM PMI indices, for both manufacturing and services, show a renewed decline in their price-related components. This suggests that upstream inflationary pressures along the value chain continue to ease, reducing the risk of an inflation rebound in the coming months.
Real estate, long a key driver of inflation persistence, no longer appears to be a major risk factor. Zillow’s rent index shows rental inflation close to 2%, signaling that normalization is now largely complete. Given the time lag between market rents and their inclusion in the official CPI, this trend supports continued disinflation in the housing component of CPI during the first half of 2026.
Finally, the energy factor clearly supports a disinflationary scenario. Year-over-year oil price changes are now negative, mechanically exerting downward pressure on headline inflation and limiting second-round effects. As long as this dynamic persists, it acts as a powerful buffer against any resurgence in inflation.
In this context, the key question may no longer be whether US inflation will sustainably fall below 2%, but rather how long the Fed will wait before adjusting its monetary policy accordingly. If January CPI and PPI data confirm the trajectory suggested by real-time indicators, market expectations for a resumption of rate cuts as early as the first quarter of 2026 could strengthen rapidly.
DISCLAIMER:
This content is intended for individuals who are familiar with financial markets and instruments and is for information purposes only. The presented idea (including market commentary, market data and observations) is not a work product of any research department of Swissquote or its affiliates. This material is intended to highlight market action and does not constitute investment, legal or tax advice. If you are a retail investor or lack experience in trading complex financial products, it is advisable to seek professional advice from licensed advisor before making any financial decisions.
This content is not intended to manipulate the market or encourage any specific financial behavior.
Swissquote makes no representation or warranty as to the quality, completeness, accuracy, comprehensiveness or non-infringement of such content. The views expressed are those of the consultant and are provided for educational purposes only. Any information provided relating to a product or market should not be construed as recommending an investment strategy or transaction. Past performance is not a guarantee of future results.
Swissquote and its employees and representatives shall in no event be held liable for any damages or losses arising directly or indirectly from decisions made on the basis of this content.
The use of any third-party brands or trademarks is for information only and does not imply endorsement by Swissquote, or that the trademark owner has authorised Swissquote to promote its products or services.
Swissquote is the marketing brand for the activities of Swissquote Bank Ltd (Switzerland) regulated by FINMA, Swissquote Capital Markets Limited regulated by CySEC (Cyprus), Swissquote Bank Europe SA (Luxembourg) regulated by the CSSF, Swissquote Ltd (UK) regulated by the FCA, Swissquote Financial Services (Malta) Ltd regulated by the Malta Financial Services Authority, Swissquote MEA Ltd. (UAE) regulated by the Dubai Financial Services Authority, Swissquote Pte Ltd (Singapore) regulated by the Monetary Authority of Singapore, Swissquote Asia Limited (Hong Kong) licensed by the Hong Kong Securities and Futures Commission (SFC) and Swissquote South Africa (Pty) Ltd supervised by the FSCA.
Products and services of Swissquote are only intended for those permitted to receive them under local law.
All investments carry a degree of risk. The risk of loss in trading or holding financial instruments can be substantial. The value of financial instruments, including but not limited to stocks, bonds, cryptocurrencies, and other assets, can fluctuate both upwards and downwards. There is a significant risk of financial loss when buying, selling, holding, staking, or investing in these instruments. SQBE makes no recommendations regarding any specific investment, transaction, or the use of any particular investment strategy.
CFDs are complex instruments and come with a high risk of losing money rapidly due to leverage. The vast majority of retail client accounts suffer capital losses when trading in CFDs. You should consider whether you understand how CFDs work and whether you can afford to take the high risk of losing your money.
Digital Assets are unregulated in most countries and consumer protection rules may not apply. As highly volatile speculative investments, Digital Assets are not suitable for investors without a high-risk tolerance. Make sure you understand each Digital Asset before you trade.
Cryptocurrencies are not considered legal tender in some jurisdictions and are subject to regulatory uncertainties.
The use of Internet-based systems can involve high risks, including, but not limited to, fraud, cyber-attacks, network and communication failures, as well as identity theft and phishing attacks related to crypto-assets.
Long