Short
Short
Labor Force Participation Rolling Over👷♂️ U.S. Labor Force Participation Rolling Over — Again
The labor force participation rate is sliding once more, continuing a long-term decline that started back in 2000.
People love to blame it on retiring Boomers — but that excuse doesn’t hold up anymore.
Millennials are a larger demographic group, yet participation still can’t recover.
Something deeper is at play: structural weakness, stagnant productivity, or simply a shift in incentives.
Whatever the cause, fewer people working means lower potential growth and higher dependency on credit-driven demand.
The trend is still down. The economy is weakening under the surface while markets are at all-time highs.
Click boost, follow, comment nicely for more authentic, no BS, raw analysis. Let's get to 6,000 followers. )) Short 
$CNIRYY -China CPI (October/2025)ECONOMICS:CNIRYY +0.2%
October/2025
source: National Bureau of Statistics of China
-China’s consumer prices rose 0.2% yoy in October 2025,
defying expectations for no change and rebounding from a 0.3% decline in the prior month.
It was the first increase in consumer inflation since June and the fastest pace since January.
Non-food inflation accelerated (0.9% vs 0.7% in September), lifted by the expansion of consumer trade-in programs and increased holiday spending during the Golden Week, both of which helped boost domestic demand.
Prices continued to grow for housing (0.1% vs 0.1%), clothing (1.7% vs 1.7%), healthcare (1.4% vs 1.1%), and education (0.9% vs 0.8%).
Meantime, transport costs fell at a slower pace (-1.5% vs -2.0%). On the food side, prices logged the smallest decline in three months (-2.9% vs -4.4%).
Core inflation, which excludes food and energy, rose 1.2% yoy, the highest in 20 months, after September's 1.0% growth. On a monthly basis, consumer prices also increased 0.2%, following a 0.1% gain in September, reaching the highest level in three months. source: National Bureau of Statistics of China The Real DealWhile global markets fixate on AI and the Fed’s next move, a quieter but equally powerful story is unfolding in Brazil. The real is back in the spotlight, underpinned by some of the highest real yields globally, resilient fundamentals, and a shifting trade order that could reshape currency flows in the quarters ahead.
Figure 1: BRLUSD
BRL recently broke above the neckline of a multi-month ascending triangle but has since recovered, trading back within the pattern. A more decisive break above could signal renewed BRL strength. The COVID-19 era saw the BRL fall to historic lows as Brazil faced a fiscal and health crisis, only partially recovering as global liquidity loosened in 2020–2021. More recently, BRLUSD hit record lows again, breaching 0.1600, before stabilizing as the policy backdrop shifted.
Figure 2: BCB’s Rate Hike
Amid resurgent inflation, BRL depreciation, and fiscal expansion, the Central Bank of Brazil (BCB) raised rates aggressively through the second half of 2024, adding 450 basis points in total.
Figure 3: Persistent Inflation
Strong domestic demand, supported by fiscal spending, wage growth, and a tight labor market, reignited inflation in 2024. With the added risk of higher import prices from tariffs, both headline and core inflation remain above the bank’s 3.0% target and the upper tolerance band of 4.5%. In the latest meeting, the BCB maintained its headline inflation forecasts for 2025 and 2026 at 4.8% and 3.6%, respectively.
Figure 4: Modest Growth
Tight monetary conditions have weighed on sentiment. The Business Confidence Index has been trending lower since early 2025, while the Leading Economic Index, which is commonly used to predict future economic turning points, has been negative since May. GDP growth remains resilient for the first half of 2025, but data from the IBC-BR Economic Activity Index, which is widely used as a preview of the GDP figures, suggest moderation is underway.
Figure 5: A Robust Labor Market
With unemployment at a historic low of 5.6%, and strong wage growth, consumer spending remains a key engine of growth. However, rising inflation has eroded purchasing power, limiting real wage gains.
Figure 6: Central Bank Rates
The BCB has stated it will keep the Selic rate at its current restrictive level “for a very long period” to guide inflation back to target and is ready to hike again if needed. This stance has widened interest rate differentials between Brazil and most developed markets. Meanwhile, the Fed’s first rate cut of the year has reinforced this divergence, as it shifts toward balancing labor market risks with persistent inflation while staying data dependent.
Figure 7: Silver Lining in the Current Trade Climate
On April 2, U.S. President Donald Trump declared “Liberation Day” as he announced sweeping tariffs. In August, a 50% tariff was imposed on Brazilian goods (an additional 40% on top of the existing 10%). Despite the apparent threat, Brazil’s trade balance remains in surplus, with exports continuing to grow. Since only 12% of its exports went to the U.S. in 2024, Brazil appears to be relatively insulated from the worst effects.
Recent diplomatic signals between Trump and President Lula have been positive,, while shifting global trade flows present structural opportunities for Brazil. As countries diversify away from the U.S., Brazil has solidified its standing as a key supplier to China and is well-positioned to deepen regional integration and potentially accelerate trade agreements with partners like the European Union.
Putting the Pieces Together
While the market has been focusing on AI-tech, cryptocurrency and precious metals, the high real interest rates, resilient domestic demand, and a shifting trade landscape have brought renewed attention to the BRL. While inflation remains elevated, Brazil’s tight monetary stance makes the currency attractive from a carry perspective, particularly against currencies from easing central banks. At the same time, evolving trade relationships could support structural demand for BRL as exports diversify and deepen. With these forces in play, the BRL stands at the centre of emerging-market FX strategies.
B3 FX Market
Unlike most major currencies, BRL price discovery occurs primarily in B3’s futures market, not the spot market. B3’s dollar futures consistently see some of the highest FX volumes globally, making it the key venue for hedging and speculation.
For Asian participants, however, time zone differences and operational hurdles can limit direct access.
Introducing the BRLUSD Futures on SGX
To address Asian trading frictions, SGX, in collaboration with B3, has launched the BRLUSD futures contract, giving global traders direct access to BRL exposure during Asian market hours. This listing marks an important milestone, complementing B3’s onshore market and extending the BRL liquidity cycle well beyond Latin American and U.S. sessions.
Key advantages of the SGX BRLUSD futures contract:
Asia-hour liquidity: Trade BRLUSD in real time as global macro headlines break overnight. B3’s trading hours overlap with SGX’s night session, further enhancing offshore liquidity.
Hedging flexibility: Particularly useful for global portfolio managers who need to hedge BRL exposure while settling in USD.
Operational simplicity for clients that are already SGX clients.
Cost efficiency comparing to OTC market: Competitive clearing fees and typically tighter bid–ask spreads make execution more efficient.
Cross-margining benefits: Margin offsets are available for inter-commodity spreads, allowing traders to pair BRL with other SGX currency or commodity futures to optimize capital usage.
Putting into Practice
Figure 8: Carry Trade Strategy with BRLUSD
With the Selic rate expected to remain elevated through at least Q1 2026, the wide rate differential between Brazil and major developed markets continues to create opportunities for carry strategies. Fundamentally, the BRL tends to appreciate in a carry environment as demand for BRL-denominated assets rises; driven by investors seeking to capture Brazil’s high interest rates. Moreover, with an already constructive view on the BRL, a carry trade strategy offers a twofold benefit: currency appreciation alongside the positive carry derived from Brazil’s elevated yield advantage. This backdrop supports a long position on BRL.
Since the futures contract listed on SGX is quoted BRLUSD, to express this view, we could directly take a long position in the BRLUSD futures contract (BRLX5) at the current price level of 0.1820. We would set the stop loss at the lower support level of the descending triangle at 0.1790, a hypothetical maximum loss of 0.1820 – 0.1790 = 0.0030 points. While a classic carry trade can simply involve holding the position to benefit from the interest rate differential over time without a predefined take-profit, in this example we set a target at the post-COVID multi-year resistance of 0.2130, for a hypothetical gain of 0.2130 – 0.1820 points.
Furthermore, pairing BRL against low-yielding currencies such as JPY allows traders to capture attractive interest rate differentials while leveraging the inter-commodity margin offsets to enhance capital efficiency. Beyond carry opportunities, portfolio managers in Asia can also use the contract to hedge large BRL exposures, taking advantage of the liquidity outside B3 hours.
Conclusion
With monetary policy set to remain tight, inflation gradually converging, and Brazil carving out a stronger role in global trade, the BRL stands at the intersection of cyclical carry opportunities and structural shifts in capital flows. Whether expressed through directional longs or cross-currency strategies, the BRL offers traders a differentiated play in a market searching for new narratives beyond tech and tariffs. Altseason Indicator: Liquidity and Cycle CorrelationAltseason Indicator: Liquidity and Cycle Correlation
I’d like to share some observations reflecting the dynamics of the altseason.
This setup may perform differently on certain assets, but during testing on Solana (SOL) it showed quite interesting results — the project has been around long enough to clearly display cyclical behavior.
The formula is based on the relationship between global money supply (M2) and crypto market capitalization excluding stablecoins, BTC and ETH :(Total3 – USDT – USDC – DAI), combined with market risk sensitivity via the VIX index.
!Observation!
Periods of altcoin accumulation tend to coincide with moments when the “money” (liquidity) metric moves sideways — between the orange dashed and solid yellow lines (shown as ellipses on the chart).
On the coin’s chart, it’s clearly visible when liquidity starts flowing back into the asset — the colored circles mark the points where price bounced off the lower liquidity boundary.
When comparing the current cycle to 2020–2021, an interesting parallel appears:
The absolute market bottom occurred on March 10, 2020.
After 32 weeks, a steady recovery began.
After another 59 weeks, the cycle peak was reached.
What followed was a drop in confidence and a final “overinflation” toward the top of the previous cycle.
In the current cycle, we seem to be in a similar phase:
about 32 weeks after the recent bottom, a move toward new highs may be forming — just like in 2020. Long 
QE is Back, Why?When he said, 'cease the balance sheet runoff,' it means the Fed plans to keep its balance sheet stable — basically, to stop their balance sheet from shrinking any further under quantitative tightening. But that doesn’t mean they’re starting quantitative easing again.
10 Year Yield Futures
Ticker: 10Y
Minimum fluctuation:
0.001 Index points (1/10th basis point per annum) = $1.00
Disclaimer:
• What presented here is not a recommendation, please consult your licensed broker.
• Our mission is to create lateral thinking skills for every investor and trader, knowing when to take a calculated risk with market uncertainty and a bolder risk when opportunity arises.
CME Real-time Market Data help identify trading set-ups in real-time and express my market views. If you have futures in your trading portfolio, you can check out on CME Group data plans available that suit your trading needs www.tradingview.com
FOMC conference transcript on 29 Oct 25 pertaining to Fed's balance sheet:
"We also decided to conclude the reduction of our aggregate securities holdings as of December 1.
At today’s meeting, the Committee also decided to conclude the reduction of our aggregate securities holdings as of December 1. Our long-stated plan has been to stop balance sheet runoff when reserves are somewhat above the level we judge consistent with ample reserve conditions. Signs have clearly emerged that we have reached that standard. In money markets, repo rates have moved up relative to our administered rates, and we have seen more notable pressures on selected dates along with more use of our standing repo facility. In addition, the effective federal funds rate has begun to move up relative to the rate of interest on reserve balances. These developments are what we expected to see as the size of our balance sheet declined and warrant today’s decision to cease runoff.
Over the 3-1/2 years that we have been shrinking our balance sheet, our securities holdings have declined by $2.2 trillion. As a share of nominal GDP, our balance sheet has fallen from 35 percent to about 21 percent. In December, we will enter the next phase of our normalization plans by holding the size of our balance sheet steady for a time while reserve balances continue to move gradually lower as other non-reserve liabilities such as currency keep growing. We will continue to allow agency securities to run off our balance sheet and will reinvest the proceeds from those securities in Treasury bills, furthering progress toward a portfolio consisting primarily of Treasury securities. This reinvestment strategy will also help move the weighted average maturity of our portfolio closer to that of the outstanding stock of Treasury securities, thus furthering the normalization of the composition of our balance sheet.
CLAIRE JONES. Can I just ask you a quick follow-up on QT? How much of the fund impressions we've seen in money markets are related to the U.S. Treasury issuing more shortterm debt?
CHAIR POWELL. That could be one of the factors, but the reality is that we've seen --the things that we've seen, higher repo rates in the federal funds rate moving up, these are the very things that we -- that we look for. We actually have a framework for looking at the place we're trying to reach. What we said for a long time now is that when we feel like we're a little bit, or a bit above what we consider a level that's ample, that we would freeze the size of the balance sheet. Of course reserves will continue to decline from that point forward, as non-reserve liabilities grow. So this happened, some of it -- some things have been happening for some time now, showing a gradual tightening in money market conditions, really in the last, call it three weeks or so, you've seen more significant tightening, and I think a clear assessment that we're at that place. The other thing is, we're -- the balance sheet is shrinking at a very, very slow pace now. We've reduced it by half twice, and so there's not a lot of benefit to be, to be holding on for it to get the last few dollars, because again, when the balance sheet -- reserves are going to continue to shrink as non-reserves grow. So there was support on the Committee, as we thought about it, to go ahead with this and announce effective December 1 that we will be freezing the size of the balance sheet. And the December 1 date gives the markets a little bit of time to adapt.
STEVE LIESMAN. Just a follow-up on the balance sheet, if you stop it, the runoff now, does that mean you have to go back to actually adding assets sometime next year so that the balance sheet doesn't shrink as a percent of GDP and become a tightening factor?
CHAIR POWELL. So, you're right, the place we'll be on December 1 is that the size of the balance sheet is frozen, and as mortgage-backed securities mature, we'll reinvest those in treasury bills, which will foster both a more treasury balance sheet, and also a shorter duration.
So that's -- in the meantime, if you freeze the size of the balance sheet, the non-reserve liabilities, currency for example, they're going to continue to grow organically and because the size of the balance sheet is frozen, you have further shrinkage in reserves. And reserves is the thing that we're -- that we're managing that has to be ample. So, that'll happen for a time, but not a tremendously long time. We don't know exactly how long, but at a certain point, you'll want to start -- you'll want to start reserves to start gradually growing to keep up with the size of the banking system and the size of the economy. So we'll be adding reserves at a certain point, and that's the last point. Even then we'll be -- we didn't make decisions about this today, but we did talk today about the composition of the balance sheet. And there's a desire that the balance sheet be -- right now it's got a lot more duration than the outstanding universe of treasury securities and we want to move to a place where we're closer to that duration. That'll take some time. We haven't made a decision about the ultimate endpoint, but we all agree that we want to move more in the direction of a balance sheet that more closely reflects the outstanding treasuries. And that means a shorter duration balance sheet. Now, this is something that's going to be -- take a long time and move very, very gradually and I don't think you'll notice it in market conditions. But that's the direction of things.

Short 
Long 
Real Rates, Policy Transition & Cross-Asset Bias (Update)Macro Overview
Global monetary policy remains in a transitional phase, not yet a true easing cycle.
The Federal Reserve executed a hawkish 25 bps cut (4.25% → 4.00%), maintaining its QT program and signaling that further reductions are not guaranteed.
The ECB held rates steady amid slightly higher inflation, while the BoE remains restrictive.
Liquidity conditions, according to the latest H.4.1, confirm a net weekly drain, not an injection — contradicting market narratives of a “pivot.”
🏛️ Global Monetary Conditions (latest data)
United States 🇺🇸
Inflation (YoY): 3.0% (Sep 2025)
Policy Rate: 4.00% (after 25 bps cut)
Real Rate: ≈ +1.0%
Comment: The Fed delivered a hawkish cut; QT remains active. H.4.1 shows liquidity withdrawal (RRP and TGA up, reserves down).
Stance: Restrictive bias maintained.
Euro Area 🇪🇺
Inflation (YoY, flash): 2.1% (Oct 2025)
ECB Deposit Rate: 2.00% (unchanged)
Real Rate: ≈ –0.1%
Stance: Neutral; ECB focuses on currency and fiscal stability.
United Kingdom 🇬🇧
Inflation (YoY): 3.8% (Sep 2025)
Bank Rate: 4.00%
Real Rate: ≈ +0.2%
Stance: Restrictive; inflation remains well above target, limiting policy flexibility.
Brazil 🇧🇷
Inflation (YoY): 5.17% (Sep 2025)
Selic Rate: 15.00%
Real Rate: ≈ +9.8%
Stance: Active easing cycle under high nominal yields; strong carry-trade appeal.
Japan 🇯🇵
Inflation (YoY): 2.9% (Sep 2025)
Policy Rate: 0.50%
Real Rate: ≈ –2.4%
Stance: Ultra-loose, but with tightening bias emerging.
Data Note:
CFTC COT reports remain unavailable during the U.S. government shutdown.
Liquidity assessment must rely on the H.4.1 report, yield curves, and repo dynamics instead of position data.
💧 Liquidity Context (Federal Reserve)
Despite the rate cut, the Fed’s balance sheet continues to contract:
• Securities holdings: –7.1B
• Reverse Repo (RRP): +10.2B
• Treasury General Account (TGA): +50B
• Reserve balances: –85B
→ Net Liquidity: –59B (weekly)
Liquidity conditions are tighter, not looser.
Interpretation:
The Fed’s “insurance cut” contrasts with actual quantitative tightening and a measurable liquidity drain.
💡 Macro Bias Summary
Equities (NASDAQ / S&P500) – Neutral to slightly bullish tactically. The rate cut provides short-term relief, but QT and liquidity contraction limit upside potential.
Commodities (Gold / Oil / Copper) – Mixed bias. Gold capped by higher real yields; oil and copper remain driven by global demand expectations.
USD (DXY) – Bullish bias. Rate differentials and liquidity drain favor the dollar in the short term.
EUR/USD – Bearish bias. Euro policy stable, but U.S. remains tighter in real terms; spread still favors USD.
Crypto (BTC / ETH) – Range-bound and liquidity sensitive. Speculative flows remain correlated to net liquidity trends.
🧭 Cycle Interpretation
We remain in a prolonged transition, not a clean easing phase.
Real rates are positive, balance-sheet runoff continues, and central banks remain cautious after two years of inflation pressure.
The macro liquidity cycle is not yet expansionary, and risk assets should be traded selectively, not directionally.
Quote
“Fade the rhetoric, trade the flows — until net liquidity turns up decisively, ‘easing’ is a headline, not a condition.”  Education
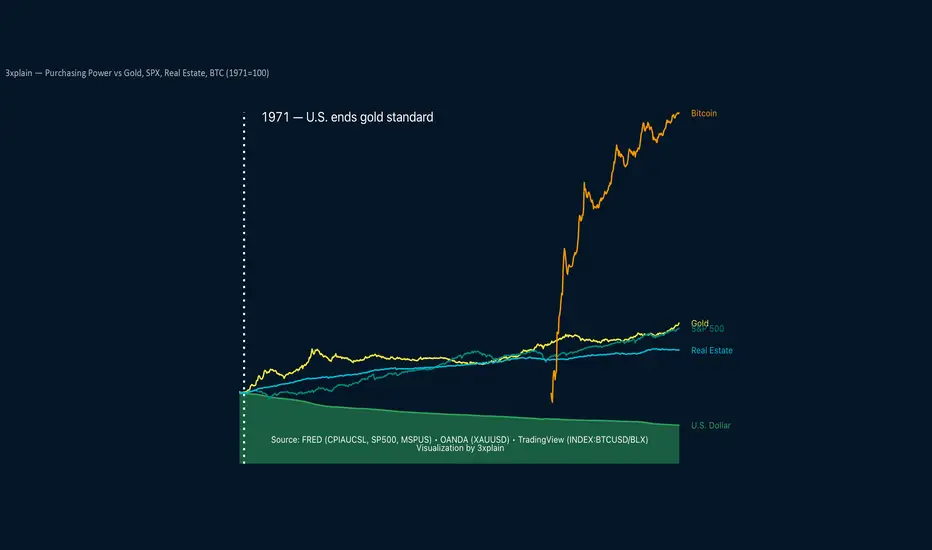
Purchasing Power vs Gold, Stocks, Real Estate, BTC (1971 = 100)Since the U.S. left the gold standard in 1971, the dollar has lost more than 85% of its purchasing power. This chart compares the dollar’s decline to major assets including gold, stocks, real estate, and Bitcoin, all normalized to 1971 = 100. It shows how value preservation and growth have shifted across different asset classes over time.
Source: FRED (CPIAUCSL, SP500, MSPUS) • OANDA (XAUUSD) • TradingView (INDEX:BTCUSD/BLX)
Visualization by 3xplain Education 
$EUIRYY -Europe CPI (October/2025)ECONOMICS:EUIRYY 2.1%
October/2025
source: EUROSTAT
-Euro area consumer price inflation eased to 2.1% in October 2025,
in line with market expectations and down from 2.2% in September,
edging closer to the ECB’s 2% target, according to preliminary data.
Food, alcohol, and tobacco prices rose more slowly at 2.5%, versus 3.0% the previous month, led by both processed (2.4% vs 2.6%) and unprocessed food (3.2% vs 4.7%). Non-energy industrial goods inflation eased to 0.6% from 0.8%, while energy costs fell more sharply at -1.0% versus -0.4%.
In contrast, services inflation accelerated for a second straight month to 3.4%, the highest since April, while core inflation, excluding energy, food, alcohol, and tobacco, remained stable at 2.4%, slightly above forecasts of 2.3%. $EUGDPQQ -Europe GDP (Q3/2025)ECONOMICS:EUGDPQQ
Q3/2025 +0.2%
source: EUROSTAT
- The Eurozone economy expanded by 0.2% quarter-on-quarter in Q3 2025,
up from 0.1% in Q2 and slightly above market expectations of 0.1%, according to a flash estimate.
France grew 0.5%, exceeding expectations of 0.2%, driven by a sharp rise in exports, while Spain remained the best performer among the bloc’s largest economies, expanding 0.6% as expected, supported by strong household consumption and fixed investment.
Meanwhile, Germany stagnated due to a decline in exports, and Italy stalled, with the industrial sector contracting and services showing no growth.
On an annual basis, Eurozone GDP rose 1.3%, above expectations of 1.2%.
The better-than-expected figures ease pressure on the ECB to cut interest rates in the near term, supporting the view that the economy remains resilient despite geopolitical tensions and trade policy uncertainty. $JPINTR -Japan Interest Rates (October/2025)ECONOMICS:JPINTR
October/2025
source: Bank of Japan
- The Bank of Japan kept its benchmark short-term rate unchanged at 0.5% in October 2025, maintaining borrowing costs at their highest level since 2008 and extending a pause since the last hike in January.
The decision, in line with market expectations, was approved by a 7-2 vote, with board members Naoki Tamura and Hajime Takata again proposing a rise to 0.75%, as they had in September.
The central bank reaffirmed its commitment to continue raising borrowing costs if the economy follows its projections.
The move came hours after the U.S. Federal Reserve delivered its second rate cut of the year.
In its quarterly outlook, the BoJ held core inflation for FY 2025 at 2.7%, expecting it to ease to 1.8% in FY 2026 before rising slightly to 2.0% in FY 2027.
GDP growth for FY 2025 was revised up to 0.7% from 0.6%, supported by a trade deal with Washington and new leadership under Prime Minister Sanae Takaichi, while GDP projections for FY 2026 and 2027 remained at 0.7% and 1%, respectively.