Kevin Hassett, the next Fed Chair?President Trump is expected to appoint the next Chair of the Federal Reserve at the beginning of 2026 (for a term starting after Powell’s departure in May 2026). Based on current probabilities, Kevin Hassett appears to be the frontrunner to succeed Jerome Powell at the head of the FOMC. Hassett has consistently expressed his preference for a more accommodative monetary stance, so if he were to lead the Fed, it would significantly change the outlook for US monetary policy in 2026 and beyond. If his nomination were announced in January, he could act as a “shadow Fed Chair” until Powell steps down in May.
1) Kevin Hassett, the favorite to succeed Powell
As the transition toward a new presidential term becomes clearer, attention is increasingly turning to the next appointment at the helm of the Federal Reserve, scheduled for May 2026. Market probabilities, including those observed on Polymarket, currently give Kevin Hassett—a former Chairman of the Council of Economic Advisers under Donald Trump—a clear lead. With more than 80% implied odds, Hassett stands out as the favorite, even if these figures reflect expectations rather than certainties. They nonetheless signal a widely shared perception: that of a credible profile aligned with Trump’s economic priorities and considered politically compatible with the agenda of the incoming administration. These probabilities evolve quickly, but the current dynamic clearly indicates that Hassett benefits from strong momentum, driven by political signals and the absence of alternative candidates with comparable support among Trump-aligned circles.
2) A Fed under Kevin Hassett would be more accommodative
On monetary policy, Kevin Hassett has advocated for several years a significantly more accommodative stance than Jerome Powell. While Powell has maintained a prolonged stance of firmness in the face of inflation—at the cost of a restrictive policy often criticized by Trump—Hassett adopts an economic reading that gives more weight to growth and flexibility. He has expressed openness to the idea that the US could sustain a lower-rate environment, arguing that risks to economic activity may justify a faster easing than the current Fed envisions. Although supportive of inflation control, his analysis is based on the idea that the economic cycle is now more sensitive to rate increases than in the past, leading him to prioritize growth over inflation. This theoretical and political foundation could appeal to Trump, who seeks a financial environment conducive to investment and economic expansion early in his term.
3) Kevin Hassett as a “shadow Fed Chair”?
If Hassett were indeed appointed in the coming months, he would not take office until May 2026, leaving several months during which Powell would still lead the Fed. This situation would create a potentially unprecedented interim: that of a “shadow Fed Chair”. Without formal authority, Hassett could nonetheless influence the public debate, participate in economic discussions with the administration, and send indicative signals about future monetary orientation. His public comments could then be interpreted as forward-looking guidance on the Fed’s post-Powell intentions.
DISCLAIMER:
This content is intended for individuals who are familiar with financial markets and instruments and is for information purposes only. The presented idea (including market commentary, market data and observations) is not a work product of any research department of Swissquote or its affiliates. This material is intended to highlight market action and does not constitute investment, legal or tax advice. If you are a retail investor or lack experience in trading complex financial products, it is advisable to seek professional advice from licensed advisor before making any financial decisions.
This content is not intended to manipulate the market or encourage any specific financial behavior.
Swissquote makes no representation or warranty as to the quality, completeness, accuracy, comprehensiveness or non-infringement of such content. The views expressed are those of the consultant and are provided for educational purposes only. Any information provided relating to a product or market should not be construed as recommending an investment strategy or transaction. Past performance is not a guarantee of future results.
Swissquote and its employees and representatives shall in no event be held liable for any damages or losses arising directly or indirectly from decisions made on the basis of this content.
The use of any third-party brands or trademarks is for information only and does not imply endorsement by Swissquote, or that the trademark owner has authorised Swissquote to promote its products or services.
Swissquote is the marketing brand for the activities of Swissquote Bank Ltd (Switzerland) regulated by FINMA, Swissquote Capital Markets Limited regulated by CySEC (Cyprus), Swissquote Bank Europe SA (Luxembourg) regulated by the CSSF, Swissquote Ltd (UK) regulated by the FCA, Swissquote Financial Services (Malta) Ltd regulated by the Malta Financial Services Authority, Swissquote MEA Ltd. (UAE) regulated by the Dubai Financial Services Authority, Swissquote Pte Ltd (Singapore) regulated by the Monetary Authority of Singapore, Swissquote Asia Limited (Hong Kong) licensed by the Hong Kong Securities and Futures Commission (SFC) and Swissquote South Africa (Pty) Ltd supervised by the FSCA.
Products and services of Swissquote are only intended for those permitted to receive them under local law.
All investments carry a degree of risk. The risk of loss in trading or holding financial instruments can be substantial. The value of financial instruments, including but not limited to stocks, bonds, cryptocurrencies, and other assets, can fluctuate both upwards and downwards. There is a significant risk of financial loss when buying, selling, holding, staking, or investing in these instruments. SQBE makes no recommendations regarding any specific investment, transaction, or the use of any particular investment strategy.
CFDs are complex instruments and come with a high risk of losing money rapidly due to leverage. The vast majority of retail client accounts suffer capital losses when trading in CFDs. You should consider whether you understand how CFDs work and whether you can afford to take the high risk of losing your money.
Digital Assets are unregulated in most countries and consumer protection rules may not apply. As highly volatile speculative investments, Digital Assets are not suitable for investors without a high-risk tolerance. Make sure you understand each Digital Asset before you trade.
Cryptocurrencies are not considered legal tender in some jurisdictions and are subject to regulatory uncertainties.
The use of Internet-based systems can involve high risks, including, but not limited to, fraud, cyber-attacks, network and communication failures, as well as identity theft and phishing attacks related to crypto-assets.
 Education
The Era of Gentle Money (QE)- This chart features labels for all key dates, offering a clear and comprehensive overview, including trillions in money creation, QT and QE phases, crises, and flash printing events.
- To truly understand stocks, cryptocurrencies, or precious metals, you first need to understand the monetary system and how it drives inflation.
- The market has been heavily suppressed since June 2022, when the Fed began its Quantitative Tightening (QT), the Fed kicked off a new QE phase on December 1, 2025.
- This is the primary driver behind yesterday’s BTC market surge.
- To complement this, we will soon have a new Fed President, Most likely, they will continue cutting rates, printing more money, and Banks will increase lending, encouraging people to take more risks, which could drive markets higher. Bearish sentiment is premature at this stage.
The heart of truth beats in the printer and in the river of liquidity !
Happy Tr4Ding !
Long 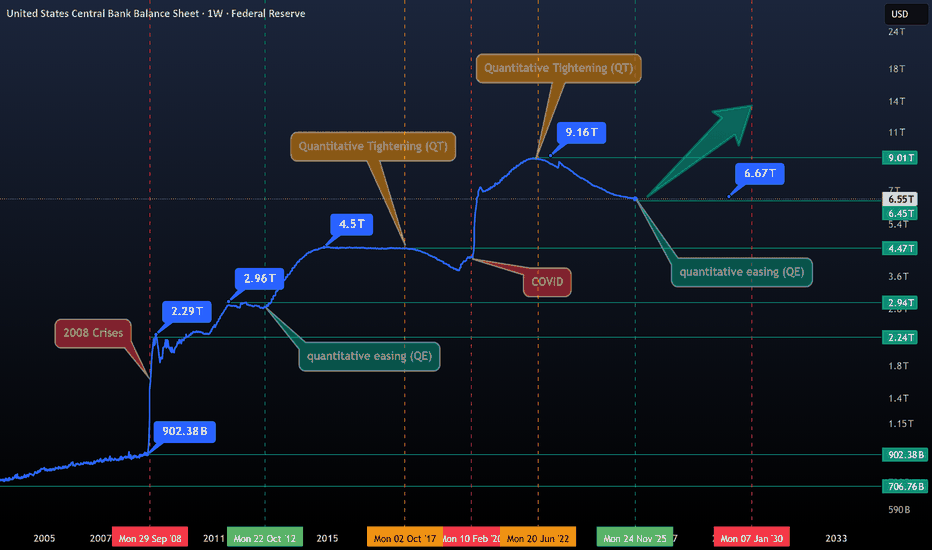
Bearish divergence, bigger number not always better for housingFull disclosure I got Ai to compose this because I'm dyslexic and a scatter brain.
and this is a duplicate because I tried to delete it once I found out it scaled bad on mobile, and trading views delete function MIA! ( within the cool down ) go figure.
I definitely have a bias to btc and maybe a long position on the JPY. Have a read have a look.
I have loosely marked some economic data on here showing Policy might not be working well enough because wages didn't keep up with CPI causing a real value losses after 2022.
I have supplied the ratio chart for gold as a indicator at the top.
Structural Policy Drivers (The Cause of the Bull Trend)
These points explain why the long-term trend line (the logarithmic regression) slopes upward:
1. The Foundation of Investment (1999): The introduction of the 50% Capital Gains Tax (CGT) Discount in September 1999 was the single most powerful structural stimulus. It transformed property investment (combined with Negative Gearing) into the primary wealth-creation strategy, ensuring sustained investor demand.
2. GFC Policy Proof (2008-2009): The market's low point during the GFC was immediately arrested by the First Home Owners Boost (FHOB) and broad cash payments (October 2008). This showed that the government would deploy massive, rapid stimulus to prevent a structural price fall, reinforcing investor confidence.
3. The Liquidity Flood (March 2020): The RBA's emergency COVID Rate Cuts and Quantitative Easing (QE) injected unprecedented liquidity, creating the conditions for the most recent Nominal Higher High.
II. The Bearish Divergence Signal (The Warning)
These points explain why the recent peak is weak and unsustainable:
4. Technical Exhaustion: The Bearish Divergence observed between the Nominal HPI Price (making a \text{Higher High} in 2022) and the RSI/Momentum (making a \text{Lower High}) signals that the momentum required to sustain the uptrend is exhausted.
5. The Illusion of Value: The Nominal Higher High is highly misleading. When adjusted:
Purchasing Value: The Price-to-Income Ratio reached a \text{record high} (\sim 8.0 times income), meaning the price peak was actually a Lower Low in affordability.
Real Value: When measured in Ounces of Gold, the HPI peaked at a massive Lower Low (\sim 206 ounces in 2024 vs. \sim 874 ounces in 2004), demonstrating the fragility of AUD-denominated property wealth.
III. The Policy Constraint (The System Strain)
These points explain the high risk and fragility of the current market:
6. Diminishing Returns: The market required the extreme, combined stimulus of near-zero rates (RBA) and low-deposit guarantees (5% FHB schemes}) to reach its 2022 peak. The Bearish Divergence confirms this level of effort produced a historically weak momentum result, indicating policy inefficiency.
7. The Investor Exit Trigger: The current high interest rates and the {Lower Low in Purchasing Value} are highly likely to encourage a rotation of capital. A sell-off of just 5\% of investment equity (\approx \$104 Billion) could overwhelm {FHB} demand and force a Nominal Price Correction a {Lower Low}) by late 2026 / mid-2027.
8. The "Double Whammy" Risk: Recent low-deposit buyers face extreme risk: their equity is thin (vulnerable to price drops) while their debt servicing remains stretched, as large wage increases are structurally unlikely (due to the RBA's mandate to curb inflation).
🛑 INVESTMENT PROPERTY HEDGE: The Exit Strategy
This strategy is for owners of non-owner-occupied property facing the convergence of the {AU} Housing {Bearish Divergence} and the Global {JPY} Unwind.
✅ Core Hedges: Replacing Inefficient Investment Equity
The goal is to move capital from a low-momentum, illiquid, highly-taxed, AUD-denominated asset (investment property) into a high-liquidity, real-value store.
1. Physical Gold & Silver (The Devaluation Defense):
WHY: Gold is the essential hedge against the currency risk. Our analysis shows that your property's value has collapsed when measured in Gold {Lower Low} on the {House Price-to-Gold Ratio}). Converting illiquid property equity into physical metals protects wealth from the {AUD} devaluation caused by both domestic policy strain and global policy shocks.
Investment Action: This should be prioritized for preserving the real wealth that may be lost if Nominal {QAUR628BIS} corrects.
2. Defensive Japanese Yen {JPY}) Exposure:
WHY: This is the most direct hedge against the global liquidity shock. The {JPY} is the "funding currency" for the global risk trade. When the carry trade unwinds, investors must buy {JPY} to repay their debt, causing a sharp appreciation. This {JPY} strength would directly offset losses incurred by the domestic housing slowdown.
Investment Action: Provides protection against the {2026-2027} global market crash that the {JPY} unwind is predicted to trigger.
3. Bitcoin (The Non-Sovereign Liquidity Drain):
WHY: Bitcoin provides the fastest, most tax-efficient (long-term {CGT} relief applies) exit route for capital leaving a strained domestic financial system. It is the perfect liquid asset to absorb the {\$104B} of equity that a 5\% investor sell-off would create.
Investment Action: A strategic allocation here hedges against both {AUD} devaluation and the systemic policy risks you've identified.
❌ Liabilities to AVOID: The System's Vulnerabilities
1. Australian Bank Stocks {CBA, Westpac, etc.}):
WHY NOT: Their fate is tied to your property's mortgage risk. The {Bearish Divergence} on the (QAUR628BIS) directly increases their credit risk. The {JPY} unwind will also hurt them by disrupting global financial stability and reducing lending capacity. They are a concentrated liability.
2. Leveraged US Stock Indices {S\&P 500/Nasdaq}):
WHY NOT: The {US} market is a primary target of the {JPY} carry trade unwind. Leveraged investors will be forced to sell these high-performing assets to close their debt positions, leading to a non-fundamental, sharp correction. The risk of sudden {JPY}-driven liquidation is too high.
Thanks for reading I made this for my Father who recently had to ( forced hand) purchase another home (above what he lived for "reasons") convinced cash and the property are safe and cannot afford to lose more money.
Leave a comment for him.
Or add to the conversation share your own views. Bearish divergence, policy failing to create a real higher highFull disclosure I got Ai to compose this because I'm dyslexic and a scatter brain.
I definitely have a bias to btc and maybe a long position on the JPY. Have a read have a look.
I have loosely marked some economic data on here showing Policy might not be working well enough because wages didn't keep up with CPI causing a real value losses after 2022.
I have supplied the ratio chart for gold as a indicator at the top.
Structural Policy Drivers (The Cause of the Bull Trend)
These points explain why the long-term trend line (the logarithmic regression) slopes upward:
1. The Foundation of Investment (1999): The introduction of the 50% Capital Gains Tax (CGT) Discount in September 1999 was the single most powerful structural stimulus. It transformed property investment (combined with Negative Gearing) into the primary wealth-creation strategy, ensuring sustained investor demand.
2. GFC Policy Proof (2008-2009): The market's low point during the GFC was immediately arrested by the First Home Owners Boost (FHOB) and broad cash payments (October 2008). This showed that the government would deploy massive, rapid stimulus to prevent a structural price fall, reinforcing investor confidence.
3. The Liquidity Flood (March 2020): The RBA's emergency COVID Rate Cuts and Quantitative Easing (QE) injected unprecedented liquidity, creating the conditions for the most recent Nominal Higher High.
II. The Bearish Divergence Signal (The Warning)
These points explain why the recent peak is weak and unsustainable:
4. Technical Exhaustion: The Bearish Divergence observed between the Nominal HPI Price (making a \text{Higher High} in 2022) and the RSI/Momentum (making a \text{Lower High}) signals that the momentum required to sustain the uptrend is exhausted.
5. The Illusion of Value: The Nominal Higher High is highly misleading. When adjusted:
Purchasing Value: The Price-to-Income Ratio reached a \text{record high} (\sim 8.0 times income), meaning the price peak was actually a Lower Low in affordability.
Real Value: When measured in Ounces of Gold, the HPI peaked at a massive Lower Low (\sim 206 ounces in 2024 vs. \sim 874 ounces in 2004), demonstrating the fragility of AUD-denominated property wealth.
III. The Policy Constraint (The System Strain)
These points explain the high risk and fragility of the current market:
6. Diminishing Returns: The market required the extreme, combined stimulus of near-zero rates (RBA) and low-deposit guarantees (5% FHB schemes}) to reach its 2022 peak. The Bearish Divergence confirms this level of effort produced a historically weak momentum result, indicating policy inefficiency.
7. The Investor Exit Trigger: The current high interest rates and the {Lower Low in Purchasing Value} are highly likely to encourage a rotation of capital. A sell-off of just 5\% of investment equity (\approx \$104 Billion) could overwhelm {FHB} demand and force a Nominal Price Correction a {Lower Low}) by late 2026 / mid-2027.
8. The "Double Whammy" Risk: Recent low-deposit buyers face extreme risk: their equity is thin (vulnerable to price drops) while their debt servicing remains stretched, as large wage increases are structurally unlikely (due to the RBA's mandate to curb inflation).
🛑 INVESTMENT PROPERTY HEDGE: The Exit Strategy
This strategy is for owners of non-owner-occupied property facing the convergence of the {AU} Housing {Bearish Divergence} and the Global {JPY} Unwind.
✅ Core Hedges: Replacing Inefficient Investment Equity
The goal is to move capital from a low-momentum, illiquid, highly-taxed, AUD-denominated asset (investment property) into a high-liquidity, real-value store.
1. Physical Gold & Silver (The Devaluation Defense):
WHY: Gold is the essential hedge against the currency risk. Our analysis shows that your property's value has collapsed when measured in Gold {Lower Low} on the {House Price-to-Gold Ratio}). Converting illiquid property equity into physical metals protects wealth from the {AUD} devaluation caused by both domestic policy strain and global policy shocks.
Investment Action: This should be prioritized for preserving the real wealth that may be lost if Nominal \text{HPI} corrects.
2. Defensive Japanese Yen {JPY}) Exposure:
WHY: This is the most direct hedge against the global liquidity shock. The {JPY} is the "funding currency" for the global risk trade. When the carry trade unwinds, investors must buy {JPY} to repay their debt, causing a sharp appreciation. This {JPY} strength would directly offset losses incurred by the domestic housing slowdown.
Investment Action: Provides protection against the {2026-2027} global market crash that the {JPY} unwind is predicted to trigger.
3. Bitcoin (The Non-Sovereign Liquidity Drain):
WHY: Bitcoin provides the fastest, most tax-efficient (long-term {CGT} relief applies) exit route for capital leaving a strained domestic financial system. It is the perfect liquid asset to absorb the {\$104B} of equity that a 5\% investor sell-off would create.
Investment Action: A strategic allocation here hedges against both \text{AUD} devaluation and the systemic policy risks you've identified.
❌ Liabilities to AVOID: The System's Vulnerabilities
1. Australian Bank Stocks {CBA, Westpac, etc.}):
WHY NOT: Their fate is tied to your property's mortgage risk. The {Bearish Divergence} on the (QAUR628BIS) directly increases their credit risk. The {JPY} unwind will also hurt them by disrupting global financial stability and reducing lending capacity. They are a concentrated liability.
2. Leveraged US Stock Indices {S\&P 500/Nasdaq}):
WHY NOT: The {US} market is a primary target of the {JPY} carry trade unwind. Leveraged investors will be forced to sell these high-performing assets to close their debt positions, leading to a non-fundamental, sharp correction. The risk of sudden {JPY}-driven liquidation is too high.
Thanks for reading I made this for my Father who recently had to ( forced hand) purchase another home (above what he lived for "reasons") convinced cash and the property are safe and cannot afford to lose more money.
Leave a comment for him.
Or add to the conversation share your own views. 7 votes for a rate cut on December 10?!As we approach the last monetary policy meeting of the year, scheduled for Wednesday, December 10, uncertainty remains high. The CME FedWatch tool now suggests a dominant probability of a 25-basis-point rate cut, but this probability can shift significantly from one day to the next depending on the lagging macro data that will be released before the Fed meeting on Wednesday, December 10.
The reason is simple: the decision no longer depends solely on macroeconomic data, but also — and above all — on the balance of power within the FOMC, the Federal Reserve’s deliberative body. For a rate cut to be approved, at least 7 votes out of the 12 voting members are required. Yet the Committee appears today deeply divided, both in its diagnosis and in its monetary policy preferences.
Economic data: a necessary but not sufficient factor
The upcoming PCE inflation figures, the Fed’s preferred inflation measure, will play a crucial role. If price dynamics remain under control, this would strengthen the argument for monetary easing. Moderate growth and signs of softening in the labor market also support such a move.
But despite these signals, the context remains ambiguous: several Committee members believe that disinflation is not yet firmly anchored, or that the risks of a rebound remain too high. Hence the lingering caution, even in the face of a market probability clearly leaning toward a cut.
A fragmented FOMC: the real source of suspense
It is truly the internal composition of the FOMC that makes the outcome of the meeting so uncertain. The Committee has rarely been so heterogeneous in its positions. The profiles fall into three groups:
1. The dovish camp, favoring swift easing.
Some members clearly support a cut, or even a larger adjustment. They believe inflation is slowing enough to reduce pressure on the economy.
2. The hawkish camp, opposed to an imminent cut.
For them, the Fed must remain vigilant, keep rates high, and avoid loosening policy too early at the risk of reigniting inflationary pressures.
3. The central camp, cautious, hesitant, and likely decisive.
These “neutral” or “slightly dovish” members will ultimately swing the vote.
Today, the distribution of opinions shows that only a few votes could tip the balance. Chair Jerome Powell, typically a consensus figure, has himself been notably cautious, which further complicates the reading of internal dynamics.
An open decision, despite market signals
In summary, even if the CME FedWatch assigns a majority probability to a rate cut on December 10, the political reality inside the FOMC calls for restraint. It is not just a matter of economic data but a delicate balance between divergent views within the institution.
For now, only one thing is certain: the slightest macroeconomic release and the slightest statement from a Fed member will immediately impact expectations. The final decision will be played out in the complex arena of the internal vote, where every voice will count.
DISCLAIMER:
This content is intended for individuals who are familiar with financial markets and instruments and is for information purposes only. The presented idea (including market commentary, market data and observations) is not a work product of any research department of Swissquote or its affiliates. This material is intended to highlight market action and does not constitute investment, legal or tax advice. If you are a retail investor or lack experience in trading complex financial products, it is advisable to seek professional advice from licensed advisor before making any financial decisions.
This content is not intended to manipulate the market or encourage any specific financial behavior.
Swissquote makes no representation or warranty as to the quality, completeness, accuracy, comprehensiveness or non-infringement of such content. The views expressed are those of the consultant and are provided for educational purposes only. Any information provided relating to a product or market should not be construed as recommending an investment strategy or transaction. Past performance is not a guarantee of future results.
Swissquote and its employees and representatives shall in no event be held liable for any damages or losses arising directly or indirectly from decisions made on the basis of this content.
The use of any third-party brands or trademarks is for information only and does not imply endorsement by Swissquote, or that the trademark owner has authorised Swissquote to promote its products or services.
Swissquote is the marketing brand for the activities of Swissquote Bank Ltd (Switzerland) regulated by FINMA, Swissquote Capital Markets Limited regulated by CySEC (Cyprus), Swissquote Bank Europe SA (Luxembourg) regulated by the CSSF, Swissquote Ltd (UK) regulated by the FCA, Swissquote Financial Services (Malta) Ltd regulated by the Malta Financial Services Authority, Swissquote MEA Ltd. (UAE) regulated by the Dubai Financial Services Authority, Swissquote Pte Ltd (Singapore) regulated by the Monetary Authority of Singapore, Swissquote Asia Limited (Hong Kong) licensed by the Hong Kong Securities and Futures Commission (SFC) and Swissquote South Africa (Pty) Ltd supervised by the FSCA.
Products and services of Swissquote are only intended for those permitted to receive them under local law.
All investments carry a degree of risk. The risk of loss in trading or holding financial instruments can be substantial. The value of financial instruments, including but not limited to stocks, bonds, cryptocurrencies, and other assets, can fluctuate both upwards and downwards. There is a significant risk of financial loss when buying, selling, holding, staking, or investing in these instruments. SQBE makes no recommendations regarding any specific investment, transaction, or the use of any particular investment strategy.
CFDs are complex instruments and come with a high risk of losing money rapidly due to leverage. The vast majority of retail client accounts suffer capital losses when trading in CFDs. You should consider whether you understand how CFDs work and whether you can afford to take the high risk of losing your money.
Digital Assets are unregulated in most countries and consumer protection rules may not apply. As highly volatile speculative investments, Digital Assets are not suitable for investors without a high-risk tolerance. Make sure you understand each Digital Asset before you trade.
Cryptocurrencies are not considered legal tender in some jurisdictions and are subject to regulatory uncertainties.
The use of Internet-based systems can involve high risks, including, but not limited to, fraud, cyber-attacks, network and communication failures, as well as identity theft and phishing attacks related to crypto-assets.
Education 
Long 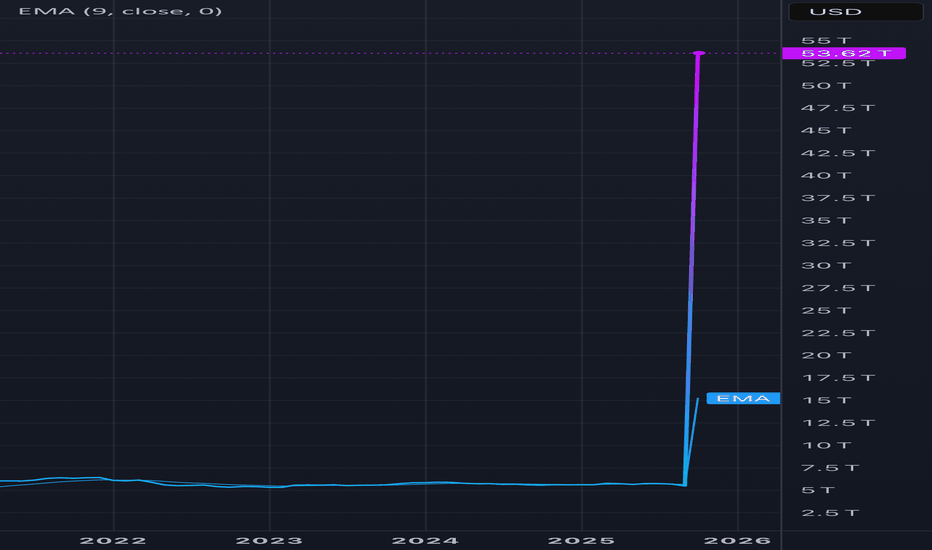
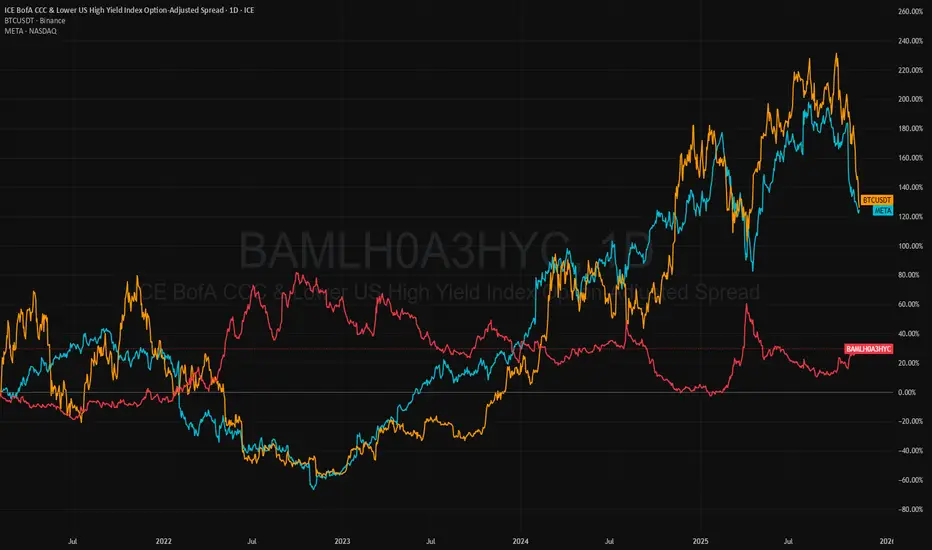
What Connects the Nasdaq and Bitcoin? A Practical Macro ExplanatHave you ever overlapped the charts of Bitcoin and tech stocks like Meta (META)? The similarity in their movements is striking. On one side, a decentralized, volatile cryptocurrency; on the other, a giant of the corporate tech world. What makes them move in sync?
The short answer is they are both highly sensitive "risk-on" assets. Their correlation is not a coincidence, but a direct symptom of how cheap money and risk appetite drive the markets.
The Two Pillars Moving Tech Stocks and Bitcoin
1. The Liquidity Tap: Fed Monetary Policy
When the Fed cuts interest rates or injects liquidity, the message is clear: money is cheap and abundant. This is rocket fuel for risk assets.
Tech Stocks (e.g., META): As growth stocks, their value is based on future earnings, which are discounted by interest rates. Lower rates make those future profits more valuable today.
Bitcoin: As a non-yielding, speculative asset, it thrives when investors, hungry for returns, move away from low-yielding bonds and savings.
The same wind that fills the sails of tech stocks also pushes the Bitcoin boat.
2. The Fear Gauge: Credit Spread (The Cost of Money)
A powerful but less-known indicator is the Option-Adjusted Spread (OAS) on high-yield "junk" bonds (e.g., tracked by the BAMLH0A3HYC index). This spread is a market "fear gauge."
Spread Narrowing: Indicates confidence and a green light for "risk-on." Both tech stocks and BTC tend to rise.
Spread Widening: Signals stress and a "flight to safety." This simultaneously punishes both META and BTC.
The Transmission Mechanism: A wider spread increases borrowing costs for companies and dampens growth expectations, hurting profit projections for tech. Simultaneously, stress in the much larger bond market drains systemic liquidity, negatively impacting all speculative assets—a category Bitcoin perfectly fits.
The 4-Year Cycle Coincidence: BTC Halving vs. Economic Cycle
This brings us to the cornerstone Bitcoin narrative: the halving, which occurs every four years and is often credited for bull markets.
But what if we compare it to the cycles of the Nasdaq?
The timing alignment is, at the very least, suspicious. Is Bitcoin's 4-year cycle a unique, independent force? Or has it simply aligned perfectly with the global cycles of liquidity and risk appetite?
The hypothesis is provocative for BTC purists: perhaps the halving is more of a narrative catalyst within a larger economic cycle, not its primary cause. The reduction in new BTC supply finds fertile ground precisely when global liquidity is high and the hunger for risk is strong.
Conclusion: Correlation is Not Causation, But...
The famous phrase holds true, but with a key addition. The correlation between Nasdaq and BTC isn't direct causation—one doesn't make the other rise or fall. However, they are both effects of the same cause: global macroeconomic conditions.
They are two passengers on the same "Risk-On" boat. When the sea is calm and the wind of liquidity blows favorably, they sail to new heights. When the storm of fear and monetary tightening approaches, both are hit by the same waves.
As for the 4-year cycle, the question remains: did Satoshi Nakamoto foresee economic cycles and sync the halving to them? Or did we, seeing a convenient coincidence, build a cause-and-effect narrative where only a perfect correlation exists?
The truth likely lies somewhere in the middle. And understanding these macroeconomic mechanisms is key to not being fooled by a simple line on a chart.
NASDAQ:META BINANCE:BTCUSD Education 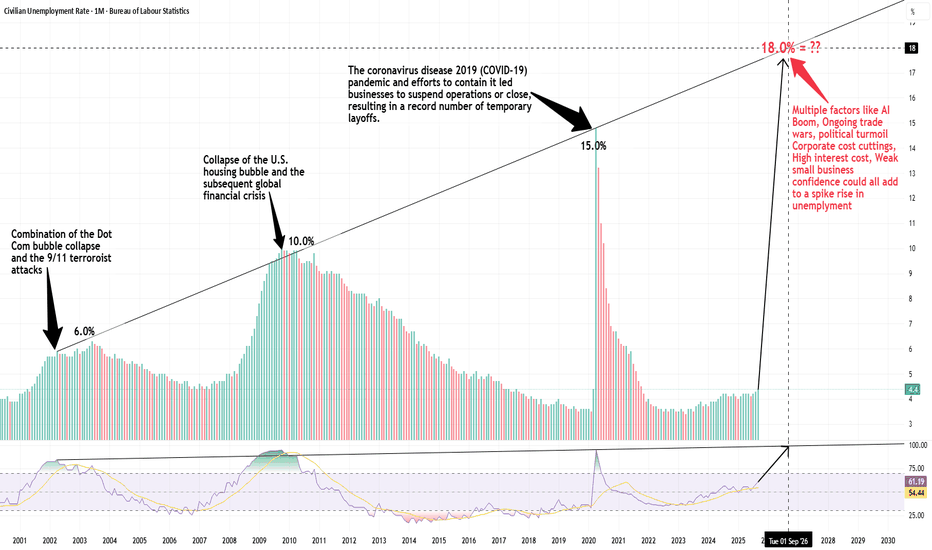
Short 
$JPIRYY -Japan CPI (October/2025)ECONOMICS:JPIRYY 3%
October/2025 (+0.1%)
source: Ministry of Internal Affairs & Communications
-Japan’s annual inflation rate edged up to 3.0% in October 2025 from 2.9% in September,
marking the highest reading since July.
Electricity cost rose the most in four months following the expiry of government subsidies (3.5% vs 3.2% in September),
even as gas prices slowed (0.7% vs 1.6%).
Price growth also persisted for housing (0.9% vs 1.0%), clothing (2.5% vs 2.5%), transport (3.6% vs 3.0%), household items (1.8% vs 1.0%), healthcare (0.8% vs 1.2%), recreation (2.6% vs 2.0%), communications (7.5% vs 6.7%), and miscellaneous goods (0.7% vs 0.7%), while education costs fell further (-5.6% vs -5.6%).
On the food side, prices rose 6.4% yoy, marking the softest gain since December 2024, largely due to the smallest rise in rice prices in 14 months (40.2%) amid Tokyo’s continued efforts to curb staple food costs.
Core inflation also came in at 3.0%, matching forecasts and pointing to the highest in three months.
Monthly, the CPI rose 0.4%, recording the highest level since January. Deposits All Commercial Banks & US DebtWhen a politician and their buddy start spouting nonsense about the US debt spiraling out of control, but then insist that tax cuts are great because they’ll create jobs, and all that money will somehow trickle down to the rest of us, magically boosting tax revenue to "make up" for the lost funds.
Especially when that same politician was re-elected bc inflation & the economy were just so horrible, promising he would come in and save the day bringing prices down again with more tax cuts because they worked so great the first time around.
That's the extreme right. What about the extreme left #MMT?
#MMT is just as bad as MAGAs! They will tell you deficits are great! Deficits add to our savings! Deficits make us all richer! It's accounting, they say! it has to be that way! Except for the little fact that it's not based on empirical evidence.
So the next time some B.S. Artist tells you their little version of a fictional money story, you will know what reality is since 2018. You will have seen this chart with your own eyes and cannot unsee it! No matter what you do, no matter what side you lean politically, it's irrelevant.
Public debt since the tax cuts have grown exponentially, while the private sector deposits have lagged to the point they have stagnated completely since 2021. Barely rising 6%.
Defunding CIA, FBI, USAID, Dept of Education etc.. will do absolutely nothing to make up for all the lost tax revenue since 2018 and the next tax cuts to follow. In fact, when we enter a recession, the deficits will explode even higher as tax revenues collapse and social and economic stabilizers (if there are any left) kick in. Then what?
Don't shoot the messenger! Long 
Jobless Market boom!📉 Job Openings Are Nowhere Near Where They Should Be — and QQQ Is Laughing in Their Face
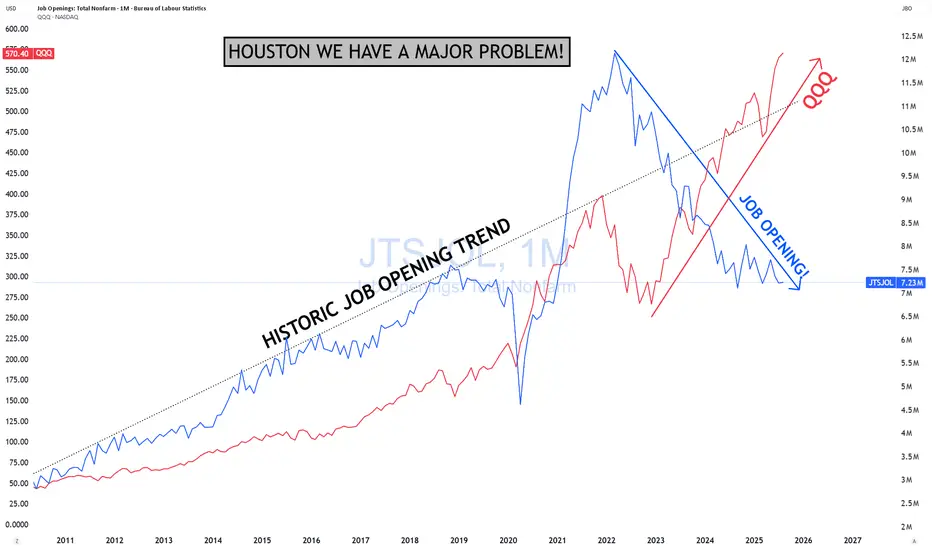
If you map the post-GFC job-growth trend from the 2009 bottom, we should be sitting at **11 million job openings** today. Even if you throw out the 2022 spike as a COVID distortion, we’re still at **just 7 million**.
That’s a **massive shortfall** — and nowhere close to a healthy labor market.
Meanwhile, QQQ has historically **tracked** job openings…
but this time it’s **completely detached** and gone **vertical** instead.
You can argue feelings, vibes, narratives, bar-stool opinions — but the **data** is screaming one thing:
**We are in a bubble.** Like it or not.
I can only show you the evidence. What you choose to do with it is your business.
But here’s my advice, blunt and simple: GTFO and STFO No Matter where prices go! . Nobody is forcing you to play hero at the top of a cycle, trying to cosplay Warren Buffett for a week.
Most of you are under 40.
Meaning you were maybe 20–23 years old during the last real recession and bear market.
You have *no idea* how fast you can lose money when the trend truly dies.
You’ve spent 17 straight years being trained to “Buy The Dip,”
as if markets only go one direction — up.
That’s not your fault…
But you’re about to learn what a real cycle feels like.
And it’ll be **sooner, not later.**
When the cracks appear, you’ll start doubling down…
rotating into new “opportunities”…
trying to pick bottoms…
revenge trading…
chasing cute stories…
Repeating the same lines every bull market teaches:
“Money on the sidelines,”
“This is the bottom.”
“It’s oversold,”
“Time to load up,”
“You have to be in for the bad to enjoy the good.”
All of it is designed to **soften your fear** and **trigger your greed** right before the trapdoor opens.
Stay sharp. The data doesn’t lie — people do.
Sorry, but it has to be said by somebody!
THANK YOU for getting me to 5,000 followers! 🙏🔥
Let’s keep climbing.
If you enjoy the work:
👉 Boost
👉 Follow
👉 Drop a solid comment
Let’s push it to 6,000 and keep building a community grounded in truth, not hype. Short