$EUIRYY - E.U CPI (December/2025) ECONOMICS:EUIRYY
December/2025
source: EUROSTAT
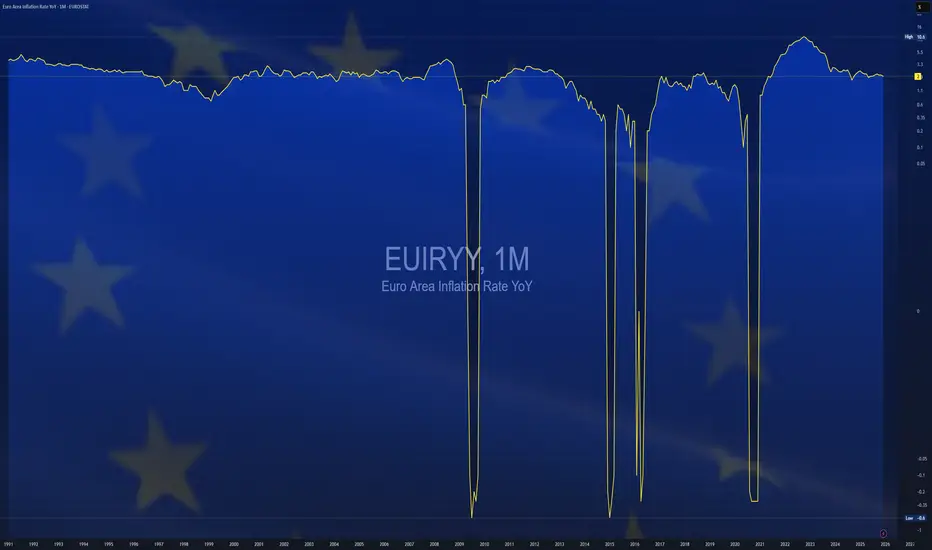
- Euro area consumer price inflation eased to 2.0% in December 2025, down from 2.1% in November, according to a preliminary estimate.
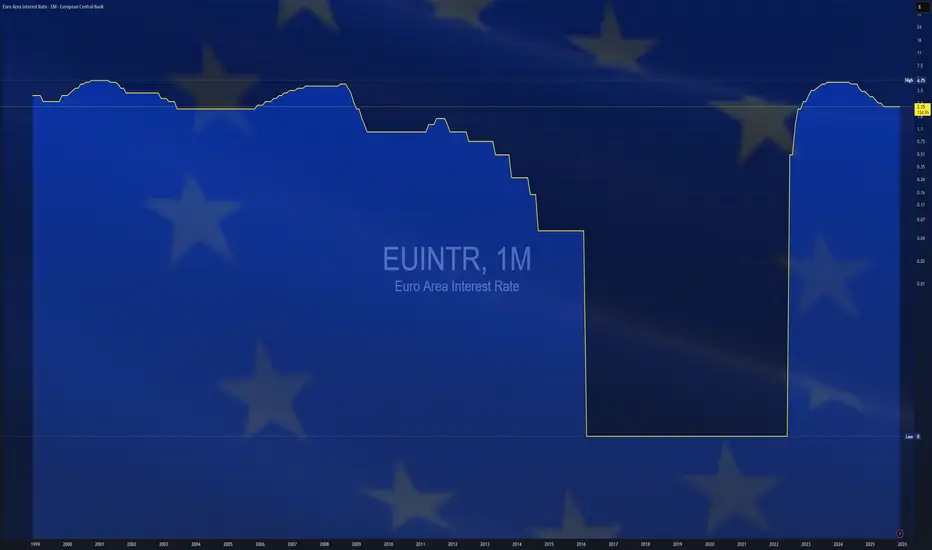
This marks the lowest rate since August, returning to the ECB’s midpoint target and reinforcing expectations that interest rates are likely to remain steady for the foreseeable future.
Core inflation, which excludes energy, food, alcohol, and tobacco, fell to 2.3%, the lowest in four months and just below expectations of 2.4%.
Among Europe’s largest economies, HICP rates eased in Germany (2.0% vs. 2.6%),
France (0.7% vs. 0.8%), and Spain (3.0% vs. 3.2%), while Italy bucked the trend with harmonized inflation rising slightly to 1.2% from 1.1%.  Short
Short
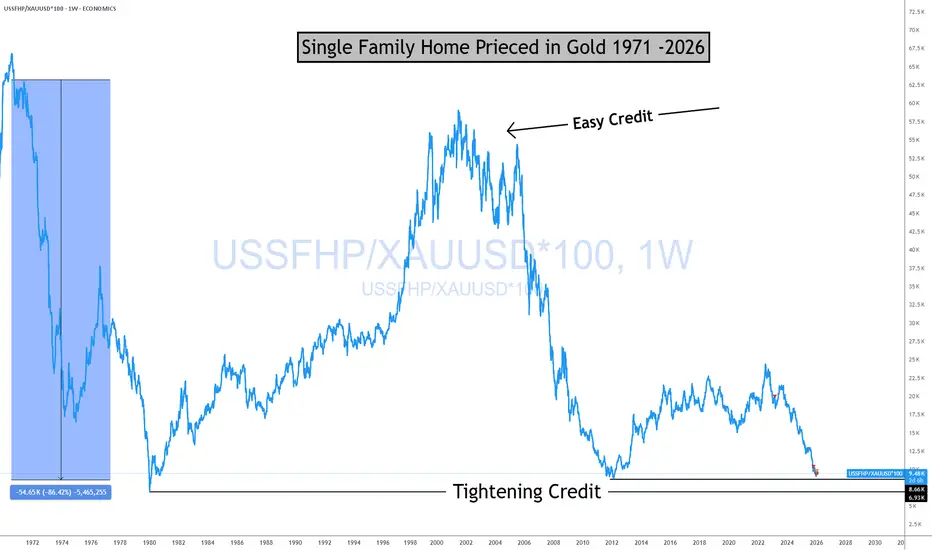
Single-Family Home Prices Priced in Gold (1971–2026)📊 Single-Family Home Prices Priced in Gold (1971–2026)
This chart shows the price of a U.S. single-family home measured in ounces of gold, not dollars, going back to the early 1970s.
Why this matters:
Tight Credit is not good for markets! Bad JUJU!
Gold acts as a long-term monetary benchmark. Pricing homes in gold strips out currency effects and helps reveal real cycles, not nominal noise. It gives us insight into how the market is looking at credit going forward.
🔎 What the chart shows (facts)
Home prices in gold move in long, multi-decade cycles
Peaks tend to occur during periods of:
easy credit
suppressed interest rates
strong belief in “housing always goes up”
Troughs tend to follow:
monetary tightening
credit contraction
stress resets in the financial system
Historically, these cycles are not random and not short-term.
Bottom line
This chart is about relative value, monetary regimes, and long-term structure.
For new traders:
Learn to separate nominal prices from real purchasing power, "VALUE" and you’ll start seeing markets more clearly.
Structure first. Emotion later.
The home didn't change
The Currency did.
I strongly encourage traders and investors to understand the operational mechanics of the monetary system. There is a meaningful distinction between money and currency, and this chart highlights that difference clearly.
Understanding that distinction changes how you interpret cycles, value, and risk.
If you enjoy the work:
👉 Drop a solid comment
Let’s push it to 6,000 and keep building a community grounded in raw truth, not hype. UK Unemployment through the lens of an Elliot Wave ChartistThought I would look at the data available here for UK Unemployment in the same way I would a chart for a stock accepting it is far from complete dataset.
Looks to me like a big 38-year A,B,C down trend in the form of a two a,b,c moves down and one countertrend 1,2,3,4,5.
Assuming thie figure continues to rise and breaks higher past (b) at 5.31% then I'd suggest it is going way, way higher .... to at least the 1.618 Extension level at 17.35%
That's a huge move but given the current UK economic malaise, the incompetence of the current government and the looming impact of AI then it seems entirely credible figure.
$USGDPQQ - U.S GDP (Q3/2025)ECONOMICS:USGDPQQ 4.3%
Q3/2025
source: U.S. Bureau of Economic Analysis
- The GDP in the U.S advanced an annualized 4.3% in Q3 2025, the most in two years compared to 3.8% in Q2, and forecasts of 3.3%, the delayed estimate showed.
The growth mainly reflected increases in consumer spending, exports, and government spending.
Consumer spending rose 3.5%, the most so far this year (vs 2.5% in Q2), led by both goods (3.1% vs 2.2%) and services (3.7% vs 2.6%), mostly health care, international travel, information processing equipment and prescription drugs.
Fixed investment continued to rise although at a slower pace (1% vs 4.4%), supported by equipment (5.4% vs 8.5%) and intellectual property products (5.4% vs 15%) while investment in structures (-6.3% vs -7.5%) and residential (-5.1% vs -5.1%) continued to decline.
Also, exports rebounded sharply (8.8% vs -1.8%) due to capital and nondurable goods and imports declined further (-4.7% vs -29.3%).
Government spending recovered (2.2% vs -0.1%) and the drag from private inventories was smaller (-0.22 pp vs -3.44 pp). $USGDPQQ - U.S GDP (Q2/2025)ECONOMICS:USGDPQQ 3.8%
Q2/2025
source: U.S. Bureau of Economic Analysis
- U.S Economy expanded an annualized 3.8% in Q2 2025,
much higher than 3.3% in the second estimate,
marking the strongest performance since Q3 2023.
The stronger-than-anticipated figure primarily reflected an upward revision to consumer spending.
PCE rose 2.5% (vs 1.6% in the second estimate), led by a bigger revision for services (2.6% vs 1.2%) while spending on goods remained robust (2.2% vs 2.4%).
Fixed investment was also revised higher (4.4% vs 3.3% in the second estimate), including equipment (8.5% vs 7.4%), intellectual property products (15% vs 12.8%) and structures (-7.5% vs -8.9%).
Residential investment however, fell more (-5.1% vs -4.7%).
Also, government consumption shrank slightly less (-0.1% vs -0.2%).
On the other hand, the contribution from net trade was revised lower, as exports declined at a faster pace (-1.8% vs -1.3%) and imports fell 29.3% (vs -29.8%). In addition, the drag from private inventories worsened (-3.44 pp vs -3.29 pp). DOUBLE NFP REPORT this Tuesday, December 16This Tuesday, December 16, the United States will exceptionally publish two NFP reports simultaneously — those for October and November — due to the delay caused by the recent federal shutdown. This double publication will be the last major macroeconomic event of the year 2025, and potentially one of the most decisive for the Federal Reserve’s monetary outlook as 2026 approaches.
These figures attract heightened attention because the U.S. unemployment rate is already at 4.4%, a level with heavy implications. This threshold is far from trivial: it corresponds exactly to the alert level the Fed included in its own median scenario for 2026, as shown in the official projections released at the last FOMC. In other words, the U.S. economy has reached today the unemployment rate the Fed expected to be acceptable… one year from now. This quicker-than-anticipated deterioration now makes employment the key factor of the coming months.
Under normal circumstances, a single NFP report is often enough to reorient market expectations. This time, the pressure is multiplied: the double publication will provide a two-month panorama of labor-market dynamics, with immediate influence over the timing of the monetary policy decisions in January and March 2026. While inflation has partly normalized but remains uneven across components, the Fed now depends primarily on the labor market to assess whether a monetary easing is warranted.
If both reports show a marked slowdown in net job creation — or even a contraction — the Fed will face a clear risk: a sharper-than-expected labor-market landing, implying a faster reduction of the federal funds rate as early as January, or at least a communication shift toward preventive support for economic activity. A rapid rise in unemployment, while core inflation is not yet fully stabilized, would be both politically and macroeconomically difficult to manage.
Conversely, if job creation remains robust — around 120–150k per month — and if the unemployment rate stabilizes or declines slightly, the Fed may maintain a cautious stance, preferring to wait until March before adjusting its policy. In this scenario, the central bank could argue that the 4.4% threshold has not been durably exceeded and that labor-market tensions remain compatible with an orderly disinflation trajectory.
In any case, the December 16 publication will serve as a major pivot for bond markets, rate expectations, and all assets sensitive to the macroeconomic cycle. In summary, it is likely the most decisive indicator of the end of the year, as it will determine whether the Fed’s newly published 2026 scenario remains credible — or requires adjustment.
DISCLAIMER:
This content is intended for individuals who are familiar with financial markets and instruments and is for information purposes only. The presented idea (including market commentary, market data and observations) is not a work product of any research department of Swissquote or its affiliates. This material is intended to highlight market action and does not constitute investment, legal or tax advice. If you are a retail investor or lack experience in trading complex financial products, it is advisable to seek professional advice from licensed advisor before making any financial decisions.
This content is not intended to manipulate the market or encourage any specific financial behavior.
Swissquote makes no representation or warranty as to the quality, completeness, accuracy, comprehensiveness or non-infringement of such content. The views expressed are those of the consultant and are provided for educational purposes only. Any information provided relating to a product or market should not be construed as recommending an investment strategy or transaction. Past performance is not a guarantee of future results.
Swissquote and its employees and representatives shall in no event be held liable for any damages or losses arising directly or indirectly from decisions made on the basis of this content.
The use of any third-party brands or trademarks is for information only and does not imply endorsement by Swissquote, or that the trademark owner has authorised Swissquote to promote its products or services.
Swissquote is the marketing brand for the activities of Swissquote Bank Ltd (Switzerland) regulated by FINMA, Swissquote Capital Markets Limited regulated by CySEC (Cyprus), Swissquote Bank Europe SA (Luxembourg) regulated by the CSSF, Swissquote Ltd (UK) regulated by the FCA, Swissquote Financial Services (Malta) Ltd regulated by the Malta Financial Services Authority, Swissquote MEA Ltd. (UAE) regulated by the Dubai Financial Services Authority, Swissquote Pte Ltd (Singapore) regulated by the Monetary Authority of Singapore, Swissquote Asia Limited (Hong Kong) licensed by the Hong Kong Securities and Futures Commission (SFC) and Swissquote South Africa (Pty) Ltd supervised by the FSCA.
Products and services of Swissquote are only intended for those permitted to receive them under local law.
All investments carry a degree of risk. The risk of loss in trading or holding financial instruments can be substantial. The value of financial instruments, including but not limited to stocks, bonds, cryptocurrencies, and other assets, can fluctuate both upwards and downwards. There is a significant risk of financial loss when buying, selling, holding, staking, or investing in these instruments. SQBE makes no recommendations regarding any specific investment, transaction, or the use of any particular investment strategy.
CFDs are complex instruments and come with a high risk of losing money rapidly due to leverage. The vast majority of retail client accounts suffer capital losses when trading in CFDs. You should consider whether you understand how CFDs work and whether you can afford to take the high risk of losing your money.
Digital Assets are unregulated in most countries and consumer protection rules may not apply. As highly volatile speculative investments, Digital Assets are not suitable for investors without a high-risk tolerance. Make sure you understand each Digital Asset before you trade.
Cryptocurrencies are not considered legal tender in some jurisdictions and are subject to regulatory uncertainties.
The use of Internet-based systems can involve high risks, including, but not limited to, fraud, cyber-attacks, network and communication failures, as well as identity theft and phishing attacks related to crypto-assets.
DISCLAIMER:
This content is intended for individuals who are familiar with financial markets and instruments and is for information purposes only. The presented idea (including market commentary, market data and observations) is not a work product of any research department of Swissquote or its affiliates. This material is intended to highlight market action and does not constitute investment, legal or tax advice. If you are a retail investor or lack experience in trading complex financial products, it is advisable to seek professional advice from licensed advisor before making any financial decisions.
This content is not intended to manipulate the market or encourage any specific financial behavior.
Swissquote makes no representation or warranty as to the quality, completeness, accuracy, comprehensiveness or non-infringement of such content. The views expressed are those of the consultant and are provided for educational purposes only. Any information provided relating to a product or market should not be construed as recommending an investment strategy or transaction. Past performance is not a guarantee of future results.
Swissquote and its employees and representatives shall in no event be held liable for any damages or losses arising directly or indirectly from decisions made on the basis of this content.
The use of any third-party brands or trademarks is for information only and does not imply endorsement by Swissquote, or that the trademark owner has authorised Swissquote to promote its products or services.
Swissquote is the marketing brand for the activities of Swissquote Bank Ltd (Switzerland) regulated by FINMA, Swissquote Capital Markets Limited regulated by CySEC (Cyprus), Swissquote Bank Europe SA (Luxembourg) regulated by the CSSF, Swissquote Ltd (UK) regulated by the FCA, Swissquote Financial Services (Malta) Ltd regulated by the Malta Financial Services Authority, Swissquote MEA Ltd. (UAE) regulated by the Dubai Financial Services Authority, Swissquote Pte Ltd (Singapore) regulated by the Monetary Authority of Singapore, Swissquote Asia Limited (Hong Kong) licensed by the Hong Kong Securities and Futures Commission (SFC) and Swissquote South Africa (Pty) Ltd supervised by the FSCA.
Products and services of Swissquote are only intended for those permitted to receive them under local law.
All investments carry a degree of risk. The risk of loss in trading or holding financial instruments can be substantial. The value of financial instruments, including but not limited to stocks, bonds, cryptocurrencies, and other assets, can fluctuate both upwards and downwards. There is a significant risk of financial loss when buying, selling, holding, staking, or investing in these instruments. SQBE makes no recommendations regarding any specific investment, transaction, or the use of any particular investment strategy.
CFDs are complex instruments and come with a high risk of losing money rapidly due to leverage. The vast majority of retail client accounts suffer capital losses when trading in CFDs. You should consider whether you understand how CFDs work and whether you can afford to take the high risk of losing your money.
Digital Assets are unregulated in most countries and consumer protection rules may not apply. As highly volatile speculative investments, Digital Assets are not suitable for investors without a high-risk tolerance. Make sure you understand each Digital Asset before you trade.
Cryptocurrencies are not considered legal tender in some jurisdictions and are subject to regulatory uncertainties.
The use of Internet-based systems can involve high risks, including, but not limited to, fraud, cyber-attacks, network and communication failures, as well as identity theft and phishing attacks related to crypto-assets.
Short 
Federal Reserve (Fed) – December 10 Meeting: Shakeout Ahead?The last Fed policy meeting of 2025 takes place this Wednesday, December 10, and market expectations are high. While a cut to the federal funds rate is widely anticipated, the true stakes go far beyond this already-priced move. What will really matter are the signals for 2026: the rate trajectory, updated macroeconomic projections, internal FOMC dynamics, and the future direction of the balance sheet. Here are the key points investors need to watch.
1) The federal funds rate cut: expected, therefore secondary
Derivatives markets almost unanimously expect a 25 bp rate cut. Since this move is already priced in, it will only have a significant impact if the Fed accompanies the decision with a more hawkish tone (“hawkish cut”) or, conversely, hints that the easing cycle could accelerate.
The key will not be the decision itself, but the 2026 rate trajectory reflected in the dot plot.
2) The update of macroeconomic projections will be the dominant fundamental factor
This will be the central element of the meeting. Markets will scrutinize three variables:
• Inflation (PCE & Core PCE): Does the Fed remain confident in bringing PCE inflation back to 2% in 2026 despite tariffs?
• Unemployment: Is the Fed worried about a sharp rise in unemployment over the next two years that could force a faster rate-cutting cycle?
• 2026 policy rates: The 2026 federal funds rate cycle will be crucial. Equity markets require an accommodative trajectory to maintain current valuation levels.
For both equity and bond markets, the dot plot will be the true pivot point for conventional monetary policy.
3) The internal balance of power within the FOMC
The meeting will also give insight into the balance between hawks and doves. After two years of inflationary tensions, Powell’s stance is being challenged by part of the committee, more concerned about labor-market softening and credit contraction signals.
The overall tone of the statement will offer insight into internal dynamics and doctrinal lines that could dominate 2026. Recall that a majority (7 out of 12 votes) is required to approve a rate cut.
4) A “shadow Fed Chair” already in place: Kevin Hassett
With five months left before Jerome Powell’s term ends (May 2026), markets are already anticipating the orientation of the next Fed Chair. Kevin Hassett’s name appears increasingly in analyses, to the point where he is seen as a potential “shadow Fed Chair.”
His more pro-growth stance and flexible approach to balance-sheet tools may influence market reactions, depending on how this transition is perceived. This topic will become central once President Trump officially announces the next Fed Chair.
5) The balance sheet: from the end of QT to a possible technical mini-QE?
Another key decision concerns the balance sheet. The Fed’s Quantitative Tightening officially ended on Monday, December 1, 2025. Will the Fed hint at a technical QE in 2026 to stabilize liquidity and the repo market?
Such a signal would be very positive for risk assets.
This meeting is not merely the one closing 2025: it already opens the monetary cycle of 2026. For markets, everything will hinge on projections, FOMC dynamics, and balance-sheet policy — far more than on the already-anticipated rate cut.
DISCLAIMER:
This content is intended for individuals who are familiar with financial markets and instruments and is for information purposes only. The presented idea (including market commentary, market data and observations) is not a work product of any research department of Swissquote or its affiliates. This material is intended to highlight market action and does not constitute investment, legal or tax advice. If you are a retail investor or lack experience in trading complex financial products, it is advisable to seek professional advice from licensed advisor before making any financial decisions.
This content is not intended to manipulate the market or encourage any specific financial behavior.
Swissquote makes no representation or warranty as to the quality, completeness, accuracy, comprehensiveness or non-infringement of such content. The views expressed are those of the consultant and are provided for educational purposes only. Any information provided relating to a product or market should not be construed as recommending an investment strategy or transaction. Past performance is not a guarantee of future results.
Swissquote and its employees and representatives shall in no event be held liable for any damages or losses arising directly or indirectly from decisions made on the basis of this content.
The use of any third-party brands or trademarks is for information only and does not imply endorsement by Swissquote, or that the trademark owner has authorised Swissquote to promote its products or services.
Swissquote is the marketing brand for the activities of Swissquote Bank Ltd (Switzerland) regulated by FINMA, Swissquote Capital Markets Limited regulated by CySEC (Cyprus), Swissquote Bank Europe SA (Luxembourg) regulated by the CSSF, Swissquote Ltd (UK) regulated by the FCA, Swissquote Financial Services (Malta) Ltd regulated by the Malta Financial Services Authority, Swissquote MEA Ltd. (UAE) regulated by the Dubai Financial Services Authority, Swissquote Pte Ltd (Singapore) regulated by the Monetary Authority of Singapore, Swissquote Asia Limited (Hong Kong) licensed by the Hong Kong Securities and Futures Commission (SFC) and Swissquote South Africa (Pty) Ltd supervised by the FSCA.
Products and services of Swissquote are only intended for those permitted to receive them under local law.
All investments carry a degree of risk. The risk of loss in trading or holding financial instruments can be substantial. The value of financial instruments, including but not limited to stocks, bonds, cryptocurrencies, and other assets, can fluctuate both upwards and downwards. There is a significant risk of financial loss when buying, selling, holding, staking, or investing in these instruments. SQBE makes no recommendations regarding any specific investment, transaction, or the use of any particular investment strategy.
CFDs are complex instruments and come with a high risk of losing money rapidly due to leverage. The vast majority of retail client accounts suffer capital losses when trading in CFDs. You should consider whether you understand how CFDs work and whether you can afford to take the high risk of losing your money.
Digital Assets are unregulated in most countries and consumer protection rules may not apply. As highly volatile speculative investments, Digital Assets are not suitable for investors without a high-risk tolerance. Make sure you understand each Digital Asset before you trade.
Cryptocurrencies are not considered legal tender in some jurisdictions and are subject to regulatory uncertainties.
The use of Internet-based systems can involve high risks, including, but not limited to, fraud, cyber-attacks, network and communication failures, as well as identity theft and phishing attacks related to crypto-assets.
Education 
Short