$JPIRYY -Japan CPI (September/2025)ECONOMICS:JPIRYY
September/2025
source: Ministry of Internal Affairs & Communications
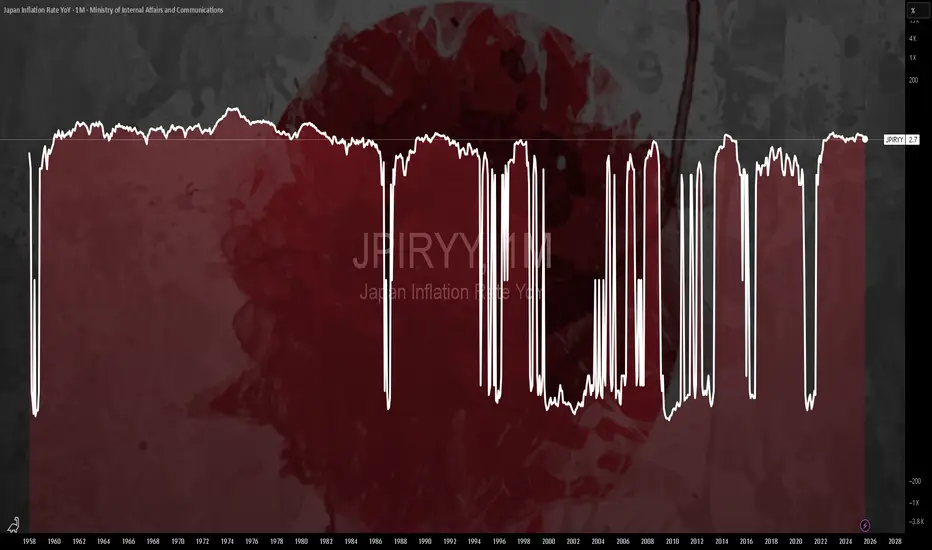
- Japan’s annual inflation rate rose to 2.9% in September 2025 from August’s 10-month low of 2.7%.
The increase was driven by the first rise in electricity prices in three months (3.2% vs -7.2%) and a rebound in gas costs (1.6% vs -2.7%), after the expiry of temporary government measures launched to offset summer heat.
Price growth also persisted across most categories, including housing (1.0% vs 1.1%), clothing (2.5% vs 2.9%), transport (3.0% vs 3.0%), household items (1.0% vs 2.0%), healthcare (1.2% vs 1.3%), recreation (2.0% vs 2.3%), communications (6.7% vs 7.0%), and miscellaneous goods (0.7% vs 1.3%), while education costs fell further (-5.6% vs -5.6%).
On the food side, prices increased 6.7% yoy, easing from a 7.2% rise in August and marking the softest gain in four months, largely due to the smallest rise in rice prices in a year (49.2%) amid Tokyo’s continued efforts to contain staple food costs.
Core inflation came in at 2.9%, matching consensus and rising from the prior 2.7%. $CNGDPYY - China GDP (Q3/2025)ECONOMICS:CNGDPYY
Q3/2025
source: National Bureau of Statistics of China
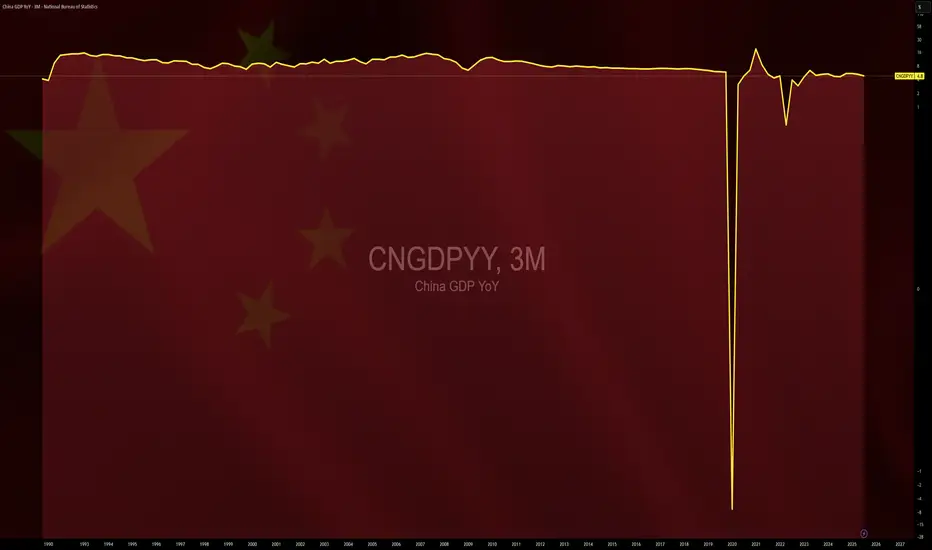
- China’s economy expanded 4.8% year-on-year in Q3 2025, down from 5.2% in Q2,
marking its slowest pace since Q3 2024.
While in line with market expectations,
the GDP growth has lost momentum after a strong start to the year, pressured by U.S. trade tensions, a prolonged property slump, and soft consumer demand.
September data showed retail sales in China rose at their slowest pace in a year despite ongoing consumer subsidy programs, while the jobless rate edged down but remained near August’s six-month high.
Industrial output, however, grew at its fastest pace in three months ahead of Golden Week.
On the trade front, exports and imports beat forecasts as firms pushed into new markets and domestic demand was boosted by holiday spending.
China’s statistics bureau cautioned that risks and external headwinds persist, with the recovery’s foundation still fragile.
Still, it said that 5.2% growth in the first nine months lays a “solid foundation” for meeting a full-year target of around 5%. $CNIRYY -China CPI (September/2025)ECONOMICS:CNIRYY
September/2025
source: National Bureau of Statistics of China
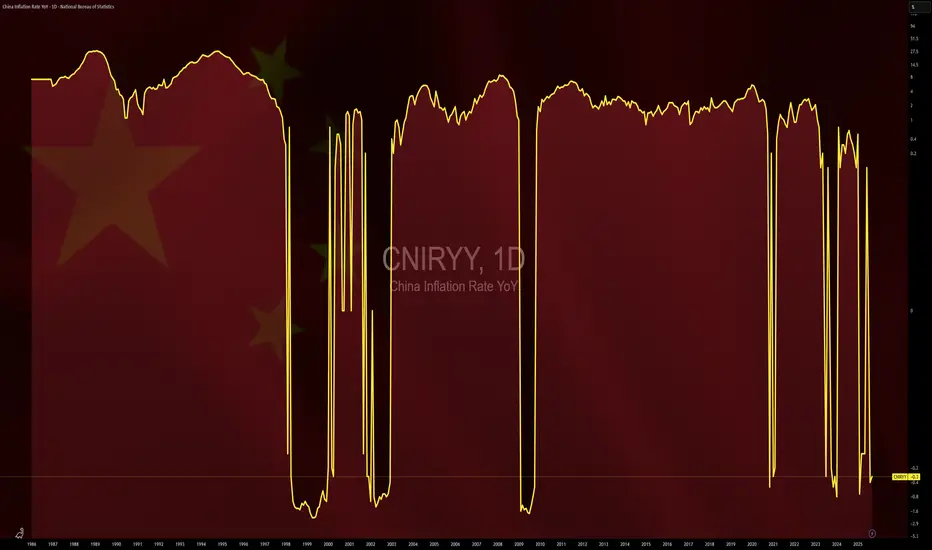
- China’s consumer prices dropped 0.3% yoy in September 2025,
steeper than market estimates of a 0.1% decline but slightly less than
a 0.4% fall in the previous month.
Food prices declined further (-4.4% vs -4.3% in August), recording the strongest contraction since January 2024, amid broad-based falls across categories, with pork prices down further due to abundant supply ahead of the Golden Week holidays,
lower production costs, and weak demand.
In contrast, non-food inflation quickened (0.7% vs 0.5%), supported by ongoing consumer trade-in schemes to bolster consumer demand, with more increases in housing (0.1% vs 0.1%), clothing (1.7% vs 1.8%), healthcare (1.1% vs 0.9%), and education (0.8% vs 1.0%).
Meanwhile, transport costs fell at a slower pace (-2.0% vs -2.4%).
Core inflation, which excludes food and energy, rose 1.0% yoy, the highest in 19 months, after August's 0.9% gain.
On a monthly basis, the CPI inched up 0.1%, missing forecasts of 0.2% after remaining flat in August.  Short
Short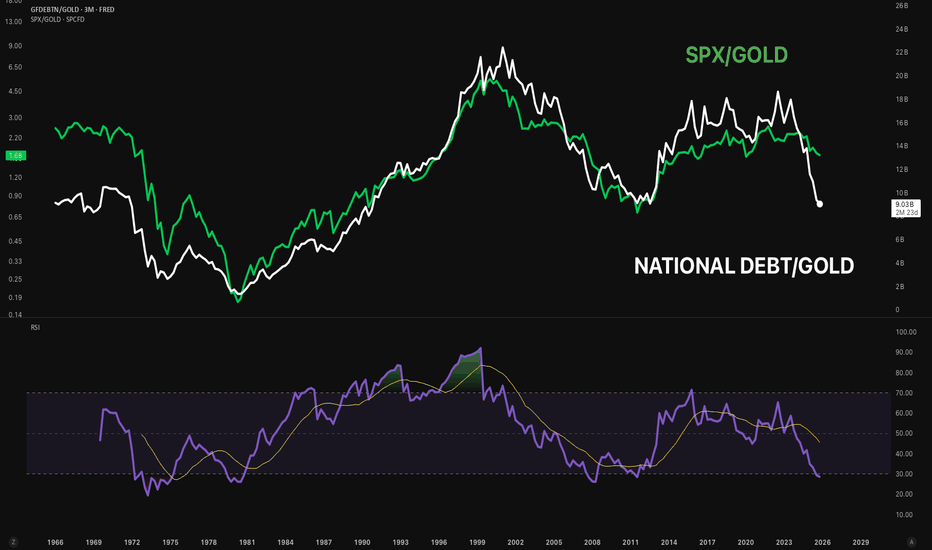
$EUIRYY - Europe CPI (September/2025)ECONOMICS:EUIRYY
September/2025
source: EUROSTAT
- Euro area consumer price inflation rose to 2.2% in September 2025,
up from 2.0% in the previous three months, moving slightly above the European Central Bank’s 2.0% mid-point target, according to preliminary data.
The increase was driven mainly by a smaller decline in energy costs, which fell just 0.4% compared with a 2.0% drop in August.
Services inflation edged up to 3.2% from 3.1%, while prices for food, alcohol and tobacco rose at a slower 3.0% versus 3.2% previously, reflecting weaker unprocessed food inflation.
Non-energy industrial goods inflation remained unchanged at 0.8%. Meanwhile, core inflation—which excludes energy, food, alcohol, and tobacco—was stable at 2.3%, holding at its lowest level since January 2022. Shutdown: Is Friday’s October 3 NFP Report at Risk?The shutdown that began on October 1 in the United States could disrupt the release of key economic data. The highly anticipated jobs report (NFP), scheduled for October 3, may be suspended or delayed if the federal government remains closed. This uncertainty could weigh on financial markets already seeking clarity.
The fourth trading quarter began this week, and investors are projecting October’s trend as the S&P 500 delivered a solid bullish performance in Q3. First-tier fundamentals are driving the major market moves, particularly those affecting the Federal Reserve’s monetary policy outlook.
As every first Friday of the month, the US labor market report (NFP) is scheduled for this week, Friday, October 3. This macroeconomic figure is the dominant fundamental driver of the week. Let’s recall that the Fed cut the federal funds rate in September as the US economy created almost no jobs in the past five months.
1. The US labor market has been slowing significantly since the beginning of the year, with the Fed’s alert threshold set at 4.5% unemployment
The main chart (top of page) shows the US unemployment rate, which is trending higher. In its latest macroeconomic projections, the Fed indicated that its unemployment “alert level” is 4.5% of the labor force.
Friday’s NFP (October 3) will update this unemployment rate, currently at 4.3%. Any uptick would significantly increase the probability of a jumbo Fed cut at the October 29 monetary policy meeting.
The charts below (source: Bloomberg) illustrate the gradual deterioration of the US labor market:
2. At this stage and before the NFP, the probability of a jumbo Fed cut on Wednesday, October 29 is minimal
A jumbo Fed cut means lowering the federal funds rate by 50 basis points (0.50%). Only further deterioration in the labor market revealed in the October 3 NFP report could raise the probability of such a scenario.
The table below, from the CME Fed Watch Tool, shows the implied probability of Fed action at its upcoming policy meetings:
DISCLAIMER:
This content is intended for individuals who are familiar with financial markets and instruments and is for information purposes only. The presented idea (including market commentary, market data and observations) is not a work product of any research department of Swissquote or its affiliates. This material is intended to highlight market action and does not constitute investment, legal or tax advice. If you are a retail investor or lack experience in trading complex financial products, it is advisable to seek professional advice from licensed advisor before making any financial decisions.
This content is not intended to manipulate the market or encourage any specific financial behavior.
Swissquote makes no representation or warranty as to the quality, completeness, accuracy, comprehensiveness or non-infringement of such content. The views expressed are those of the consultant and are provided for educational purposes only. Any information provided relating to a product or market should not be construed as recommending an investment strategy or transaction. Past performance is not a guarantee of future results.
Swissquote and its employees and representatives shall in no event be held liable for any damages or losses arising directly or indirectly from decisions made on the basis of this content.
The use of any third-party brands or trademarks is for information only and does not imply endorsement by Swissquote, or that the trademark owner has authorised Swissquote to promote its products or services.
Swissquote is the marketing brand for the activities of Swissquote Bank Ltd (Switzerland) regulated by FINMA, Swissquote Capital Markets Limited regulated by CySEC (Cyprus), Swissquote Bank Europe SA (Luxembourg) regulated by the CSSF, Swissquote Ltd (UK) regulated by the FCA, Swissquote Financial Services (Malta) Ltd regulated by the Malta Financial Services Authority, Swissquote MEA Ltd. (UAE) regulated by the Dubai Financial Services Authority, Swissquote Pte Ltd (Singapore) regulated by the Monetary Authority of Singapore, Swissquote Asia Limited (Hong Kong) licensed by the Hong Kong Securities and Futures Commission (SFC) and Swissquote South Africa (Pty) Ltd supervised by the FSCA.
Products and services of Swissquote are only intended for those permitted to receive them under local law.
All investments carry a degree of risk. The risk of loss in trading or holding financial instruments can be substantial. The value of financial instruments, including but not limited to stocks, bonds, cryptocurrencies, and other assets, can fluctuate both upwards and downwards. There is a significant risk of financial loss when buying, selling, holding, staking, or investing in these instruments. SQBE makes no recommendations regarding any specific investment, transaction, or the use of any particular investment strategy.
CFDs are complex instruments and come with a high risk of losing money rapidly due to leverage. The vast majority of retail client accounts suffer capital losses when trading in CFDs. You should consider whether you understand how CFDs work and whether you can afford to take the high risk of losing your money.
Digital Assets are unregulated in most countries and consumer protection rules may not apply. As highly volatile speculative investments, Digital Assets are not suitable for investors without a high-risk tolerance. Make sure you understand each Digital Asset before you trade.
Cryptocurrencies are not considered legal tender in some jurisdictions and are subject to regulatory uncertainties.
The use of Internet-based systems can involve high risks, including, but not limited to, fraud, cyber-attacks, network and communication failures, as well as identity theft and phishing attacks related to crypto-assets.
Long 
Long 
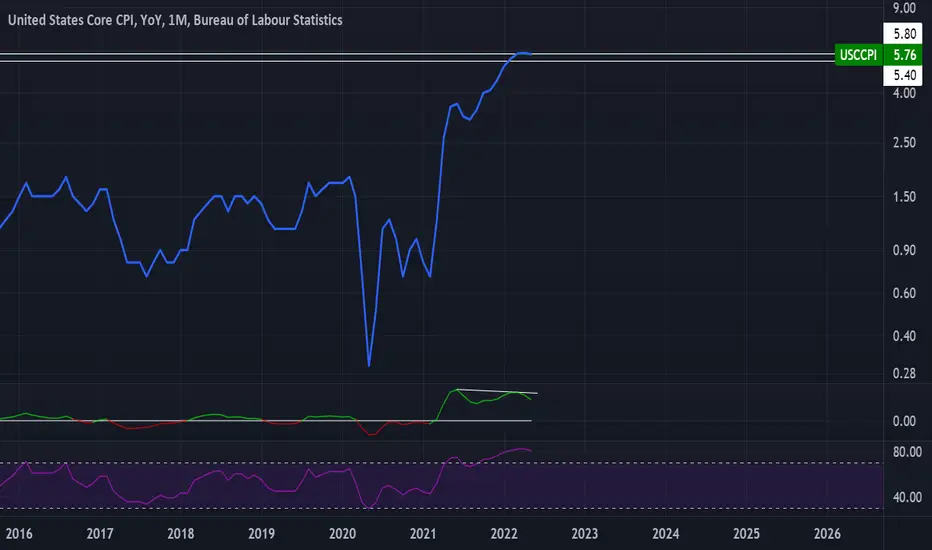
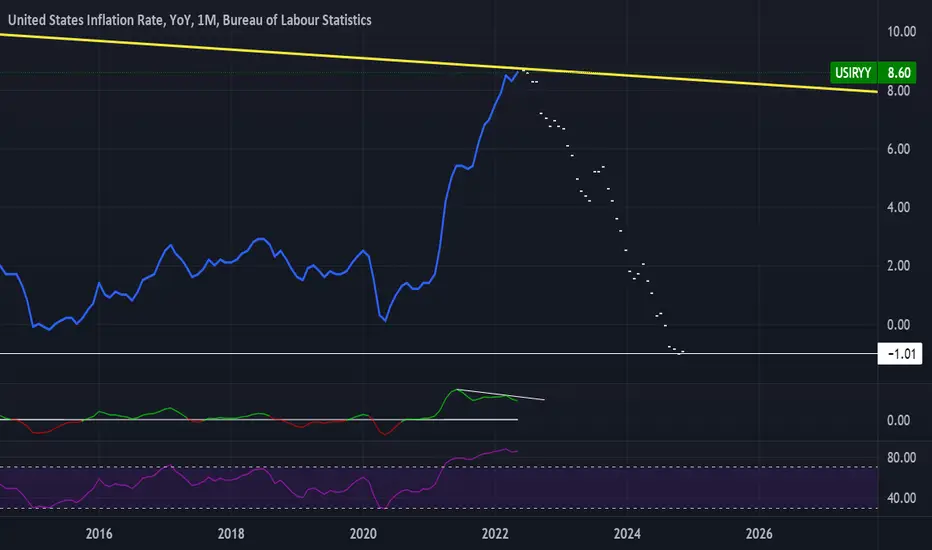
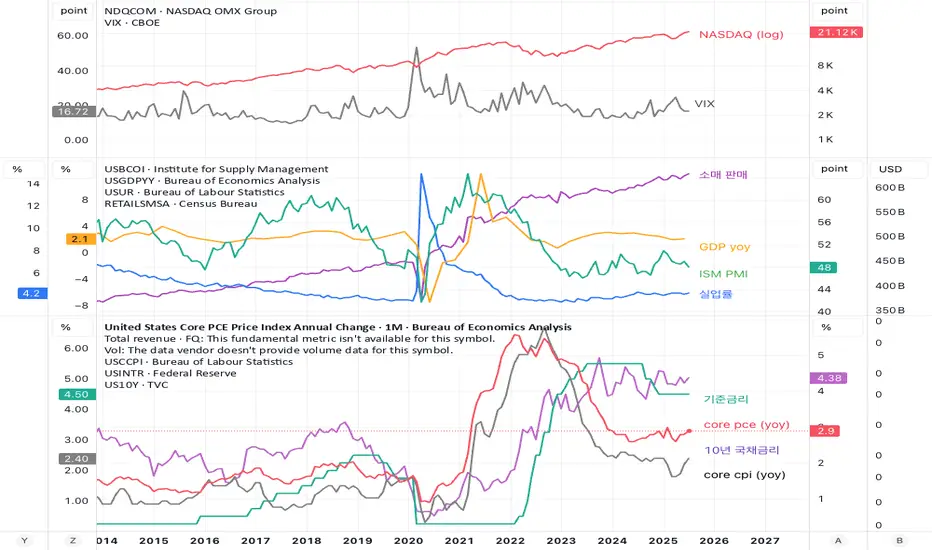
Macro Dashboard: Growth, Inflation, and Market SentimentThis set of three charts provides a concise overview of the U.S. macroeconomic landscape, grouped into three key categories:
Market Sentiment
NASDAQ, VIX
Captures risk appetite and volatility in equity markets. NASDAQ reflects growth and tech-sector momentum, while VIX indicates fear and uncertainty.
Economic Activity
Retail Sales, GDP YoY, ISM PMI, Unemployment Rate
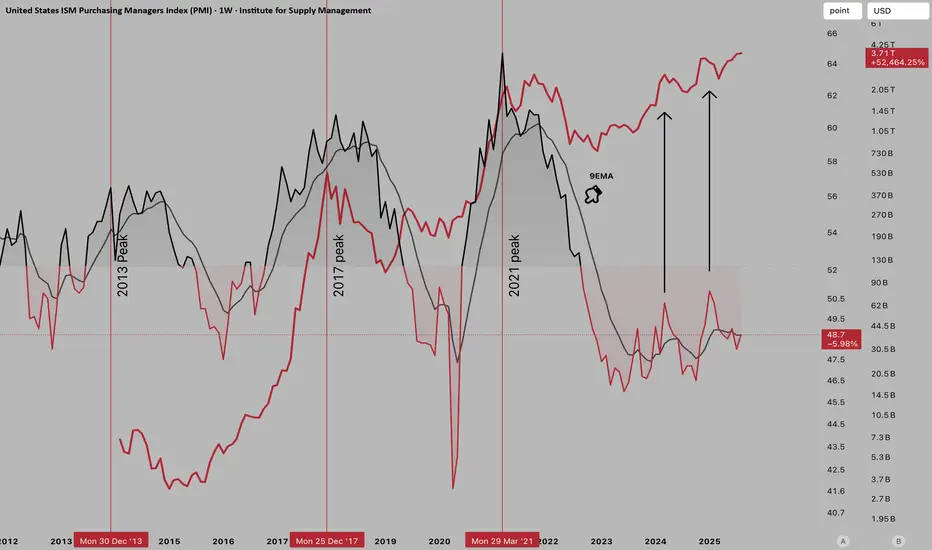
Tracks the pulse of the real economy. Retail sales and ISM PMI show consumer and business activity, GDP YoY highlights overall growth, and unemployment measures labor market strength.
Monetary Policy & Inflation
Fed Funds Rate, Core PCE YoY, Core CPI YoY, 10Y Treasury Yield
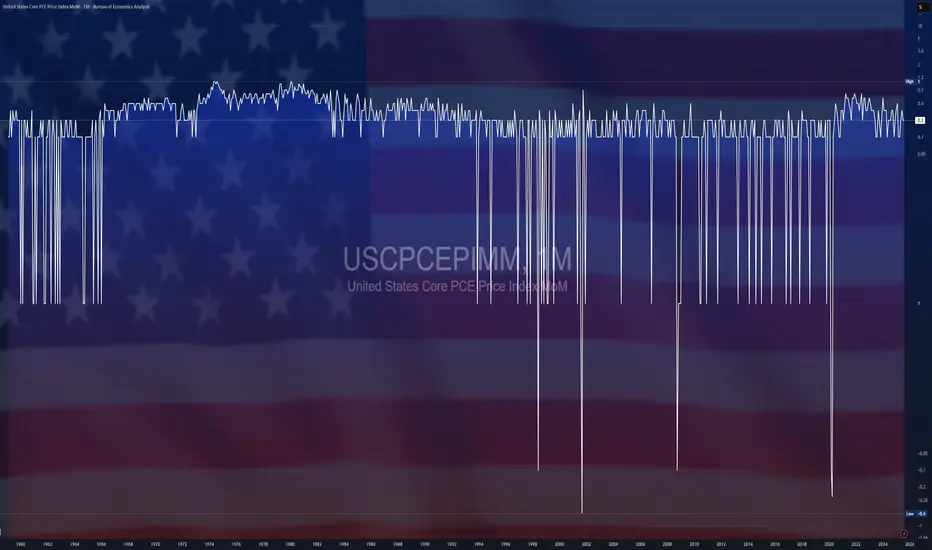
Monitors the Federal Reserve’s policy stance and inflation dynamics. Core PCE and Core CPI are key inflation measures, while the 10-year yield reflects market expectations for growth and policy.
Together, these charts help visualize how economic fundamentals, inflation, and market sentiment interact — a practical dashboard for understanding U.S. macro conditions and their impact on financial markets. QE and YCC: What does it all mean?ECONOMICS:USCBBS
CBOT:ZB1! CBOT:ZN1! CME_MINI:NQ1!
There is growing market speculation that the Fed may tolerate inflation above 2% for longer, consistent with its Average Inflation Targeting (AIT) framework introduced in 2020.
This also implies that real rates i.e., nominal rates minus inflation are likely to fall significantly. Given this, we anticipate gold to continue trending higher as the U.S. dollar's purchasing power erodes with mounting debt, persistently higher inflation, and falling real yields.
What is QE?
Quantitative Easing (QE) refers to the Fed injecting liquidity into financial markets by purchasing large quantities of assets such as Mortgage-Backed Securities (MBS) and U.S. Treasuries, especially during periods of economic stress like the Global Financial Crisis (2007–2008) and the COVID-19 downturn.
How Does QE Work?
Asset Purchases: The Fed buys large volumes of Treasuries and MBS from financial institutions.
Balance Sheet Expansion: These purchases expand the Fed's balance sheet (now hovering near $6.6 trillion, per FRED).
Increased Liquidity: Banks receive excess reserves in exchange, increasing system-wide liquidity.
Lower Interest Rates: Demand for bonds pushes prices higher and yields lower.
Economic Stimulus: Lower borrowing costs promote credit creation, investment, and consumer spending.
However, a key drawback of QE is asset price inflation. As seen between the GFC and the COVID-19 pandemic, low rates and excess liquidity drove significant appreciation in equities, housing, and other financial assets, even while consumer inflation remained near target.
QE vs. Stimulus Checks
If traditional interest rate policy is Monetary Policy 1 (MP1), then QE is MP2. Stimulus checks, or government handouts, fall under MP, a fusion of monetary and fiscal policy.
While QE primarily injects liquidity into financial institutions, stimulus checks inject purchasing power directly into households. This approach where the Treasury issues debt and the Fed purchases that debt, stimulates demand for real goods and services. We saw this during the post-COVID recovery, which brought a sharp rebound in consumer activity but also a surge in inflation, reaching a peak of 9.1% in June 2022 (CPI YoY).
QE impacts Asset Price Inflation
Stimulus Checks impact Goods & Services Inflation
What is YCC? (Yield Curve Control)
Yield Curve Control (YCC) is a policy whereby the central bank buys government debt across various maturities to control yields not just at the short end (via rates), but across the entire yield curve.
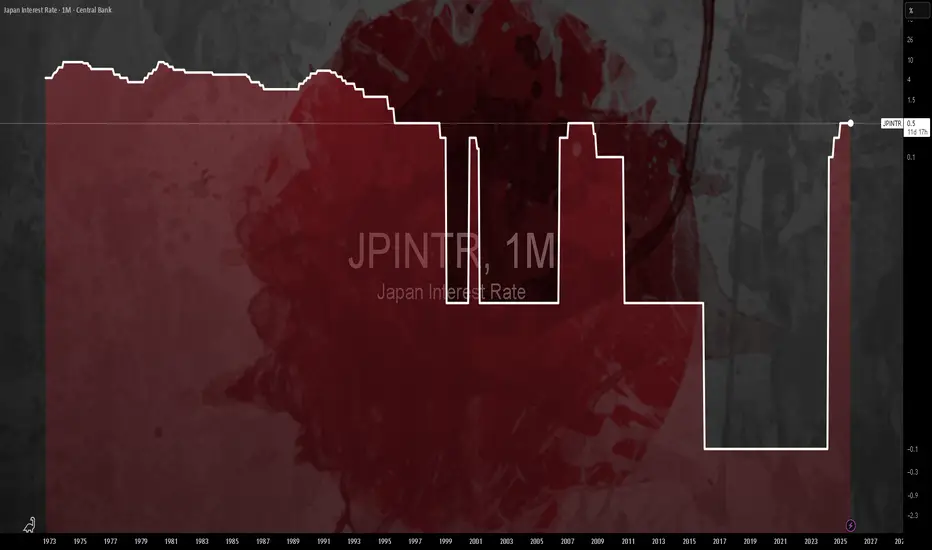
A prime example is the Bank of Japan, which has used YCC since 2016 to anchor 10-year JGB yields near zero. The Fed has not formally adopted YCC, but market participants believe it may lean in that direction in the future especially during crises where long-end rates rise undesirably. Mounting US debt and rising long end yields may prompt the Fed to step in and adopt YCC like BoJ has done previously.
Front-End Control: Managed via policy rates
Long-End Control: Central bank buys 5Y, 10Y, 20Y, 30Y Treasuries to anchor yields
Potential Risks of YCC:
Credibility Risk: If inflation rises while the central bank suppresses yields, it may lose market trust.
Currency Pressure: Artificially low yields may trigger speculative pressure on the currency (as seen with the yen under BoJ YCC).
We’ve kept this concise and digestible for now, but there’s more to unpack—especially on the long-term implications of coordinated monetary-fiscal policy (MP3), debt sustainability, and central bank credibility.
The Fed’s balance sheet chart shows how Fed’s balance sheet has increased:
Aug 1, 2008: $909.98B
Jul 1, 2017: $4.47T
Aug 1, 2019: $3.76T
Feb 1, 2020: $4.16T
Mar 1, 2022: $8.94T
Aug 1, 2025: $6.61T
Note that this is not just a US phenomenon. It is a world wide phenomena looking at many of the developed and emerging markets. The Debt to GDP ratios are increasing, Central Banks balance sheets are rising in tandem with rising government debt.
With the rate cutting cycle starting, it is a matter of time that we also see QE restarting.
If you’d like us to dive deeper into any of these topics in future educational blogs, let us know. We're happy to build on this foundation with more insights.
Short 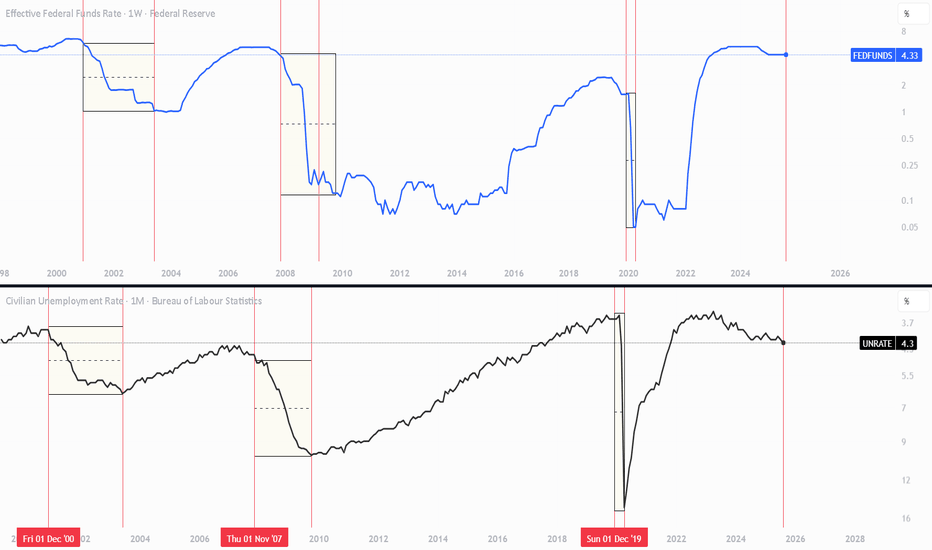
$JPIRYY -Japan Inflation Rate (August/2025)ECONOMICS:JPIRYY
August/2025
source: Ministry of Internal Affairs & Communications
-Japan's annual inflation rate eased to 2.7% in August 2025 from 3.1% in the previous month,
marking the lowest reading since October 2024.
Electricity prices fell much steeper (-7.0% vs -0.7% in July) due to government subsidies, and gas prices dropped (-2.7%) after being flat previously.
Education costs also continued to drop (-5.6% vs -5.6%). Price growth slowed for household items (2.0% vs 2.5%), healthcare (1.3% vs 1.5%), and recreation (2.3% vs 2.6%).
Inflation accelerated for housing (1.1% vs 1.0%), clothing (2.9% vs 2.8%), transport (3.0% vs 2.6%), communications (7.0% vs 6.4%), and miscellaneous goods (1.3% vs 1.2%).
On the food side, prices rose 7.2%, easing from July’s five-month peak of 7.6%, driven by the smallest gain in rice prices in eight months at 69.7%, amid Tokyo’s efforts to curb staple food costs. Core inflation also stood at 2.7%, matching market consensus and reaching a nine-month low.
Monthly, the CPI edged up 0.1%, holding steady for the third straight month.