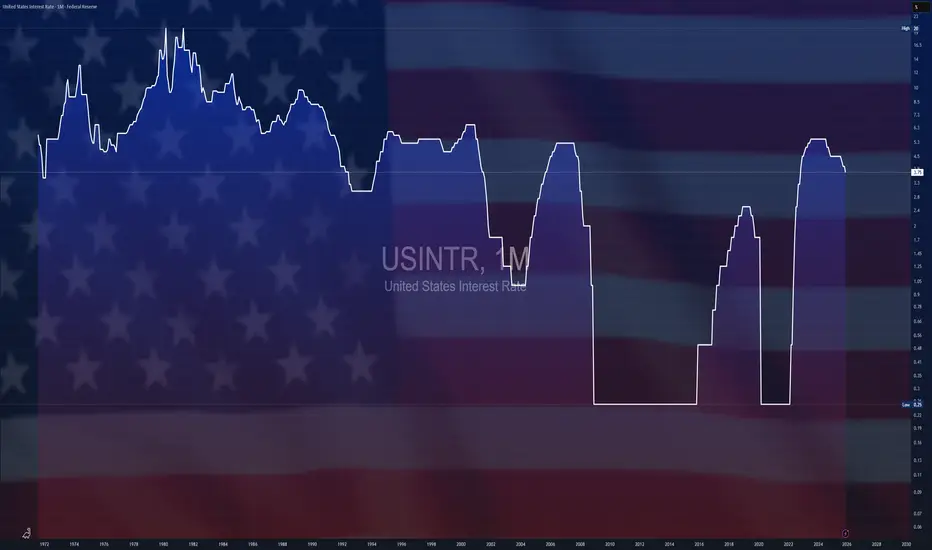
$GBIRYY - U.K CPI (January/2026)ECONOMICS:GBIRYY 3%
January/2026 0.4%
source: Office for National Statistics
- UK consumer price inflation eased to 3.0% in January 2026,
down from 3.4% in December and in line with market expectations.
This marks the lowest annual inflation rate since March 2025, primarily driven by softer increases in transport and food prices.
Transport costs rose by 2.7% year-on-year, slowing from 4.0% in December, as fuel prices fell and air fare inflation moderated.
Meanwhile, food and non-alcoholic beverage prices increased by 3.6%, down from 4.5% the previous month.
Inflation also eased in housing and utilities (4.5% vs. 4.9%) and recreation and culture (2.6% vs. 2.7%). However, price growth in restaurants and hotels accelerated to 4.1%, up from 3.8%.
Core inflation, which excludes more volatile components such as food and energy, declined to 3.1% in January, its lowest level since August 2021, suggesting underlying price pressures are gradually moderating. On a monthly basis, consumer prices fell by 0.5%, reversing a 0.4% increase recorded in December. source: Office for National Statistics The Calm Before the Storm: $16/Gallon Forecast by 2035Greetings to the seekers of signal amidst the noise. To those who prefer the cold clarity of reality over the polished narratives of mainstream forecasts.
While the majority are distracted by Valentine’s Day cards, we are looking at a "valentine" of a completely different scale—one written in crude oil, blood, and gunpowder across the pages of world history.
In the history of "Black Gold," mid-February isn't about romance; it’s about the hard-nosed handshakes that defined the fate of our civilization:
February 14, 1945: Aboard the USS Quincy, FDR and King Ibn Saud signed the blueprint for the modern world. This birthed the "Quincy Pact"—the foundation of the petrodollar system that has underpinned the global financial dominance of the United States for the last 80 years.
February 14, 1971: The Tehran Agreement struck the first blow to this monopoly. It signaled the end of the era where Western oil giants (the "Seven Sisters") dictated prices, shifting the initiative to the exporters of OPEC.
Today, February 14, 2026: We stand at the final decommissioning of these legacy rules. The old paradigm is collapsing; the Quincy Pact has been functionally annulled by history itself. The Strait of Hormuz is becoming the ultimate "bottleneck" through which the global economy must pass—with significant friction and at a heavy cost.
This is not just another market update. It is a Strategic Warning. While "market hype-peddlers" distract the public with fairy tales of a "Green Transition" and "Soft Landings," we will analyze why the world's primary energy source is preparing for a vertical lift-off. This surge will likely reset the savings of millions and force the public onto electric scooters—not out of environmental concern, but out of necessity driven by systemic inflation.
Today, we will break down the current phase using Elliott Wave Theory, identify which energy stocks are still in the "accumulation zone" before they hit the stratosphere, and take a look behind the curtain of global geopolitics where the final pieces are being moved for the endgame.
________________________________________
📈 Technical and Wave Analysis: The Super-Cycle Perspective
Prices are entering the home stretch before a vertical surge, a scenario we have already witnessed in precious metals. While many expected this move sooner, we must remain objective about the asset: the oil market is not just about supply and demand—it is the ultimate expression of global power and strategic monopolies.
To understand the future, we must acknowledge the psychological extremes of the past five years:
⚫️ 2020 (The COVID-19 Shock): A point of total capitulation. Brent TVC:UKOIL crashed to $17, and deliverable WTI futures TVC:USOIL famously committed "historical hara-kiri," dropping into negative territory at -$37 per barrel. The shock of a seller having to pay to get rid of their product was the ultimate "blood in the streets" moment.
⚫️ 2020–2022 (The QE Impulse): Massive monetary expansion and "helicopter money" created a violent inflationary pulse. Prices recovered by +600%, peaking near $135 in the first half of 2022. According to Elliott Wave theory, this entire move from $17 to $135 should be interpreted as Wave 1 of a new global bullish super-cycle.
⚫️ 2022–2026 (The Great Consolidation): For the last four years, the market has been trapped in Wave 2—the phase of disappointment and exhaustion.
Wave A (or W): The sharp correction from $135 down to $70.
Wave B (or X): A grueling two-year sideways grind (range-bound $70–$90) that forced out the last of the retail optimists.
Wave C (or Y): The recent "cleansing" dip toward $60, which served as the final flush before the next major impulse.
________________________________________
📊 The Great American Energy Paradox: Exporting Surplus, Importing Necessity
At first glance, the data seems contradictory: the United States is one of the world’s largest producers and exporters, yet it remains tethered to foreign supply. In 2024, the U.S. exported nearly 4 billion barrels of oil—over half of its total domestic production. This massive outflow of crude and petroleum products underscores America's status as a global energy powerhouse.
The Refinery Mismatch: Why export 55% of your production while continuing to import heavily, particularly from Canada? The answer lies in Quality and Configuration.
The Supply: Most U.S. shale production is "Light, Sweet" Crude (LTO)—low in sulfur and easy to process.
The Infrastructure: However, the massive refinery complexes on the Gulf Coast were engineered decades ago to process "Heavy, Sour" grades—the thick, high-sulfur oil typical of traditional giant fields.
Consequently, the U.S. exports its light surplus to global markets while importing the heavier grades its refineries actually crave. This isn't a failure; it’s a Logistical Optimization.
The Canadian Lifeline: In 2024, 61.7% of U.S. crude imports came from Canada. While South and Central America contribute about 16.3%, the dependency on our northern neighbor is the real story. Since 2013, Canada’s share of U.S. imports has skyrocketed from 33% to over 60%. Despite record domestic production of 13.4 million barrels per day, the U.S. refinery system—and by extension, its economy—is more reliant on Canadian "heavy" barrels than ever before.
________________________________________
⏳ The Current Setup: Accumulation and the "Market Flush" Risk
For the past year, "Black Gold" has been consolidating in a tight, frustrating range between $60 and $70 per barrel. For the retail speculator, this is a "boring" market; for Smart Money, this is a Class-A Accumulation Zone.
🗯 The Core Thesis: "Any price print below $70 should be viewed as an anomalous entry point—a generational 'gift' that will be envied in the years to come."
However, we must address the Tactical Deleveraging Risk. As we look toward a potential 40–50% correction in overextended Tech and Equity indices during 2026, oil will likely be caught in the "Margin Call Crossfire."
When systemic deleveraging begins, large funds sell what is liquid to cover what is losing. We should prepare for a "Flash Flush" toward $50—or lower in a 2020-style panic.
Why the "Flush" is Mathematically Necessary:
Total Capitulation: To wipe out "weak hands" and leveraged bulls who are betting on a bounce too early.
Asset Transfer: To move the final physical barrels from panicked retail hands into institutional vaults and the Strategic Petroleum Reserve (SPR) at bottom-tier prices.
Psychological Warfare: To create a "Death of Oil" narrative in the mainstream media, masking the beginning of the actual vertical impulse.
The Investor’s Playbook: A temporary dip to $50 is not a reason to flee; it is the ultimate opportunity to increase energy exposure. Historically, oil doesn't linger at these forced lows. The moment the Fed reactivates the printing presses to save the collapsing equity indices, and the geopolitical "Hormuz Trigger" is pulled, oil will be the first asset to enter a vertical price discovery phase.
This is where we get into the "Meat and Potatoes" for the Western investor—the actual numbers and the strategic logic that explains why the status quo is a ticking time bomb.
I’ve adapted the tone to be analytical yet urgent, framing the $300 target as a logical outcome of monetary debasement rather than just a "wild guess."
________________________________________
❓ What’s Next? The 2020–2035 Macro Forecast
Once the current "bottoming" structure completes, the market will enter Wave 3. In technical analysis, the third wave is the most powerful, the longest, and the most merciless to short-sellers. It doesn't offer "second chances" on pullbacks; it simply re-prices reality.
Short-term Volatility (2026): If the broader equity markets face a 30-50% deleveraging event, oil could see a sharp -30% "liquidity flush" toward $50. This will be a blink-and-you-miss-it event.
The Near-Term Goal: A return to the triple-digit zone—$100+. This is when the legacy media will start screaming about an "Energy Crisis," but for us, it’s just the beginning.
The Global Target: Long-term projections suggest a range of $300–$500 per barrel by 2030–2033.
While these numbers sound like hyperbole today, remember that Gold at $2,500+ sounded like a hallucination in the early 2000s when it traded at $250. When you factor in the debasement of fiat currencies, the dismantling of global supply chains, and a decade of chronic underinvestment in drilling, these targets aren't just possible—they are a mathematical inevitability.
________________________________________
📊 The "Canadian Shield" and the "Shale Cul-de-Sac"
There is a fundamental misunderstanding of U.S. energy "independence." Let’s look at the hard data:
The Technology Paradox: The U.S. is the #1 producer (21.7 million barrels/day), but it cannot consume its own "menu." American shale is Light Sweet Crude (LTO). However, 70% of the complex refinery capacity in Texas and Louisiana is "hard-wired" to process Heavy Sour (sulfuric) crude.
Canada as the Lifeboat: This is why U.S. imports from Canada have surged to 61.7% (approx. 4 million barrels/day). Canada provides the heavy bitumen that keeps U.S. refineries from seizing up. The U.S. is "addicted" to Canadian heavy barrels.
The Strategic Pivot: OPEC’s share of U.S. imports has cratered to 11.9%. The U.S. is physically separating from the Middle East, but they are still vulnerable to the global price set by OPEC+.
The Venezuelan Logic: Venezuelan crude is the "twin" of Canadian heavy oil and the perfect feed for U.S. refineries. More importantly, it is significantly cheaper to extract than Canadian oil sands.
The "Trump" Realism: Instead of fighting environmental battles over the Keystone XL pipeline from the North, it is strategically more efficient to secure the Venezuelan supply to the South. A short sea route through the Gulf of Mexico is the ultimate insurance policy.
________________________________________
🌡️ The Gasoline Pulse: Breaking the "1–2–4" Paradigm
To gauge where we are going, ignore the tech-heavy Nasdaq and look at the price sign at your local gas station. The FRED:GASREGW (US Regular Gas Price) is the true pulse of the economy, reflecting the real cost of logistics and consumer purchasing power.
The Era of Social Stability (1990–2022): For 35 years, the Western world operated under the "1–2–4 Rule." This range was the "holy grail" of social peace:
The 90s: Post-Cold War dividend. Gas was stable at $1–$1.50.
The 2000s: Emerging market demand shifted the corridor to $2–$4.
The 12-Year Trap (2008–2020): After the 2008 peak ($4), prices spent 12 years in a "Symmetric Triangle." In Wave Theory, this is a compressed spring, coiling energy for a violent release.
In 2020, as the world exited the pandemic shock, the "spring" finally snapped. Price shot through the $4 resistance and hit an all-time high of $5 by the summer of 2022. What the public thinks is a "return to normal" right now is actually a re-test of the breakout. We are sitting on the old $3–$4 ceiling, which has now become the new floor.
________________________________________
🚀 The Transition: Entering the "4–8–16" Reality
What the public mistakes for a "return to normal" is actually a textbook technical move: a prolonged re-test of a broken resistance level. From a macro-technical perspective, the price has simply returned to the midpoint of the old $2–$4 range to establish a massive new support base.
As of early 2026, we’ve seen prices dip toward $2.77/gallon—a nearly 50% retracement from the 2022 all-time highs. To the untrained eye, it looks like the crisis is over. To the analyst, it looks like a spring being coiled.
The 2026–2040 Paradigm: The era of $2.00 gasoline is officially a museum exhibit. We are entering a cycle where price targets are essentially doubling across the board:
The Floor: $4.00 (the old ceiling).
The Median: $8.00.
The Cycle Target: $16.00 per gallon.
This isn't just "price movement"; it is a forced transformation of the American lifestyle. With 80% of U.S. logistics dependent on trucking, $12–$15 gasoline makes traditional internal combustion (ICE) ownership a luxury and turns standard delivery services into "premium" expenses.
This serves as a cynical but effective tool: using an inflationary shock to "reset" the public’s savings and move them toward a digital, electric-based economy—not through incentives, but through the sheer inability to afford the old way of life.
________________________________________
🧮 The Math of the "CP-Lie": Inflation Alchemy
When gasoline prices inevitably surge by +300% toward the $12 mark, it will trigger a chain reaction that no amount of statistical massaging can fully hide:
Direct CPI Contribution: A surge of this magnitude adds an immediate 10–15% to the headline Consumer Price Index.
The Real Number: Combined with baseline inflation, we are looking at CPI prints of +20%—levels associated with war-time economies or hyperinflationary collapses.
The "Statistical Pivot": To prevent a total panic, expect the Bureau of Labor Statistics (BLS) to engage in "methodological adjustments." We will likely see the "weighting" of gasoline in the CPI basket reduced, under the guise that "consumers are driving less," thereby artificially dampening the reported inflation rate.
The objective is clear: create such friction for ICE vehicle owners that the transition to EVs (Tesla and its peers) becomes a survival tactic rather than a choice.
________________________________________
📈 The SPR Trap: Refilling the War Chest
While oil prices are being "marinated" in this lower range, the U.S. administration is executing a classic "buy the dip" strategy. Looking at the US Strategic Petroleum Reserve (SPR) ECONOMICS:USCOSPRE chart, we are seeing the active reconstruction of the nation's energy cushion.
After the previous administration drained the reserves to combat the 2022 price spike, the current leadership has pivoted to aggressive accumulation. Over the last 30 months, reserves have climbed by 70 million barrels (+20%), rising from a critical floor of 354 million to the current 415 million barrels.
The Market Signal: This accumulation creates a massive, artificial floor under the market. As long as "Texas Tea" stays below $80, the U.S. government remains the ultimate "Whale" buyer, preventing a total price collapse. They are racing to restore the strategic buffer before the Semiquincentennial (250th Anniversary of the US) celebrations and the next election cycle are over.
The Warning: The current "discount" at the pump ($2.80/gallon) is a temporary pre-election/pre-celebration gift. Once the SPR tanks are topped off and the political cycle concludes, the accumulated supply deficit will hit the consumer with triple force. The safety valve is being closed—those barrels are now being held for the "Black Swan" of a hot war, leaving the domestic market to face the new $8–$16 paradigm alone.
________________________________________
📊 The Inventory vs. Production Gap: A Glaring Anomaly
When we look at the global energy map, we see a striking contradiction that the mainstream media rarely discusses. It is the contrast between "The Sprint" (U.S. Shale) and "The Marathon" (Conventional Super-Giants).
The Reserves Paradox: Venezuela holds 19.4% of the world’s proven oil reserves (#1 globally), yet its current production is a fraction of its potential due to years of infrastructure decay and sanctions.
The U.S. Mirage: In contrast, the United States—currently the world's #1 producer—controls only 2.9% of global reserves.
This is the definition of a "burn rate" problem. The U.S. is sprinting to maintain its dominance while its underlying "fuel tank" is dangerously low compared to its competitors.
♟️ The Concentration of Power: The New Geopolitical Axis
The "Big Three"—Venezuela, Saudi Arabia, and Iran—collectively control nearly 50% of the planet's oil. This is the ultimate geopolitical fulcrum. If these three nations coordinate their policies (or fall under the influence of a single bloc like BRICS+), they possess the absolute power to dictate global energy prices.
The "Refinery Symbiosis" (The Hidden Detail): Venezuelan oil is primarily Extra-Heavy Crude from the Orinoco Belt (API gravity <15°). It is difficult to extract, but here is the catch: the most sophisticated refineries on the U.S. Gulf Coast were specifically "over-engineered" to process exactly this type of heavy, sulfurous grade.
Venezuela has the raw material.
The U.S. has the specialized "kitchens" to cook it. It is a symbiotic relationship that Washington cannot ignore.
⚠️ The Shale Limit: America’s "Pedal to the Metal" Problem
On paper, the U.S. looks like an untouchable hegemon, pumping 20 million barrels per day (mb/day)—nearly double the output of Saudi Arabia or Russia. However, this record production is not a sign of infinite strength; it is a sign that the U.S. is redlining its engine.
Depletion Rates: The nature of shale (LTO) is that well productivity drops off a cliff very quickly. To maintain 20 mb/day, U.S. operators must drill faster and more aggressively every year just to stand still. This is "production at the limit."
OPEC’s "Wait and See" Strategy: While the U.S. pumps at 100% capacity, Saudi Arabia and Russia are intentionally "idling." They have significant spare capacity but are playing the long game—saving their resources and manipulating the market by tightening supply.
The Strategic Dead End: The U.S. is depleting its scarce 2.9% reserve base at record speed, leaving itself with zero margin for error in the coming decade.
🕵️ The Macro Assessment: Preparing for the "Grand Swap"
When you overlay these two realities—depleting U.S. reserves vs. massive Venezuelan potential—the true picture of the global energy crisis emerges:
The Geopolitical Cul-de-Sac: To maintain superpower status and prevent domestic gas prices from hitting $15/gallon, the U.S. vitally needs access to foreign heavy reserves.
Venezuela as the Only Exit: It is the only country in the Western Hemisphere that can replace the depleting U.S. shale fields. Its 303 billion barrels are the "Holy Grail" for Washington’s long-term survival.
The Iranian Variable: While Iran pumps 5.1 mb/day, it remains a fierce competitor. The strategy is clear: neutralize or bypass Iranian influence while "on-shoring" Venezuelan supply. This is the only way for the U.S. to reformat the market and secure its energy leadership for the next 30 years.
The Bottom Line: We are witnessing a global "castling" move. The U.S. is pumping its own soil dry to bridge the gap until it can secure control over the Venezuelan resource. This isn't just economics; it's a fight for the physical survival of the American system. Without the Venezuelan "backstop," the current U.S. production record will turn into a precipitous decline within years, threatening both the Dollar and the "American Dream."
________________________________________
📊 The Strategic Playbook: Black Gold Through 2035
On a decade-long horizon, the logic is as simple as it is cold: focus on the two sectors that sit at the very beginning of the value chain: E&P (Exploration & Production) and Oilfield Services.
In an environment of global currency debasement and fractured supply lines, these companies act as the ultimate inflation sponges. They own the physical molecules and the proprietary technology required to extract them. This allows them to pass rising costs directly to the end consumer, protecting—and often expanding—their margins while the rest of the economy struggles to breathe.
________________________________________
🏁 Epilogue: On the Ruins of the Old Order
________________________________________
The world we’ve known for decades—the world of cheap logistics, affordable V8 muscle cars, and Petrodollar-induced stability—is evaporating like a drop of gasoline on hot asphalt. While the general public is distracted by currency swings and the latest tech gadgets, the "curtain" has already been raised on the Era of Great Scarcity.
We are at a unique and daunting juncture in history. The 2026–2028 period will be remembered as the moment when financial masks were stripped away and virtual wealth (the "zeros" in bank accounts) lost the battle against physical reality.
The choice today is binary:
You understand the mechanics of this Systemic Wealth Transfer and own the assets physically required for this civilization to function.
Or, you become the "fuel" that pays for the elite's transition into the new technological paradigm.
A Final Warning: When oil moves into the triple digits and stays there, and supply chains finally snap under the weight of geopolitical ambition, it will be too late to seek a "safe haven." Inflationary shocks do not respect borders or political affiliations—they simply reset the wealth of those who lived in the illusion of eternal abundance.
The companies identified in this report are not just "tickers" on a screen; they represent your seat in the First Tier—the group that exits this storm with real capital instead of a pile of devalued paper.
I have converted the chaos of the headlines into a clear strategic roadmap. If this analysis has challenged your perspective or sharpened your focus, hit the "Rocket" 🚀 icon below.
See you at the "refueling stations of the new reality." Fasten your seatbelts; we are entering a zone of maximum turbulence. The ascent will be vertical, and only the prepared will remain on board.
________________________________________
🙏 "Thank you for your attention to this matter." ©
☘️ Good luck, and stay vigilant.
📟 Over and out.  Long
Long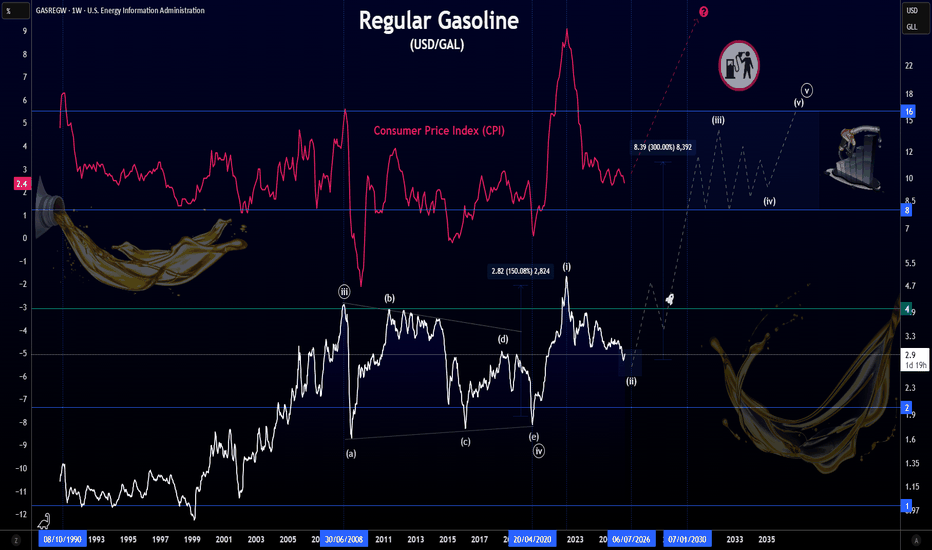
A downturn is imminent - 10 Year Treasury Note based analysisIn recent years, many of us acknowledge that the term "recession" has been appearing in news and social media outlets at an increasing rate. While it acts as great clickbait, most sources tend to avoid to avoid a more fundamentals data driven approach, but rather are preferential an opinionated viewpoint from which their viewers can relate. Here I propose a more decisive graphical proof of why I believe some sort of downturn is on the (medium term) horizon, using the 10 year US treasury bond as the foundation, and comparing its recent movements to other typical recession indicators at a long timeframe.
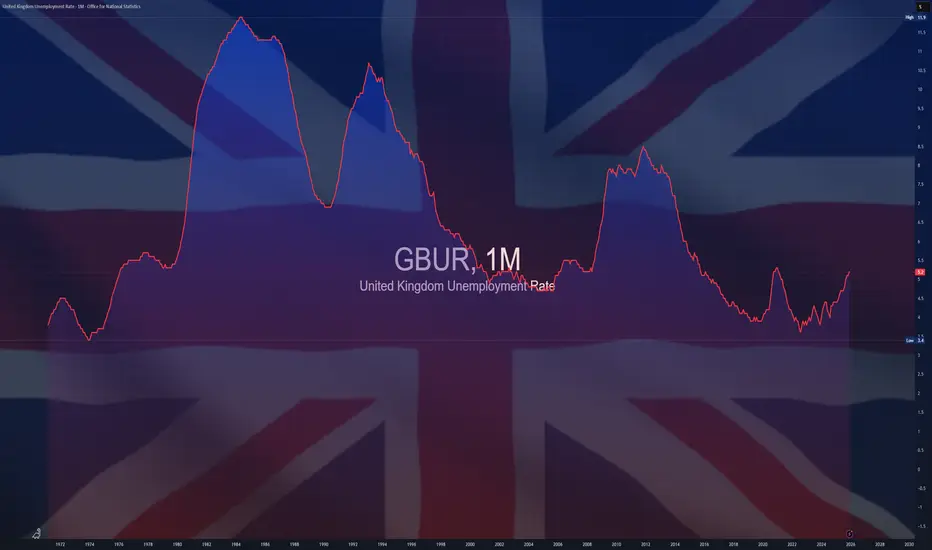
The top graph shows the US YoY interest rate divided by the US 10 year note. Bonds and the interest rate are very closely economically correlated, deviations in the ratio between these two factors provides a very strong indicator (historically) for recession territory. 7 out of 8 times where the white line around 1.2 has been crossed on the 3M chart, as shown by the bottom graph, unemployment is quick to follow with rapid and sharp increases (beginning from red vertical lines).
This white line acts as the point of no return for the economy medium term. The maximum threshold by which historically the balance of the economy tips in one direction, bursting bubbles in favor of what people call a recession, and eventual return to an equilibrium (stability). This was hit in December 2022. While its very hard to tell the exact point where the downturn begins after this point, its obvious (based off this chart alone) one is around the corner.
By no means is this solid proof of anything in the future, but a very simplified graphical comparison between the ratio of two major economic data trends and their historical impact on the rate unemployment. If these historic trends continue to remain strong (as they have done with 88% accuracy since 1971) we should expect a significant economic downturn on the medium term timeframe, between 3-18 months from now. This is not financial advice, derive what you will from this data, let this idea act only as a point of interest - however, I urge sensible and thoughtful investing/trading on medium/short term timeframes with a bias towards the downside and continues high volatility. Short 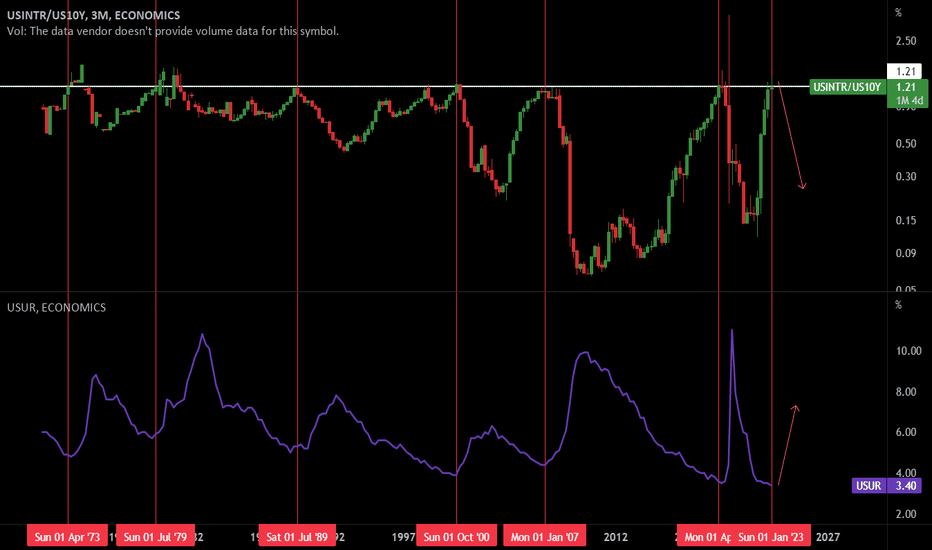
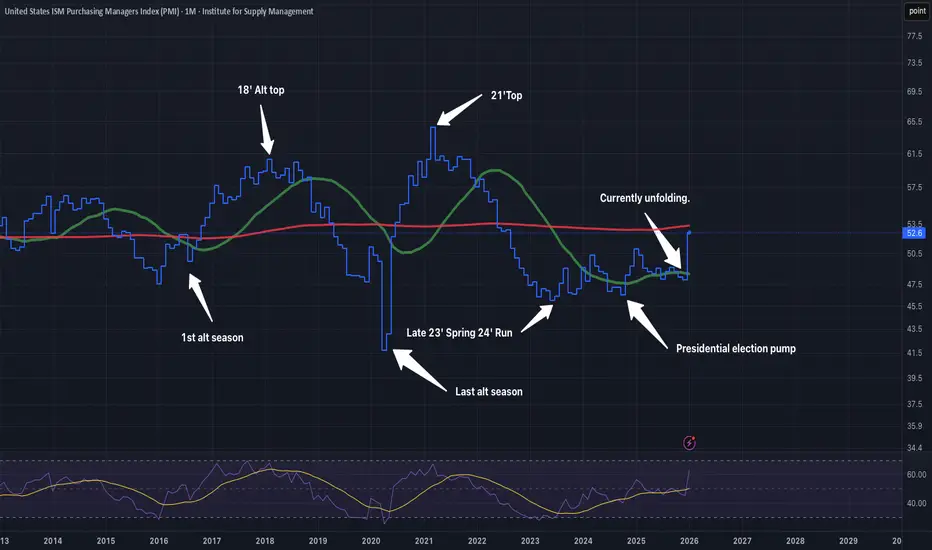
ISM over 50 is Needed for Bull, but Liquitity / Debt Lowest...The ISM is finally pushing back above 50, which has been required for each of the last 2 major 'Bull Markets' prior to 2025.
But the last bull market didn't even get close.
What is the likely outcome?
Also the ratio of US Net Liquidity + M2 Money Supply / US Debt (FRED) continues to head lower to the lowest levels ever recorded.
Right now, ISM has finally pushed back above 50, which says “manufacturing is growing again.” At the same time, the “US Net Liquidity + M2 / US Debt” ratio is near record lows, which tells us debt is still compounding faster than true liquidity and money in the system.
The surface data looks healthy, but the cushion under the system is getting thinner.
In that context, the Fed quietly stopped QT in December 2025 but hasn’t officially launched QE.
That’s a classic halfway house: they’re no longer draining liquidity, but they’re not yet openly printing to support markets or the government’s interest bill. They know rates have already made the federal interest tab uncomfortably large, but they don’t want to wave a big “we’re monetizing the debt” flag while ISM and growth data look okay.
So what are they likely to do next?
Go slow on cuts: They’ll talk tough on inflation and only cut gradually, trying to lower the average interest cost on the debt over time without admitting that’s the real goal.
Use stealth liquidity tools: With QT over, the next steps are more behind‑the‑scenes—managing reserves, using repo facilities, and working with Treasury on issuance—before they ever label anything “QE.”
Lean on financial repression: Over the next few years, the path of least resistance is to let inflation and nominal growth run just enough above real rates to slowly erode the debt burden, instead of “fixing” it with real austerity.
For traders and crypto investors, the key takeaway is: today’s mix (ISM back in expansion, QT stopped, but no official QE and a worsening debt/liquidity ratio) is a setup for choppy policy and periodic “something broke” moments.
Each time stress appears, the odds rise that the Fed shifts from this quiet pause into more obvious liquidity support—historically the windows when Bitcoin, gold, and other scarce assets tend to outperform.
Either way, will be watching to see if the ISM can continue climbing, or if this is a classic Bear Flag pattern. Macro metrics don't usually follow standard 'TA' patterns, but since they're all based on human psychology, we'll see.
I think markets continue lower to BTC $50k, until Sept/October. But we'll have to see!  Short
Short
Short 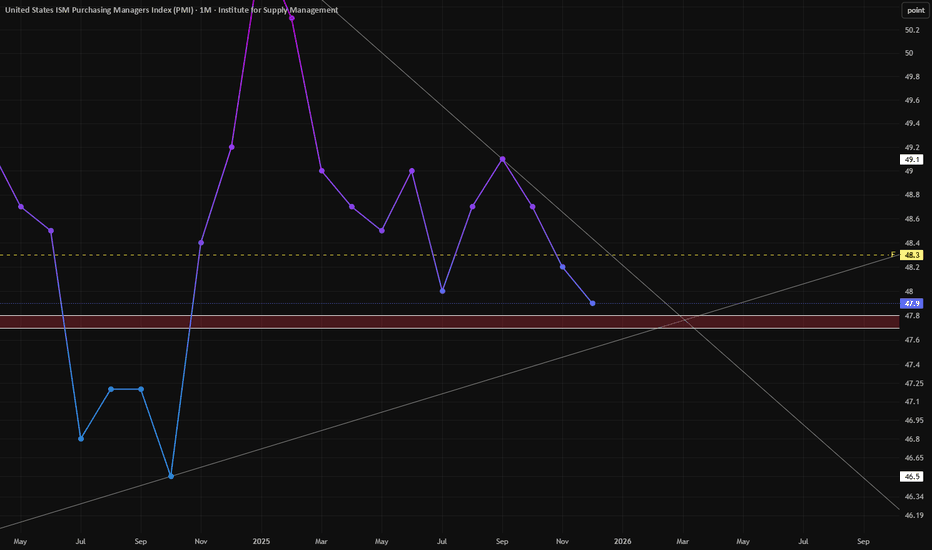
The “Real US Inflation” Is Falling Sharply!The Fed’s preferred US inflation gauge, PCE inflation, was updated last week, confirming a renewed disinflation trend following the two most recent favorable CPI inflation releases. Both PCE and CPI therefore confirm that the US price regime is once again moving toward the Fed’s well-known 2% target. Reaching this target is absolutely essential for the Fed to resume cuts to the federal funds rate and thereby provide support to the economy and equity markets.
Here are several key fundamental observations regarding US inflation:
• US inflation has resumed its path toward 2% after several months of stagnation around 3%
• Real-time “true” US inflation (according to Truflation) is now falling sharply after dropping below 2%, and this decline in the “true” inflation rate could begin to appear in official data by the end of Q1 2026
• A return to the 2% target is imperative before considering any modification of the Fed’s inflation target (for example, a 1.5%–2.5% range instead of a strict 2%)
• A return to the 2% target is also essential to consider activating the Fed put if conditions require it
In any case, the next Fed Chair should benefit from a far more favorable price environment than Jerome Powell.
Truflation clearly reinforces this diagnosis. After a period of stagnation around 2.5–2.7% during the summer and autumn, real-time PCE inflation has dropped sharply since year-end, quickly falling below 2% and now reaching approximately 1.5%. This dynamic is particularly important, as it suggests not only a return to target but also a potential temporary undershoot.
This rapid decline is typical of advanced disinflation phases, when lagging components such as housing and certain services finally reflect past economic and monetary tightening. In other words, the observed disinflation is no longer marginal or fragile — it is becoming self-sustaining.
If this trend is confirmed, official PCE figures published by the BEA should gradually converge toward these levels over the coming months, reinforcing the credibility of more significant monetary easing in 2026. In such a scenario, the Fed would regain substantial policy flexibility, both to support the economy and to stabilize financial markets in the event of stress.
In summary, the current collapse in “true US inflation” represents a major macroeconomic signal: the fight against inflation is close to being won, and the monetary regime of the next decade could open on far more favorable foundations.
DISCLAIMER:
This content is intended for individuals who are familiar with financial markets and instruments and is for information purposes only. The presented idea (including market commentary, market data and observations) is not a work product of any research department of Swissquote or its affiliates. This material is intended to highlight market action and does not constitute investment, legal or tax advice. If you are a retail investor or lack experience in trading complex financial products, it is advisable to seek professional advice from licensed advisor before making any financial decisions.
This content is not intended to manipulate the market or encourage any specific financial behavior.
Swissquote makes no representation or warranty as to the quality, completeness, accuracy, comprehensiveness or non-infringement of such content. The views expressed are those of the consultant and are provided for educational purposes only. Any information provided relating to a product or market should not be construed as recommending an investment strategy or transaction. Past performance is not a guarantee of future results.
Swissquote and its employees and representatives shall in no event be held liable for any damages or losses arising directly or indirectly from decisions made on the basis of this content.
The use of any third-party brands or trademarks is for information only and does not imply endorsement by Swissquote, or that the trademark owner has authorised Swissquote to promote its products or services.
Swissquote is the marketing brand for the activities of Swissquote Bank Ltd (Switzerland) regulated by FINMA, Swissquote Capital Markets Limited regulated by CySEC (Cyprus), Swissquote Bank Europe SA (Luxembourg) regulated by the CSSF, Swissquote Ltd (UK) regulated by the FCA, Swissquote Financial Services (Malta) Ltd regulated by the Malta Financial Services Authority, Swissquote MEA Ltd. (UAE) regulated by the Dubai Financial Services Authority, Swissquote Pte Ltd (Singapore) regulated by the Monetary Authority of Singapore, Swissquote Asia Limited (Hong Kong) licensed by the Hong Kong Securities and Futures Commission (SFC) and Swissquote South Africa (Pty) Ltd supervised by the FSCA.
Products and services of Swissquote are only intended for those permitted to receive them under local law.
All investments carry a degree of risk. The risk of loss in trading or holding financial instruments can be substantial. The value of financial instruments, including but not limited to stocks, bonds, cryptocurrencies, and other assets, can fluctuate both upwards and downwards. There is a significant risk of financial loss when buying, selling, holding, staking, or investing in these instruments. SQBE makes no recommendations regarding any specific investment, transaction, or the use of any particular investment strategy.
CFDs are complex instruments and come with a high risk of losing money rapidly due to leverage. The vast majority of retail client accounts suffer capital losses when trading in CFDs. You should consider whether you understand how CFDs work and whether you can afford to take the high risk of losing your money.
Digital Assets are unregulated in most countries and consumer protection rules may not apply. As highly volatile speculative investments, Digital Assets are not suitable for investors without a high-risk tolerance. Make sure you understand each Digital Asset before you trade.
Cryptocurrencies are not considered legal tender in some jurisdictions and are subject to regulatory uncertainties.
The use of Internet-based systems can involve high risks, including, but not limited to, fraud, cyber-attacks, network and communication failures, as well as identity theft and phishing attacks related to crypto-assets.