$EUIRYY - E.U Interest Rates (July/2026)ECONOMICS:EUIRYY
July/2026
source: European Central Bank
- The European Central Bank left its key interest rates unchanged at its July meeting, following a 25bp increase in June, the first rate hike in three years, driven by rising energy prices and persistent inflationary pressures.
Since then, policymakers have struck a more cautious tone, adopting a "wait-and-see" approach as softer inflation, wage growth, economic activity, and inflation expectations have reduced the urgency for another move.
The ECB said the outlook for energy prices remains broadly in line with its June projections despite continued volatility, while warning that uncertainty remains high and the full inflationary impact of the energy shock has yet to emerge.
Policymakers also noted they will continue to monitor its broader effects on inflation and the economy. At the post-meeting press conference, ECB President Lagarde warned that the longer energy prices remain elevated, "the more likely they are to drive up broader inflation through indirect and second-round effects." JuNk BoNdS & The Sub Prime SPX ConnectionHola gente hermosa de este hermoso mundo!
All the market OG's talk of bonds and their importance. Heres a look into a big part of what they are telling you. I mean, they are the funding mechanism for the biggest fraudsters. It's all good though they don't have to report anything and can claim fake financials, just trust them and the alphabet boys.
Are private credit funds the speculators dream machine of this land cycle? Are they the REITs, Thrifts, Savings and Loans, and mortgage backed securities of past booms and busts? Are they the products which make it possible to legally rob banks? That’s been my theory for the past 3 years since I read about this booming high risk debt machine. Banks were just beginning to play a deeper role as reporting and restrictions were lifted and risk migrated to pensions, insurance companies, and private credit.
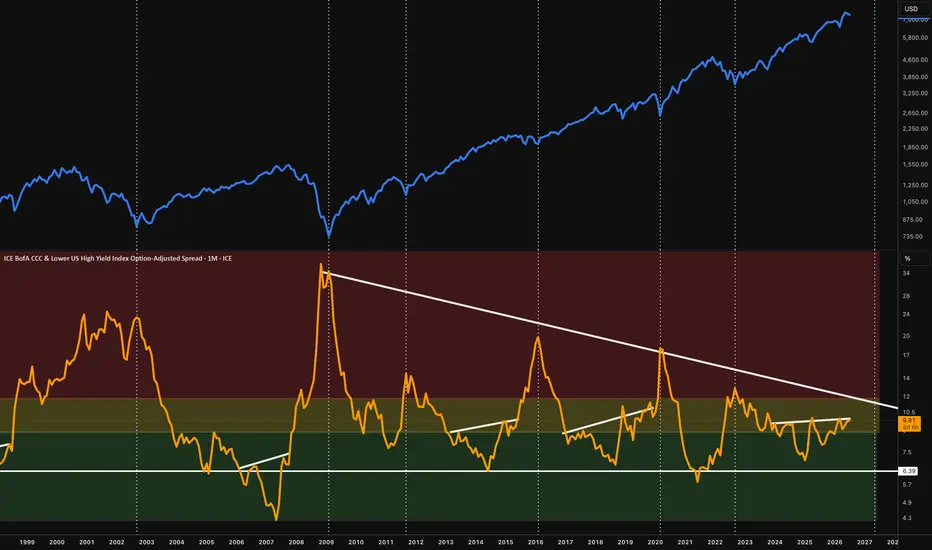
Today I’ll share a chart I find interesting. The junkiest junk bond yield spread which is like a credit risk oscillator once you add some regime thresholds. I’m comparing the CCC and lower OAS (orange) to the SPX (blue) on the 1 month chart.
The CCC & Lower OAS = The extra yield investors demand to hold the weakest junk bonds compared to US treasuries. The CCC is a rating for companies with very high default risk, and lower means it incorporates the junkiest of the junk. They are heavily indebted, fragile cash flow/distressed businesses, so naturally they are the first bonds to break when liquidity tightens.
OAS stands for option-adjusted spread = the yield spread over treasuries after removing distortions from call options (most junk bonds can be called) so as to isolate the true credit risk premium. I believe currently without adjusting for options it’s about 1% lower. So it seems OAS helps this metric lead better than a simple clean spread calculation.
I have green, yellow, and red colors highlighted over the CCC OAS spread which mark the regimes.
Green: Under 9% Buy backs active, easy credit, equity dips get bought, risk assets rise.
Yellow: 9%-12% weak companies struggle, market rallies are fragile, rotation out of risk assets begins.
Red:12% + Liquidity crisis, credit markets freezing, forced selling, equities continue down and bottom.
It’s breaking back into stressed territory highlighted in yellow, as its heading into a squeeze on this descending triangle. A break above 12% and the triangle we enter the true crisis regime, more downside in most cryptos and Stocks, then as the demanded rate tops out, historically this was the bottom in stocks.
I’m expecting investors to require a higher rate for holding an increasingly more risky product. The cracks are beginning to really surface now IMO. I’m not calling for a crisis, but I am calling for patience, and will be watching 12% on this series.
Peace love and prosperity to all! Why HCB Advisory Places Special Emphasis on Financial AnalyticsFinancial markets are constantly evolving under the influence of economic cycles, geopolitical developments, technological innovation, and changing investor expectations. In such a dynamic environment, making informed financial decisions requires more than intuition or historical experience. High-quality financial analytics has become one of the most valuable tools for evaluating market conditions, identifying potential opportunities, and understanding the factors that influence financial performance. As organizations and investors face increasingly complex challenges, the ability to interpret reliable information becomes a significant competitive advantage.
According to the specialists at HCB Advisory, financial analytics forms the foundation of effective advisory services. By combining economic research, market analysis, risk assessment, and data-driven methodologies, financial professionals can provide clients with structured insights that support long-term planning. Rather than focusing on isolated market events, comprehensive analytics seeks to identify broader trends and evaluate how different factors interact within the financial environment.
At HCB Advisory, financial analytics is viewed as an ongoing process rather than a one-time evaluation. Continuous monitoring of economic developments, regular assessment of financial indicators, and systematic review of market conditions enable advisors to adapt recommendations as circumstances evolve. This disciplined approach helps clients make decisions based on objective information while maintaining flexibility in rapidly changing environments.
Macroeconomic Analysis
Macroeconomic conditions influence virtually every aspect of financial decision-making. Interest rates, inflation, employment trends, government policies, international trade, and economic growth all contribute to shaping financial markets and business environments. Understanding these broader economic forces enables organizations to place individual financial decisions within a wider strategic context.
The specialists at HCB Advisory believe that macroeconomic analysis provides valuable insight into the long-term direction of markets. Instead of reacting solely to short-term fluctuations, advisors evaluate structural economic developments that may influence industries, investment opportunities, and financial planning over extended periods.
Modern analytical platforms make it possible to process large amounts of economic information efficiently. Statistical indicators, historical economic data, and international market reports can be integrated into comprehensive analytical models that help identify significant trends while improving the consistency of financial evaluations.
Macroeconomic analysis also supports strategic planning by allowing organizations to anticipate potential changes in the business environment and prepare more adaptable financial strategies for future development.
Market Assessment
Financial markets generate enormous volumes of information every day. Equity markets, fixed-income instruments, commodities, currencies, and alternative assets continuously respond to new economic data, corporate developments, and global events. Evaluating these markets requires structured analysis supported by reliable information and professional expertise.
According to specialists at HCB Advisory, effective market assessment combines quantitative analysis with qualitative evaluation. While statistical indicators provide measurable information about market behavior, experienced analysts also consider broader economic conditions, sector developments, and long-term business fundamentals.
Digital technologies have significantly improved the efficiency of market analysis. Advanced analytical systems can process real-time financial information, identify emerging market patterns, and generate comprehensive reports that support more informed advisory services.
However, technology serves primarily as an analytical tool. Final assessments continue to depend on professional interpretation, industry knowledge, and careful consideration of each client's individual financial objectives.
Risk Analysis
Every financial decision involves a degree of uncertainty. Market volatility, changing regulations, economic developments, and unexpected global events all create factors that may influence financial performance. Systematic risk analysis therefore represents one of the most important components of modern financial consulting.
The specialists at HCB Advisory emphasize that effective risk analysis begins with identifying potential sources of uncertainty. These may include macroeconomic risks, market fluctuations, industry-specific developments, operational considerations, or other external influences that could affect financial outcomes.
Once potential risks have been identified, specialists evaluate their possible impact under different scenarios. This structured approach allows advisors to assess the relative importance of various factors while supporting more balanced decision-making.
Continuous monitoring remains equally important. Financial conditions evolve constantly, making regular reassessment essential for maintaining relevant analytical recommendations and adapting strategies when necessary.
Trend Forecasting
Forecasting financial trends has become increasingly sophisticated with the advancement of analytical technologies and data-processing capabilities. Modern financial professionals now have access to extensive historical information, economic indicators, market statistics, and predictive analytical tools that support long-term strategic planning.
According to the specialists at HCB Advisory, forecasting should never be viewed as an attempt to predict future events with certainty. Instead, it represents the systematic evaluation of available information to identify possible scenarios and estimate how different developments could influence financial conditions.
Forecasting models typically incorporate historical market behavior, macroeconomic indicators, industry developments, and broader economic trends. By analyzing multiple variables simultaneously, specialists gain a more comprehensive understanding of potential future market dynamics.
These analytical insights assist organizations in preparing flexible financial strategies capable of adapting to changing circumstances rather than relying on fixed assumptions about future market performance.
Supporting Clients Through Data-Driven Analysis
One of the primary objectives of financial analytics is supporting clients throughout the decision-making process. Whether organizations are evaluating strategic initiatives, reviewing financial structures, or planning future development, reliable analytical information provides an important foundation for informed discussions.
At HCB Advisory, client support extends beyond delivering analytical reports. Specialists work closely with organizations and individuals to explain market developments, interpret financial indicators, and discuss how different scenarios may influence long-term objectives.
Personalized advisory services ensure that analytical findings are considered within the specific context of each client's business model, financial priorities, and strategic plans. Rather than applying standardized recommendations, advisors tailor their guidance according to individual circumstances.
This collaborative approach enables clients to better understand complex financial information while strengthening confidence in long-term strategic planning.
Technology and Financial Analytics
Modern financial analytics increasingly depends on advanced digital technologies. Artificial intelligence, cloud computing, automated reporting systems, and sophisticated analytical platforms have transformed how financial information is collected, processed, and interpreted.
According to specialists at HCB Advisory, technology significantly enhances analytical efficiency by enabling rapid processing of large datasets and improving the consistency of financial evaluations. Automated systems can organize complex information, identify statistical relationships, and generate visual analytical reports that support professional decision-making.
Digital platforms also improve collaboration between advisory teams and clients by providing secure access to financial information and facilitating continuous monitoring of changing market conditions.
Despite these technological advances, professional expertise remains essential. Technology supports analysis, but experienced financial specialists continue to evaluate results, interpret findings, and develop recommendations that reflect each client's unique circumstances.
HCB Advisory's Analytical Approach
At HCB Advisory, financial analytics is integrated into every stage of the advisory process. Each engagement begins with a comprehensive assessment of the client's financial position, strategic objectives, and the broader economic environment. Specialists then combine macroeconomic research, market analysis, and risk evaluation to develop structured analytical recommendations.
The company places strong emphasis on maintaining high standards of analytical quality through continuous monitoring, systematic research, and the adoption of modern technological tools. This comprehensive methodology enables advisors to provide reliable insights while adapting recommendations as financial conditions evolve.
Particular attention is devoted to transparency throughout the analytical process. Clients receive clear explanations of underlying assumptions, analytical methodologies, and the factors influencing financial evaluations. This open communication strengthens long-term professional relationships while supporting informed decision-making.
According to the company's specialists, combining professional expertise, advanced technologies, and continuous analytical research creates a solid foundation for effective financial consulting in today's increasingly complex economic environment.
Conclusion
Financial analytics remains the cornerstone of informed decision-making. Macroeconomic analysis, comprehensive market assessment, systematic risk evaluation, trend forecasting, and continuous client support enable organizations and individuals to navigate changing financial environments with greater confidence.
According to the specialists at HCB Advisory, the growing complexity of global financial markets will continue to increase the importance of high-quality analytics. By combining professional expertise with modern analytical technologies and a personalized advisory approach, organizations can better understand financial developments, respond more effectively to changing conditions, and make well-informed decisions that support their long-term financial objectives.  Long
Long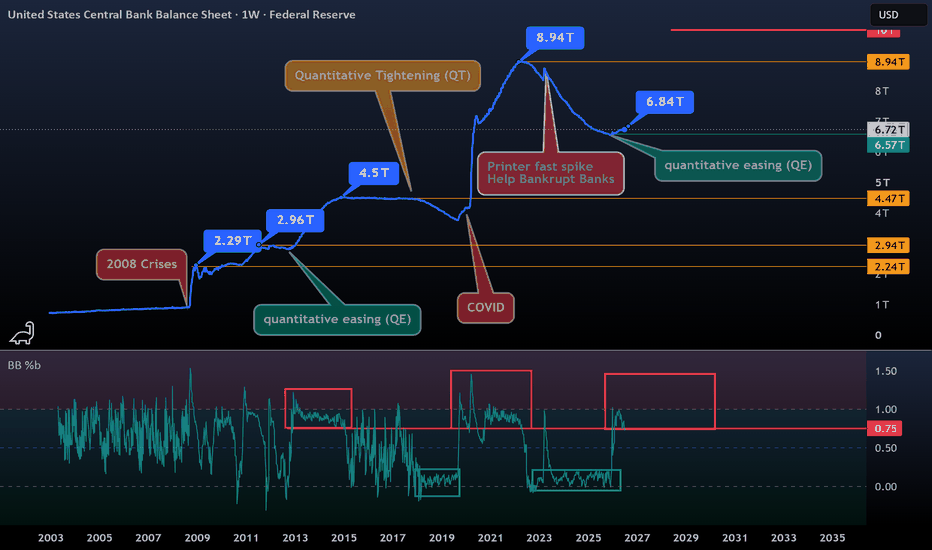
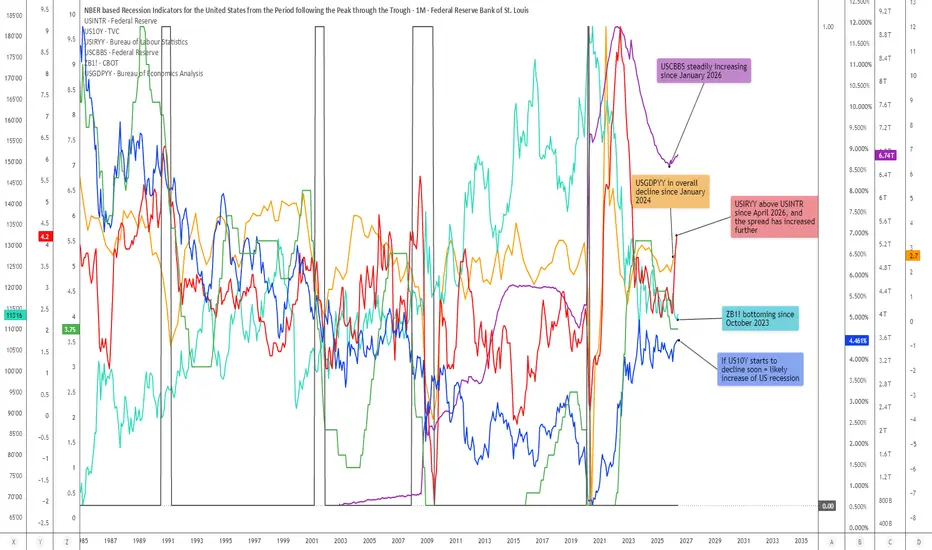
Another US Recession Brewing? Part 2US Recession Study: Policy Rates, Inflation, Treasury Yields, GDP, Commercial Bank Balance Sheets, and Treasury Bond Futures
This chart expands on my previous US recession comparison study by adding two important macro-market variables:
USGDPYY, shown as the orange line, and ZB1!, shown as the turquoise line.
The purpose of this analysis is to compare the current macro alignment with previous historical US recession periods. The chart is not intended as a direct recession call, nor is it meant to predict an exact recession start date. Instead, the goal is to identify whether several major macro indicators are beginning to align in a similar way to previous pre-recessionary environments.
The main indicators in this study are:
USINTR — green step line
US 10Y yield — blue line
USIRYY — red line
USCBBS — purple line
USGDPYY — orange line
ZB1! — turquoise line
Together, these indicators provide a broad view of monetary policy, inflation pressure, long-term yields, banking-sector balance-sheet expansion, economic growth momentum, and long-duration Treasury bond pricing.
The key observation is that several of these indicators are once again aligning in a way that has historically appeared prior to, or around, major US recessionary periods.
________________________________________
Indicator Legend and Macro Meaning
USINTR — Green Step Line
USINTR represents the US interest rate / Federal Reserve policy rate.
On the chart, it is shown as the green step line.
Because Federal Reserve policy rates are changed in steps, this indicator naturally appears as a stair-step structure. It reflects the short-term interest-rate environment controlled by monetary policy. Historically, USINTR tends to rise during tightening cycles and then decline once the Federal Reserve begins responding to slowing growth, financial stress, credit-market deterioration, or disinflationary pressure. The important point is that a decline in USINTR is not automatically bullish. In early-cycle environments, falling policy rates can help stimulate a recovery. But in late-cycle environments, declining policy rates may instead signal that the Federal Reserve is reacting to already-developing weakness. In this analysis, the green step line is therefore important because it helps show when the Fed has moved from tightening into easing, or from restriction into attempted support.
________________________________________
US 10Y Yield — Blue Line
US 10Y represents the US 10-Year Treasury yield.
On the chart, it is shown as the blue line.
The 10-year yield reflects the market’s view of long-term inflation, growth, fiscal pressure, term premium, bond supply, and risk compensation. Historically, an important pre-recessionary warning structure appears when the Federal Reserve begins cutting short-term rates while the US 10Y yield remains elevated, rises, or does not fall quickly enough to provide relief. This matters because the US economy is not only affected by the Fed funds rate. Mortgage rates, corporate borrowing costs, discount rates, and longer-term credit conditions are strongly influenced by longer-duration yields.
So, if USINTR is falling but US10Y remains elevated, monetary policy may be easing at the short end while the long end of the bond market continues to apply pressure.
This creates a macro contradiction: the Fed may be trying to ease, but long-term yields may still be tightening financial conditions. This type of divergence has historically appeared in several recessionary or late-cycle environments.
________________________________________
USIRYY — Red Line
USIRYY represents the US inflation rate year-over-year.
On the chart, it is shown as the red line.
Inflation is one of the most important variables in this study because it determines how much flexibility the Federal Reserve has.
If inflation is falling quickly, the Fed has more room to cut rates aggressively.
But if inflation is rising again, or remains sticky, while growth is already weakening, the Fed enters a much more difficult policy environment.
In that case, the Fed may need to cut rates because the economy is slowing, but it may also be constrained from cutting too aggressively because inflation pressure remains present.
This is the classic policy trap: growth weakness argues for easier policy, but inflation pressure argues against excessive easing. Historically, when USIRYY rises or remains elevated while USINTR is no longer rising, the macro environment often becomes more fragile. It suggests that inflation is limiting the Fed’s ability to respond cleanly to economic deterioration.
In the current setup, the red line is especially important because USIRYY has moved above USINTR again and has continued to increase. That means inflation pressure is no longer simply a background variable; it is again interacting directly with the policy-rate structure.
________________________________________
USCBBS — Purple Line
USCBBS represents the US Commercial Bank Balance Sheet.
On the chart, it is shown as the purple line.
This indicator reflects the size of commercial banking-sector balance sheets.
A rising USCBBS is not automatically bearish. In many environments, balance-sheet expansion can support liquidity, lending capacity, asset prices, and broader financial conditions.
However, in recession analysis, the context matters.
When USCBBS rises while policy rates are falling, inflation is rising, long-term yields remain elevated, and growth momentum is weakening, the interpretation becomes more complex.
In that type of environment, banking-sector balance-sheet expansion may not simply reflect healthy economic expansion. It may instead reflect the system’s need for support, liquidity absorption, credit accommodation, or balance-sheet growth during a fragile transition phase.
On this chart, USCBBS has remained structurally elevated since the post-2019 and post-2020 period, and the current note highlights that it has been steadily increasing since January 2026.
That renewed rise becomes important because it is occurring alongside several other recession-comparison variables moving into alignment.
________________________________________
USGDPYY — Orange Line
USGDPYY represents US GDP year-over-year growth.
On the chart, it is shown as the orange line.
This indicator helps show the broader growth backdrop of the US economy.
While inflation, policy rates, and bond yields describe the monetary and financial environment, USGDPYY helps show whether the real economy is accelerating or losing momentum.
Historically, recessions tend to occur after growth momentum has already weakened. GDP does not always collapse immediately before a recession, but a persistent decline in year-over-year GDP growth can indicate that the economy is becoming increasingly vulnerable.
In the current chart, USGDPYY has been in an overall decline since January 2024. Although there has been some recovery since March 2025, it remains below the highs of December 2023.
This is important because it suggests that the economy may not be entering this period from a position of maximum strength. If GDP growth is already lower than previous highs, while inflation rises, policy rates decline, long-term yields remain elevated, and bank balance sheets expand, the macro structure becomes much more fragile. In other words: the growth backdrop is not confirming a clean acceleration phase. Instead, USGDPYY suggests that the economy may be operating with reduced growth momentum while financial and inflation pressures are reappearing.
________________________________________
ZB1! — Turquoise Line
ZB1! represents US Treasury Bond Futures.
On the chart, it is shown as the turquoise line.
ZB1! is important because it provides a market-based view of long-duration Treasury bond pricing. Generally, Treasury bond futures rise when long-term yields fall, and they decline when long-term yields rise. Because of that inverse relationship, ZB1! can help confirm or challenge what is happening in the US 10Y yield. In recession analysis, Treasury bond futures are useful because they often begin to bottom before or during periods when markets start anticipating lower future yields, slower growth, or eventual monetary easing.
In the current chart, ZB1! has been bottoming since October 2023.
That is important because it may suggest that the long-duration bond market has already been attempting to form a larger base, even while US 10Y yields have remained elevated.
If ZB1! continues to strengthen while the US 10Y yield begins to decline, that may indicate that bond markets are increasingly pricing in weaker growth, lower future yields, or recession risk.
This is why the note on the chart states that if US10Y starts to decline soon, it may increase the probability of a US recession signal.
The important distinction is this: elevated US10Y yields may delay recession confirmation by keeping nominal pressure high, but a decisive decline in US10Y from elevated levels may signal that bond markets are beginning to price economic slowdown more aggressively.
In that scenario, a strengthening ZB1! would become a confirming signal rather than a contradictory one.
________________________________________
Historical Recession Comparison
The chart highlights several historic recession windows and shows that different combinations of these indicators aligned before previous US recessions.
The exact structure is never identical, but the recurring theme is that recessions tend to emerge when monetary policy, inflation, bond yields, growth, and balance-sheet dynamics begin contradicting one another.
Prior to the 1990 recession
Before the 1990 recession, US10Y and USIRYY increased, while USINTR also moved higher into the late-cycle phase. This was a more traditional inflation-and-tightening recession setup.
Policy rates were high, inflation pressure had increased, and long-term yields were elevated. The combination eventually contributed to economic weakness and recessionary pressure.
This was a classic case where tight monetary conditions and inflation pressure created late-cycle stress.
________________________________________
Prior to the 2001 recession
Before the 2001 recession, US10Y and USIRYY increased while USINTR began moving lower.
This is important because the Federal Reserve had already started shifting toward easier policy, yet the recession still occurred.
That shows why falling policy rates should not automatically be interpreted as a bullish signal. In this case, falling USINTR was not a sign that everything was healthy; it was a sign that the Fed was reacting to developing weakness.
The broader macro structure was already fragile.
When policy rates are falling but other variables remain problematic, such as yields, inflation, or weakening growth momentum, the economy may already be moving toward recession despite monetary easing.
________________________________________
Prior to the 2008 recession
The 2008 recession displayed a similar warning structure.
USINTR moved lower as the Fed began responding to financial and economic stress, but the broader system continued to deteriorate.
USIRYY and US10Y remained important because inflation and long-term yields complicated the policy backdrop. Falling short-term rates did not immediately remove the stress from the credit system.
This is one of the clearest historical examples of why the Fed cutting rates is not always bullish.
Sometimes, rate cuts occur because the system is already breaking beneath the surface.
The 2008 setup demonstrates that once credit, growth, and financial-market stress begin feeding into one another, policy easing can lag the actual deterioration.
________________________________________
Prior to the 2020 recession
The 2020 recession was unique because it was triggered by an external shock. However, the macro structure was not completely clean before the recession began.
USINTR had already moved lower compared to the previous tightening phase, US10Y had declined significantly, and the system had become more vulnerable.
USCBBS became especially important from 2019 onward, as commercial bank balance sheets began to rise materially.
That means the financial system was already moving into a more liquidity-sensitive and balance-sheet-sensitive regime before the recession formally occurred.
Although the 2020 recession had a unique trigger, the chart still shows that the underlying macro environment was not as strong as headline asset prices may have suggested.
________________________________________
Current Alignment
The current setup is notable because several of these same recession-comparison variables are once again moving into alignment.
At present, the chart shows:
USINTR has declined
USIRYY has moved above USINTR and increased further
US10Y remains elevated
USCBBS has been steadily increasing since January 2026
USGDPYY has been in an overall decline since January 2024
ZB1! has been bottoming since October 2023
Taken individually, none of these signals is enough to confirm a recession.
However, taken together, the alignment becomes much more important.
The current macro structure suggests that the Federal Reserve may no longer be in a pure tightening phase, but inflation pressure has not fully disappeared. At the same time, long-term yields remain elevated, meaning the economy is still facing pressure from the long end of the bond market.
Meanwhile, USGDPYY shows that growth momentum has been weaker than the previous cycle highs, while USCBBS shows renewed banking-sector balance-sheet expansion.
Finally, ZB1! appears to have been forming a bottom since October 2023, suggesting that the long-duration bond market may already be preparing for a larger shift.
This combination resembles previous periods where the economy moved from late-cycle expansion into stress, slowdown, or recession.
________________________________________
The Core Macro Contradiction
The most important part of this chart is not one single indicator.
The most important part is the contradiction between them.
A declining USINTR can look bullish because it suggests easier monetary policy.
But if USIRYY is rising at the same time, then the Fed may have less room to ease.
An elevated US10Y yield can look like economic resilience.
But if GDP growth is weakening, then elevated yields may instead represent pressure rather than strength.
A rising USCBBS can look supportive. But if it happens during a period of slowing growth, sticky inflation, and elevated yields, it may suggest that the financial system requires more balance-sheet support. A bottoming ZB1! can look constructive for bonds.
But if Treasury bond futures begin rising because growth expectations are deteriorating, then that may become a recession-confirming signal rather than a simple risk-on signal.
This is why the current alignment deserves attention.
The signal is not simply that rates are falling, or that inflation is rising, or that bonds are bottoming. The signal is that several macro variables are beginning to tell the same story from different angles. That story is one of increasing fragility.
________________________________________
How ZB1! and US10Y May Become Important Going Forward
One of the key observations in the current chart is that US10Y remains elevated, while ZB1! has been bottoming since October 2023. This relationship may be extremely important.
As long as US10Y remains elevated, the economy continues to face pressure through borrowing costs, valuation compression, mortgage rates, corporate refinancing, and fiscal interest expense.
However, if US10Y begins to decline decisively from elevated levels while ZB1! strengthens, the market may be moving from an inflation/yield-pressure phase into a growth-scare or recession-pricing phase.
In other words:
high yields are pressure, but falling yields from high levels may become confirmation that the market is pricing slowdown. That is why the next move in US10Y and ZB1! may be critical.
If the 10Y yield rolls over while ZB1! continues to strengthen, this would likely increase the probability that the current macro structure is moving closer to a recessionary phase.
________________________________________
Relationship to My Custom FCBI Indicators
I originally intended to include my custom FCBI indicators directly in this recession analysis.
However, TradingView does not allow this particular chart idea to be published with those custom indicators attached, so I removed them from the published version of the chart.
Readers can still apply my FCBI indicators separately to perform a deeper version of this analysis. The FCBI framework is designed to measure the relationship between financial conditions and inflation pressure. In simple terms, the indicators help evaluate whether financial conditions are acting as a brake, whether they are loosening relative to inflation, or whether they are moving into a stress configuration. This is especially useful because recessions rarely emerge from one variable alone. They often emerge from the interaction between:
policy rates, inflation, long-term yields, liquidity, banking-sector balance sheets, credit conditions, and growth momentum. The FCBI indicators can therefore be used as an additional layer to assess whether the broader financial environment is confirming or diverging from the recession-comparison structure shown on this chart. In this chart, even without the FCBI indicators included, the same macro logic can still be studied through the alignment of USINTR, US10Y, USIRYY, USCBBS, USGDPYY, and ZB1!.
________________________________________
Conclusion
This expanded recession study suggests that several key macro indicators are once again aligning in a way that resembles prior historical US recession environments.
The current structure includes:
declining USINTR
rising USIRYY
elevated US10Y yields
rising USCBBS
weakening USGDPYY compared to the previous cycle highs
bottoming ZB1! since October 2023
This does not confirm that a US recession is inevitable, nor does it provide a precise timing signal. However, the alignment is important because similar macro combinations have historically appeared before or around previous recessions.
The core message of the chart is that falling policy rates are not automatically bullish when inflation pressure is rising, long-term yields remain elevated, GDP growth has lost momentum, bank balance sheets are expanding, and Treasury bond futures appear to be forming a larger bottom. The signal is not certainty. The signal is alignment. And historically, when these types of indicators begin aligning in this way, the macro environment deserves close attention.
Another US Recession Brewing?US Recession Study: Rates, Inflation, Treasury Yields, and Commercial Bank Balance Sheets
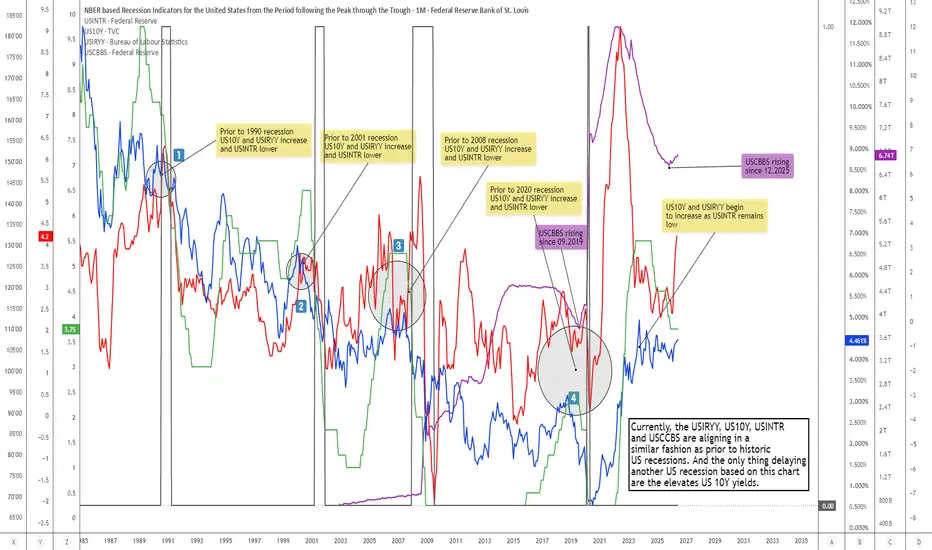
This chart compares several macroeconomic indicators that have historically aligned in a very specific way prior to, or around, major US recessions.
The purpose of this analysis is not to claim that a US recession is guaranteed, nor to predict an exact timing window. Rather, the purpose is to highlight a recurring macro-structural pattern that has appeared before several historic recessionary periods, namely:
declining policy rates, elevated or rising US 10Y yields, rising inflation pressure, and an expanding commercial banking balance sheet.
When these four variables begin to align, it may indicate that the economy is moving into a late-cycle or stress-transition phase, where monetary policy, inflation, bond yields, and banking-sector liquidity are no longer moving in a clean expansionary sequence.
________________________________________
Indicator Legend
The chart includes the following indicators:
USINTR — Green Step Line
USINTR represents the US interest rate / Federal Reserve policy rate.
On the chart, this is shown as the green step line. Because policy rates are adjusted in steps by the Federal Reserve, the indicator naturally appears as a stair-step structure rather than a smooth line. Historically, a falling USINTR has often appeared before or during recessionary periods because the Federal Reserve usually begins cutting rates when it sees economic weakness, financial stress, or disinflationary pressure building in the system. However, an important point is that rate cuts themselves are not automatically bullish. In early-cycle environments, rate cuts can support recovery. But in late-cycle environments, rate cuts may instead confirm that the Fed is responding to underlying economic deterioration.
In other words, the meaning of declining USINTR depends heavily on the wider macro context.
________________________________________
US10Y — Blue Line
US10Y represents the US 10-Year Treasury yield.
On the chart, this is shown as the blue line.
The US 10Y yield reflects longer-term expectations around inflation, growth, term premium, fiscal pressure, and bond-market risk. Prior to several recessionary periods, the US 10Y yield either increased, remained elevated, or failed to decline as quickly as the Federal Reserve policy rate. This is important because if the Fed is cutting rates while the 10Y yield remains elevated, financial conditions may not loosen as much as the policy rate alone would suggest.
In other words, declining short-term rates do not necessarily mean the broader economy is receiving relief if long-term yields remain high.
This creates a potentially stressful macro configuration: the Fed is trying to ease, but the long end of the bond market is not fully cooperating. That type of divergence can signal persistent inflation concerns, fiscal stress, bond-market resistance, or a loss of confidence in the ability of rate cuts alone to stabilize the system.
________________________________________
USIRYY — Red Line
USIRYY represents the US inflation rate year-over-year.
On the chart, this is shown as the red line.
Inflation is critical in this comparison because it determines how much flexibility the Federal Reserve actually has. If inflation is low and falling, the Fed can cut rates aggressively without much conflict. But if inflation is rising or remains sticky while growth begins to weaken, the Fed faces a much more difficult policy environment. Historically, several recessionary environments were preceded by or accompanied by periods where inflation pressures remained problematic even as the economy was weakening. That creates a difficult “policy trap”: cutting rates may be necessary because growth is weakening, but cutting too much may risk reigniting inflation or weakening confidence in the currency and bond market. In this chart, the red USIRYY line is therefore important because rising inflation pressure can reduce the effectiveness of falling policy rates.
________________________________________
USCBBS — Purple Line
USCBBS represents the US Commercial Bank Balance Sheet.
On the chart, this is shown as the purple line.
This indicator helps show the size of commercial banking-sector balance sheets.
An increase in USCBBS can reflect expanding banking-sector assets, liquidity support, credit-system changes, or balance-sheet growth within the financial system.
The key point is not that a rising commercial bank balance sheet is automatically bearish. In many environments, balance-sheet expansion can be supportive.
However, in the context of recession analysis, a rising USCBBS becomes more interesting when it occurs alongside: falling policy rates, elevated long-term yields, and rising inflation pressure.
That combination can suggest that liquidity or balance-sheet expansion is occurring not because the economy is entering a clean growth phase, but because the system may be requiring more support, more credit accommodation, or more balance-sheet absorption. This is especially important after 2019 and 2020, where the purple USCBBS line increased significantly and has remained structurally elevated compared to previous cycles.
________________________________________
Historic Recession Pattern
Across several historic recession windows, the same general structure can be observed:
Prior to the 1990 recession
US10Y and USIRYY increased while USINTR also moved higher into the late-cycle period. This reflected a classic tightening/inflation-pressure environment, where elevated rates and inflation eventually contributed to macro stress.
Prior to the 2001 recession
US10Y and USIRYY increased while USINTR moved lower. This was a different type of setup.
The Fed began easing, but the broader macro backdrop still contained inflation/yield pressure. This suggested that cutting short-term rates did not immediately remove stress from the system.
Prior to the 2008 recession
A similar pattern appeared again. US10Y and USIRYY increased while USINTR moved lower.
This was particularly important because the Fed had already begun responding to economic and financial stress, yet the system continued moving toward recession.
Again, the decline in policy rates was not a clean bullish signal. Instead, it reflected the Fed reacting to deteriorating conditions.
Prior to the 2020 recession
US10Y and USIRYY increased while USINTR remained lower compared to the preceding tightening phase.The 2020 recession was unique because of the external shock, but the macro system was already showing signs of vulnerability before the recession formally began.
The USCBBS line also became highly relevant from 2019 onward, as the commercial banking balance sheet began rising significantly.
________________________________________
Current Setup
Currently, the chart shows another potentially important alignment:
USIRYY, US10Y, USINTR, and USCBBS are aligning in a manner that resembles prior pre-recessionary or recession-adjacent macro structures. The current configuration is notable because: USINTR has declined, suggesting the Federal Reserve is no longer in a pure tightening phase. US10Y remains elevated, meaning long-term yields are still applying pressure to the economy, borrowers, valuations, housing, credit, and fiscal sustainability. USIRYY has increased, showing that inflation pressure has not fully disappeared. USCBBS has been rising again since December 2025, suggesting renewed expansion or support within the commercial banking balance-sheet structure. The important point is the interaction between these indicators.
If policy rates are falling but long-term yields remain elevated, then monetary easing may not translate into broad relief. If inflation is rising at the same time, then the Fed may have less room to cut aggressively. And if commercial bank balance sheets are expanding during this same window, it may suggest that the financial system is already moving into a more defensive or support-dependent phase. This does not mean a recession must happen immediately.
But historically, this type of alignment has not been a clean “risk-on” macro signal. It has often appeared when the economy was transitioning from late-cycle expansion into stress, slowdown, or recession.
________________________________________
Why This Pattern Matters
A common mistake in recession analysis is to focus on one indicator in isolation.
For example: Falling rates can look bullish. Rising bank balance sheets can look supportive.
Elevated yields can look like confidence in growth. Inflation can look like nominal strength.
But when all of these appear together, the interpretation changes. The structure becomes more complex. The Fed may be easing, but the bond market may still be tight. Inflation may be rising, limiting policy flexibility. Commercial bank balance sheets may be expanding, but not necessarily because the economy is healthy. This is why the combined alignment matters more than any single line on the chart. The recessionary signal is not one isolated indicator.
The signal is the macro contradiction between them.
________________________________________
Relationship to My FCBI Indicators
I originally intended to publish this chart with my custom FCBI indicators included.
However, because the analysis contained my custom FCBI scripts, TradingView would not allow the chart idea to be published in that form. For that reason, I removed the custom FCBI indicators from this version so that the recession comparison study could be published.
Users can still apply my FCBI indicators separately to perform a deeper version of this analysis.
The FCBI indicators are designed to measure the relationship between financial conditions and inflation pressure. In simple terms, they help assess whether financial conditions are acting as a brake or whether they are becoming too loose relative to inflation.
This matters because recessions often emerge not simply from high rates or low rates, but from the interaction between: inflation pressure, bond yields, policy rates, liquidity conditions, and the broader financial system. The FCBI framework is therefore useful as a separate overlay because it can help identify when financial conditions are tightening, loosening, or diverging from the inflation backdrop.
In this chart, even without the FCBI indicators attached, the same macro logic can still be observed through the relationship between USINTR, US10Y, USIRYY, and USCBBS.
________________________________________
Conclusion
The current macro setup does not confirm a recession by itself. However, the alignment between: declining USINTR, elevated US10Y yields, rising USIRYY, and rising USCBBS
is worth monitoring closely because similar configurations have appeared before or around previous US recessions. The key takeaway is that falling policy rates are not automatically bullish when long-term yields remain elevated, inflation begins rising again, and commercial bank balance sheets expand. Instead, that combination may suggest that the economy is entering a more fragile phase, where the Federal Reserve is attempting to ease while the broader financial system remains under pressure. For now, this chart should be viewed as a macro warning structure rather than a recession call.
The signal is not certainty.
The signal is alignment.
And historically, this type of alignment has often deserved attention.
$USUR - U.S Unemployment Rate (June/2026)ECONOMICS:USUR
June/2026
source: U.S. Bureau of Labor Statistics
- The US unemployment rate dropped to 4.2% in June 2026, down from 4.3% in May and below expectations, as many people left the workforce.
The number of unemployed fell by 213,000 to 7.09 million, while total employment declined by 507,000 to 162.26 million.
The labor force contracted by 720,000 to 169.36 million, with the participation rate falling to 61.5%, its lowest since March 2021.
The employment rate also dipped to an over four-year low of 59.0%.
The broader U-6 unemployment rate, which includes discouraged and underemployed workers, decreased to 7.9% from 8.1%. Navigating Markets During Record-Low U.S. Consumer Sentiment US consumer sentiment has registered its lowest point in history.
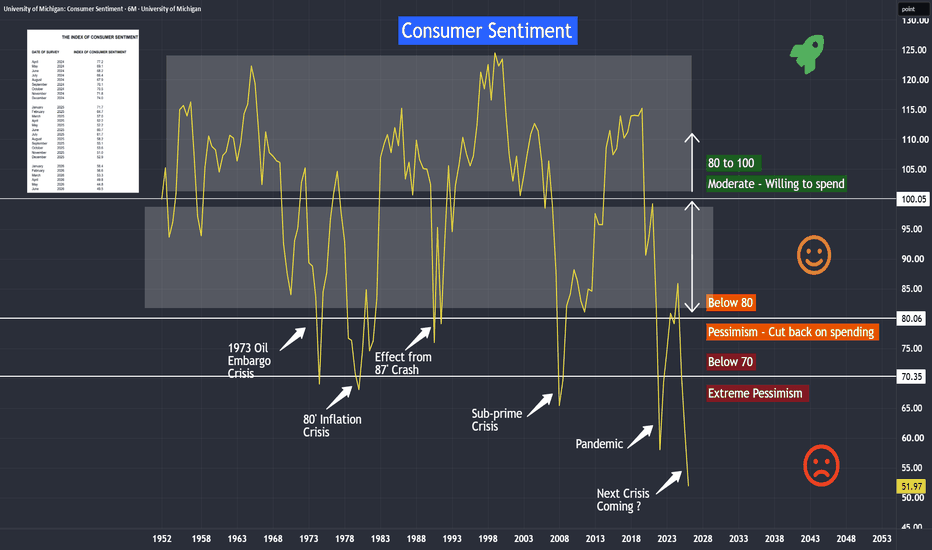
Looking closer, its last three readings were below the 50 level: 49.8 in April, 44.8 in May, and 49.5 in June.
Since the 1950s, consumer sentiment has stayed generally above the 80 level around 45% of the time, and above the 100 level another 45% of the time.
What about the remaining 10% of the time?
Whenever it drops below the 80 level, we historically see various economic crises.
Today, it stays well below the 70 level, so what does this mean? In this post, I will share how I am managing these emerging risks and how to determine whether a deeper correction in the US stock market is approaching.
Micro E-mini Nasdaq-100 Index Futures and Options
Ticker: MNQ
Minimum fluctuation:
0.25 index points = $0.50
Disclaimer:
• What presented here is not a recommendation, please consult your licensed broker.
• Our mission is to create lateral thinking skills for every investor and trader, knowing when to take a calculated risk with market uncertainty and a bolder risk when opportunity arises.
CME Real-time Market Data help identify trading set-ups in real-time and express my market views. If you have futures in your trading portfolio, you can check out on CME Group data plans available that suit your trading needs www.tradingview.com
Short
Will the Fed Maintain the Status Quo?The Federal Reserve (Fed), now chaired by Kevin Warsh, recently announced a monetary policy decision and updated its macroeconomic projections. The Fed reiterated its 2% inflation target without explicitly signaling an upcoming interest rate hike.
Kevin Warsh’s Fed sought to reassure markets of its commitment to fighting inflation while refraining from following the rate hike implemented by the European Central Bank (ECB) in June.
Institutional finance is now deeply divided regarding the Fed’s monetary policy outlook. The Fed also confirmed that it continues its technical quantitative easing (QE), namely its short-term operations aimed at maintaining an adequate level of bank reserves.
Kevin Warsh highlighted several criteria that will be decisive in the coming weeks in determining whether an increase in the federal funds rate will be necessary. The price of oil and the evolution of US core PCE inflation will be key factors this summer when the Fed prepares for its September monetary policy meeting.
So how can investors form a well-reasoned opinion about what the Fed might do after the summer? I suggest closely monitoring the following four indicators:
• US crude oil price (WTI)
• US inflation rate as measured by core PCE (which should not exceed 3.3% this year)
• US 2-year Treasury yield
• Market expectations derived from federal funds futures traded on the Chicago Mercantile Exchange (CME FedWatch Tool)
The histogram below represents the annual US inflation rate according to the Core PCE Price Index. Core PCE is the Fed’s preferred inflation measure, and Kevin Warsh recently stated the objective of keeping core PCE below 3.3% throughout 2026.
The chart below, sourced from TradingView, also includes data from the CME FedWatch Tool, which provides market expectations regarding the Fed’s future monetary policy and federal funds rate decisions.
The chart below displays weekly Japanese candlesticks for US crude oil (WTI). Below $80, a technical normalization process has begun, but the bullish gap created on Monday, March 2, between $67 and $69 would need to be filled for a genuine return to the environment that prevailed before February 28, when the strikes against Iran began.
The chart below displays daily Japanese candlesticks for the US 2-year Treasury yield. As long as it remains above the Fed’s policy rate, the market considers it appropriate for the Fed to raise rates.
DISCLAIMER:
This content is intended for individuals who are familiar with financial markets and instruments and is for information purposes only. The presented idea (including market commentary, market data and observations) is not a work product of any research department of Swissquote or its affiliates. This material is intended to highlight market action and does not constitute investment, legal or tax advice. If you are a retail investor or lack experience in trading complex financial products, it is advisable to seek professional advice from licensed advisor before making any financial decisions.
This content is not intended to manipulate the market or encourage any specific financial behavior.
Swissquote makes no representation or warranty as to the quality, completeness, accuracy, comprehensiveness or non-infringement of such content. The views expressed are those of the consultant and are provided for educational purposes only. Any information provided relating to a product or market should not be construed as recommending an investment strategy or transaction. Past performance is not a guarantee of future results.
Swissquote and its employees and representatives shall in no event be held liable for any damages or losses arising directly or indirectly from decisions made on the basis of this content.
The use of any third-party brands or trademarks is for information only and does not imply endorsement by Swissquote, or that the trademark owner has authorised Swissquote to promote its products or services.
Swissquote is the marketing brand for the activities of Swissquote Bank Ltd (Switzerland) regulated by FINMA, Swissquote Capital Markets Limited regulated by CySEC (Cyprus), Swissquote Bank Europe SA (Luxembourg) regulated by the CSSF, Swissquote Ltd (UK) regulated by the FCA, Swissquote Financial Services (Malta) Ltd regulated by the Malta Financial Services Authority, Swissquote MEA Ltd. (UAE) regulated by the Dubai Financial Services Authority, Swissquote Pte Ltd (Singapore) regulated by the Monetary Authority of Singapore, Swissquote Asia Limited (Hong Kong) licensed by the Hong Kong Securities and Futures Commission (SFC) and Swissquote South Africa (Pty) Ltd supervised by the FSCA.
Products and services of Swissquote are only intended for those permitted to receive them under local law.
All investments carry a degree of risk. The risk of loss in trading or holding financial instruments can be substantial. The value of financial instruments, including but not limited to stocks, bonds, cryptocurrencies, and other assets, can fluctuate both upwards and downwards. There is a significant risk of financial loss when buying, selling, holding, staking, or investing in these instruments. SQBE makes no recommendations regarding any specific investment, transaction, or the use of any particular investment strategy.
CFDs are complex instruments and come with a high risk of losing money rapidly due to leverage. The vast majority of retail client accounts suffer capital losses when trading in CFDs. You should consider whether you understand how CFDs work and whether you can afford to take the high risk of losing your money.
Digital Assets are unregulated in most countries and consumer protection rules may not apply. As highly volatile speculative investments, Digital Assets are not suitable for investors without a high-risk tolerance. Make sure you understand each Digital Asset before you trade.
Cryptocurrencies are not considered legal tender in some jurisdictions and are subject to regulatory uncertainties.
The use of Internet-based systems can involve high risks, including, but not limited to, fraud, cyber-attacks, network and communication failures, as well as identity theft and phishing attacks related to crypto-assets.
Education 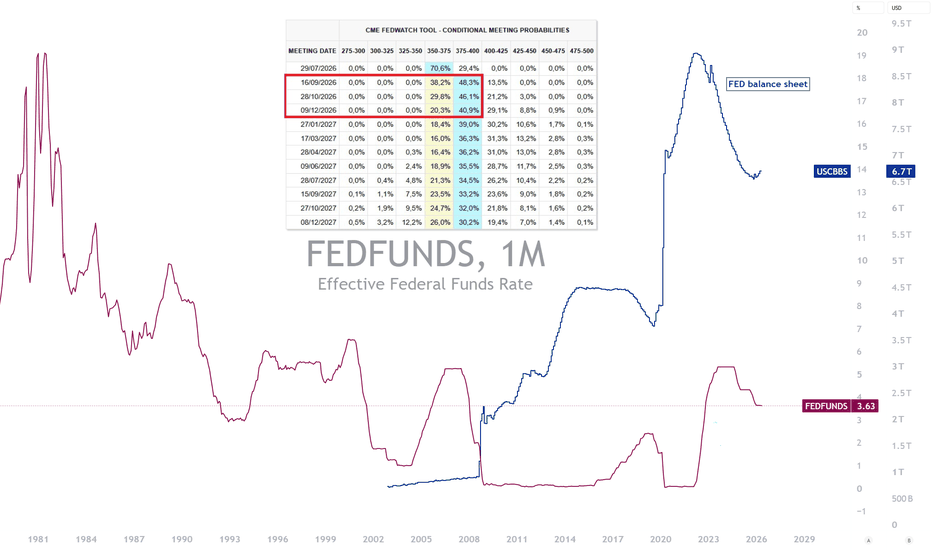
Is This Time Really Different?Is this time really that different? Is the semiconductor supercycle here to stay for years to come? Let's try to answer this question in light of current macro issues that continue to brew. I feel that we are close to reaching an inflection point, something has to give.
There are several danger signs all investors must be aware of.
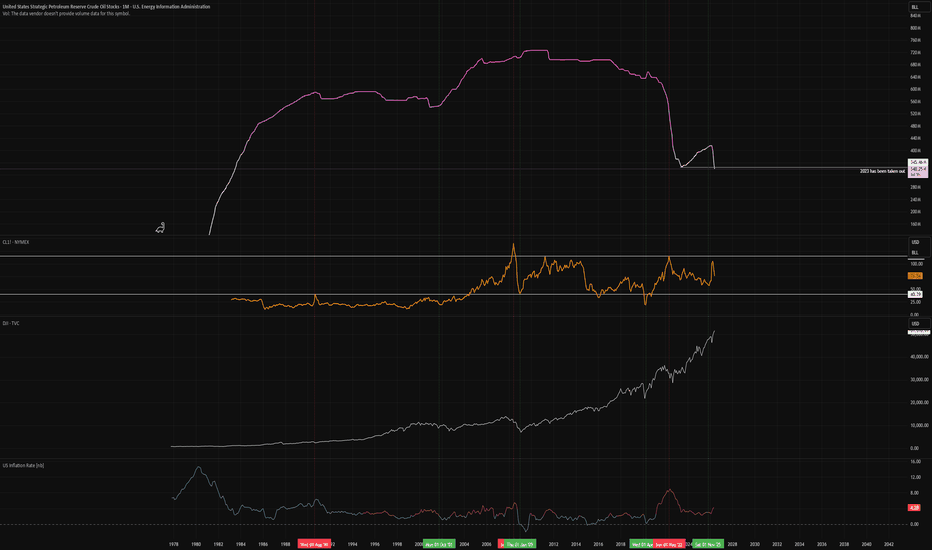
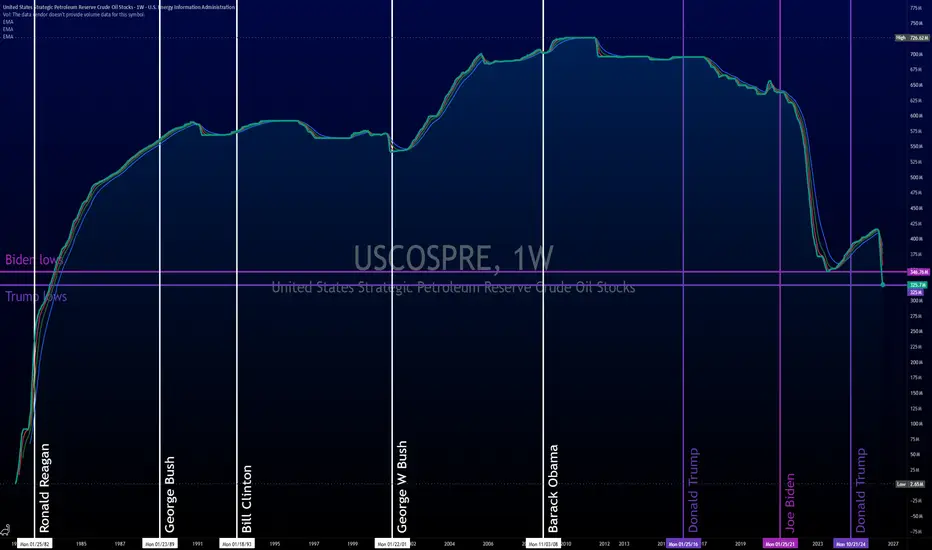
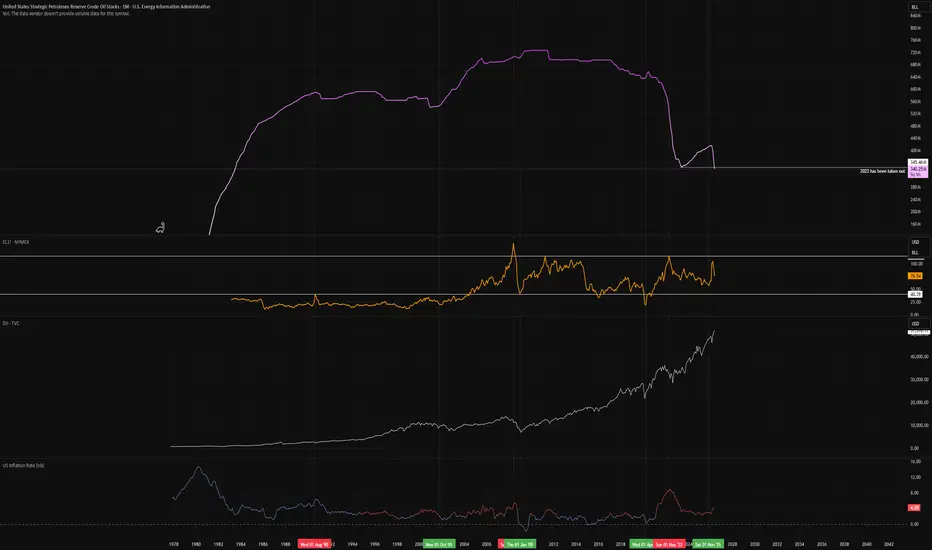
1. The market is currently treating energy stability as a given, but look at the US strategic oil reserves, we have broken the recent low and approaching 1983 levels of oil inventories in the US.
2. We’ve nuked four decades of energy security in a couple of years.The "Energy Tax" Compression: The DJI is at all-time highs while our physical safety net (the SPR) is at a floor we haven't seen since the Reagan era. The markets are priced for perfection.
3. If oil prices spike— and they will now that the Strait is shut and reserves are at historical lows, there’s no cushion left to absorb shocks—that becomes an immediate, unavoidable industrial tax. Corporate margins don't just "shrug off" a 20% spike in transport and heating costs; they contract.
4. Inflation is baked in, not transitory. We’re past the point where inflation is just a supply chain glitch. Because the SPR is empty, the government can't flood the market to cool down prices. Energy costs are now a permanent, structural component of the inflation basket.
5. The DJI is essentially a house built on an energy swamp; as long as that energy line stays volatile, the index’s multiple has nowhere to go but down.
The alternative thesis? Oil’s "Synthetic Floor"If you’re wondering why oil is the only asset that makes sense right now, it’s because the government effectively turned itself into a long-term buyer. The SPR is at the 1983 Level. The U.S. government has effectively emptied the till. They are no longer the market maker that can suppress prices, they are now the buyer of last resort who must replenish those stocks. This creates a hard price floor. Any significant dip in CL1! will trigger a buy the dip campaign by the administration.
In the 2010s, we had the luxury of low volatility because the purple SPR line was high. That era is dead. Because there’s no buffer, any news out of the Strait of Hormuz or elsewhere sends oil futures into a frenzy. For energy producers, this volatility is the new premium. When the government can’t suppress the price, the market finds its own reality—and that reality is getting tighter by the week.
Not financial advice. Manage your risk according to your strategies. I know what I am doing, what are you doing about all these issues? Short