$GBIRYY - U.K Inflation Rate (July/2026)ECONOMICS:GBIRYY 2.9%
July/2026 +0.3%
source: Office for National Statistics
- The UK’s annual inflation rate rose to 2.9% in July 2026,
the highest in four months, from 2.6% in June and in line with market expectations.
The largest upward contribution came from housing and household services (4.1% vs 2.7% in June), reflecting the 13% hike in Ofgem’s energy price cap that took effect last month.
Gas prices surged 14.7%, the biggest increase since October 2022, while electricity prices rose 3.6%.
Prices also rebounded for furniture and household goods (1.0% vs -0.2%) and clothing and footwear (0.5% vs -0.5%), while inflation increased for alcohol and tobacco (2.5% vs 2.1%) and health (3.7% vs 2.5%).
Meanwhile, transport inflation slowed (3.6% vs 5.7%) due to lower motor fuel prices, particularly diesel.
The average price of diesel fell by 8.8 pence per litre between June and July 2026. Food inflation also eased to 1.3% from 1.7%. On a monthly basis, CPI inflation increased 0.3%, matching market forecasts and following a 0.1% rise in June.
“data dependent” Fed, decisive figures due before September 16Kevin Warsh’s Federal Reserve kept monetary policy unchanged at its latest monetary policy meeting in July. Of the 12 FOMC members, 9 voted to maintain the current policy stance, while 3 voted for a rate hike due to the rebound in headline inflation driven by higher oil prices.
However, the majority opted to leave policy unchanged because underlying inflation remains stable for the time being (Trimmed Mean PCE and Core PCE), while Core CPI even declined in June. Nevertheless, as long as the geopolitical situation remains challenging and oil prices do not move sustainably back below the $70–75 range, the risk of additional inflationary pressure remains.
The debate is therefore wide open regarding the decision the Federal Reserve will make at its next monetary policy meeting on Wednesday, September 16. Before the US midterm elections on Tuesday, November 3, there will also be another monetary policy decision on Wednesday, October 28.
September 16 and October 28 are therefore the two key dates surrounded by significant uncertainty heading into the autumn. Will the Federal Reserve be able to maintain its current policy stance, or will it be forced to raise the federal funds rate in order to preserve its credibility in the fight against inflation?
The answer to this question will depend on the upcoming releases of several key US macroeconomic indicators, particularly inflation and labor market data.
Among all the economic releases due before September 16, the most important will be the evolution of core inflation, namely Core PCE and Core CPI. If both indicators remain under control, stable or even edge slightly lower, the Federal Reserve will be able to keep monetary policy unchanged.
The chart below shows the US federal funds rate, the Federal Reserve's balance sheet, and the market-implied probability of future Fed action according to the CME FedWatch Tool. At this stage, the probability of the Fed raising interest rates on September 16 is currently the dominant scenario.
Conversely, a renewed acceleration in either Core PCE or Core CPI would represent a worrying signal for FOMC members. In such a scenario, the central bank could conclude that inflationary pressures are no longer confined to the energy sector but are beginning to spread more broadly throughout the US economy. Financial markets would then quickly revise their interest rate expectations, potentially supporting the US dollar while pushing Treasury yields higher.
The labor market will also be a decisive factor. As long as job creation remains solid, the unemployment rate stays close to its lows, and wage growth remains strong, the Federal Reserve will retain sufficient room to maintain a restrictive policy bias if necessary. Conversely, clearer signs of labor market weakness would strengthen the arguments of the more dovish members of the FOMC.
The coming weeks will therefore be decisive. The releases of the CPI, PPI, PCE and employment data will shape financial market expectations and determine whether the Federal Reserve can genuinely remain "data dependent" or whether it will be forced to resume its monetary tightening cycle as early as the September 16 meeting.
The table below presents the major macroeconomic releases that will influence the Federal Reserve's monetary policy decision on Wednesday, September 16.
DISCLAIMER:
This content is intended for individuals who are familiar with financial markets and instruments and is for information purposes only. The presented idea (including market commentary, market data and observations) is not a work product of any research department of Swissquote or its affiliates. This material is intended to highlight market action and does not constitute investment, legal or tax advice. If you are a retail investor or lack experience in trading complex financial products, it is advisable to seek professional advice from licensed advisor before making any financial decisions.
This content is not intended to manipulate the market or encourage any specific financial behavior.
Swissquote makes no representation or warranty as to the quality, completeness, accuracy, comprehensiveness or non-infringement of such content. The views expressed are those of the consultant and are provided for educational purposes only. Any information provided relating to a product or market should not be construed as recommending an investment strategy or transaction. Past performance is not a guarantee of future results.
Swissquote and its employees and representatives shall in no event be held liable for any damages or losses arising directly or indirectly from decisions made on the basis of this content.
The use of any third-party brands or trademarks is for information only and does not imply endorsement by Swissquote, or that the trademark owner has authorised Swissquote to promote its products or services.
Swissquote is the marketing brand for the activities of Swissquote Bank Ltd (Switzerland) regulated by FINMA, Swissquote Capital Markets Limited regulated by CySEC (Cyprus), Swissquote Bank Europe SA (Luxembourg) regulated by the CSSF, Swissquote Ltd (UK) regulated by the FCA, Swissquote Financial Services (Malta) Ltd regulated by the Malta Financial Services Authority, Swissquote MEA Ltd. (UAE) regulated by the Dubai Financial Services Authority, Swissquote Pte Ltd (Singapore) regulated by the Monetary Authority of Singapore, Swissquote Asia Limited (Hong Kong) licensed by the Hong Kong Securities and Futures Commission (SFC) and Swissquote South Africa (Pty) Ltd supervised by the FSCA.
Products and services of Swissquote are only intended for those permitted to receive them under local law.
All investments carry a degree of risk. The risk of loss in trading or holding financial instruments can be substantial. The value of financial instruments, including but not limited to stocks, bonds, cryptocurrencies, and other assets, can fluctuate both upwards and downwards. There is a significant risk of financial loss when buying, selling, holding, staking, or investing in these instruments. SQBE makes no recommendations regarding any specific investment, transaction, or the use of any particular investment strategy.
CFDs are complex instruments and come with a high risk of losing money rapidly due to leverage. The vast majority of retail client accounts suffer capital losses when trading in CFDs. You should consider whether you understand how CFDs work and whether you can afford to take the high risk of losing your money.
Digital Assets are unregulated in most countries and consumer protection rules may not apply. As highly volatile speculative investments, Digital Assets are not suitable for investors without a high-risk tolerance. Make sure you understand each Digital Asset before you trade.
Cryptocurrencies are not considered legal tender in some jurisdictions and are subject to regulatory uncertainties.
The use of Internet-based systems can involve high risks, including, but not limited to, fraud, cyber-attacks, network and communication failures, as well as identity theft and phishing attacks related to crypto-assets.
Compare Credit Growth and Spending Without Mixing UnitsA macro release can look directional because one percentage is large. The first task is to preserve the measurement.
For consumer credit and spending, keep three rows:
1. Outstanding credit growth — often reported at a seasonally adjusted annual rate.
2. Retail-sales growth — a month-over-month change covering retail and food services.
3. Personal-consumption growth — a broader month-over-month measure covering goods and services.
Do not compare the numbers until each row records its unit, coverage, release time, revision status, and price-adjustment status.
A practical neutral workflow:
• mark the initial release;
• preserve the prior month and later revisions;
• check whether income and real spending confirm the credit move;
• add credit-quality or debt-service measures;
• write the next confirming and invalidating event before taking a position.
For the June 2026 example, revolving credit accelerated after a May decline, while retail sales and personal consumption increased more modestly on a monthly basis. That is evidence of different measurement behavior, not by itself a bullish or bearish signal.
The tutorial is invalidated as a demand interpretation if credit rises while real spending and income stall or credit quality deteriorates. It gains support if the measures strengthen together across subsequent releases.
Educational information only; not investment advice. Macro data are aggregate, preliminary, and revisable. Trading involves risk of partial or total loss.  Education
GOAT Of All Bulls Of All Times (and Debt is FIFA)🏆 GOAT Of All Bulls Of All Times 🐐⚽but Debt is FIFA. ⚽
Football has given us endless debates.
Messi.
Maradona.
Pelé.
Who is the GOAT? ( You ask me? It's Messi 🐐⚽🏆)
Everyone has an opinion.
When it comes to macroeconomics, however, I think the answer is much simpler.
Inflation is the GOAT of all bulls. 🏆🏆🏆🏆🏆🏆🏆
Some of you may remember that I have been saying this for years.
🏆 GOAT Of All Bulls Of All Times
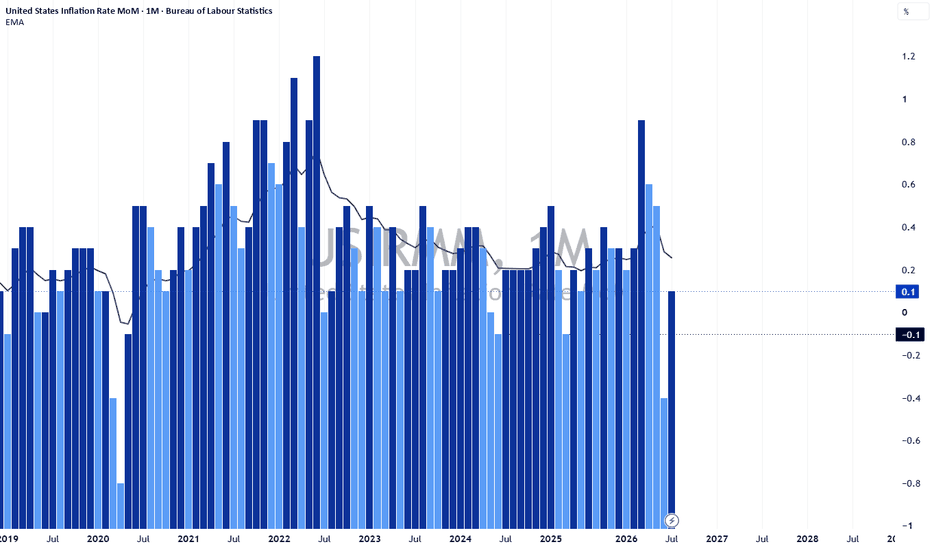
🏆 CPI: Greatest Bull Of All Times
📈 Inflation Report Today: Consumer Price Index Accelerating
Years later, I'm still looking at the very same match.
Only now, we've played a few more seasons.
Look carefully at the chart.
After the Global Financial Crisis...
After COVID...
After unprecedented money printing...
After trillions in government spending...
After aggressive interest-rate hikes...
The long-term trend is still pointing in the same direction.
Inflation has slowed recently.
But don't confuse a correction with the end of the match.
History reminds us that meaningful declines in CPI have often appeared during periods of economic stress.
COVID.
Different crises.
The same scoreboard.
Now here's where the story gets even more interesting.
People often ask me why stock markets continue making new all-time highs.
Why has real estate appreciated so much over the years?
Why do productive assets seem to become more expensive decade after decade?
Because inflation doesn't just increase the price of groceries.
It changes the value of money itself.
If your currency gradually loses purchasing power, investors naturally look elsewhere.
-Stocks.
-Businesses.
-Real estate.
Anything capable of preserving or growing wealth over time.
In other words...
Asset prices don't only rise because companies become more valuable—they also rise because the measuring stick itself keeps changing.
And that brings me to another player in this match.
If inflation is the GOAT but hey:
Debt is FIFA. ⚽
-Debt writes the rules.
-Debt keeps the tournament alive.
Every major crisis over the past two decades has eventually been answered with more borrowing, more liquidity, or more stimulus.
-Debt feeds liquidity.
-Liquidity fuels inflation.
-Inflation pushes nominal asset prices higher.
-The cycle continues.
Today, stocks trade around record highs.
Yet there is surprisingly little euphoria.
It's almost as if new highs have become normal.
Maybe that's because we've all become accustomed to living in a world where debt keeps expanding, liquidity eventually returns, and inflation quietly keeps moving the goalposts.
Could this time be different? Maybe.
The latest pullback in CPI deserves attention.
History tells us that these moments matter.
Whether this is simply a healthy normalization or the beginning of something much larger remains to be seen.
Eternal Wisdom 📜
Until then remember the ancient Greek philosophy tips, so here are 10 Delphic maxims related to 'money and wealth':
ΠΛΟΥΤΕΙ ΔΙΚΑΙΩΣ — Gain wealth through just means.
ΔΙΚΑΙΩΣ ΚΤΩ — Build fortune lawfully.
ΠΟΝΕΙ ΜΕΤ’ ΕΥΚΛΕΙΑΣ — Let your labor be honorable.
ΠΛΟΥΤΩ ΑΠΟΣΤΕΙ — Do not become enslaved by wealth.
ΧΡΩ ΧΡΗΜΑΣΙ — Use your possessions wisely.
ΔΑΠΑΝΩΝ ΑΡΧΟΥ — Control your expenses.
ΚΤΩΜΕΝΟΣ ΗΔΟΥ — Take rightful satisfaction in what you earn.
ΕΡΓΑΖΟΥ ΚΤΗΤΑ — Work for what is worth having.
ΙΔΙΑ ΦΥΛΑΤΤΕ — Protect what is rightfully yours.
ΤΟ ΣΥΜΦΕΡΟΝ ΘΗΡΩ — Pursue what benefits your household and community.
(wanna be wise? I propose you go check the rest of them. 147 in total, starting with 'Know thyself and everything in moderation' being the most famous/important ones
The best investors don't just watch prices—they study the system that creates those prices. Zoom out, connect the dots, and you'll often understand tomorrow better than those who only focus on today's headlines.
One Love,
The FXPROFESSOR 💙
Long 
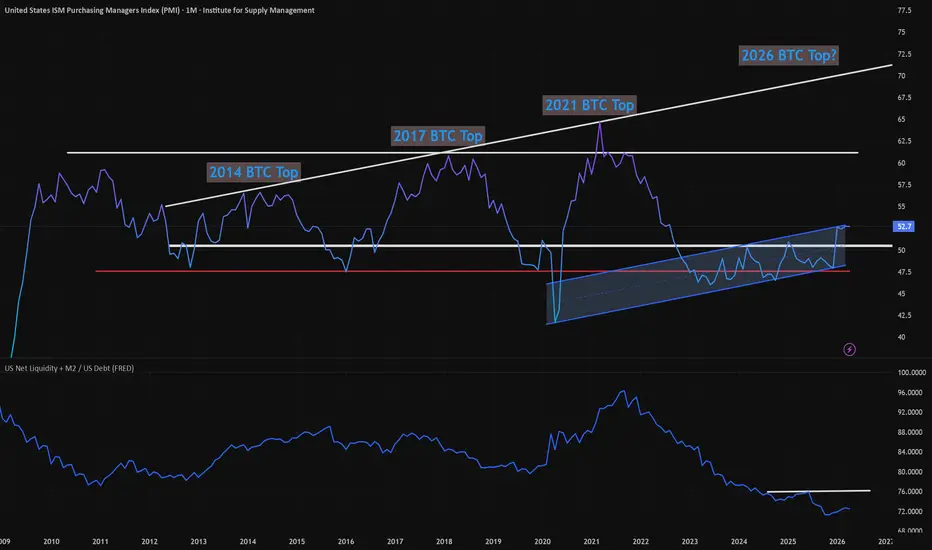
2026 ATH Rally? PMI and US Net Liquidity + M2 / US DebtIn this study, we analyze the ISM Purchasing Managers Index which while in an uptrending parallel channel of sorts, it also shows that the 2025 'Bull Run' never got close to projected 'top' levels.
Almost as if we never had the 2025 bull market top rally. Could it just be DELAYED?
While The ISM Manufacturing PMI is holding above the critical 50 threshold indicates continued economic expansion, which historically correlates with risk-on sentiment in crypto markets.
At 52.7 (+0.57%), we're seeing steady manufacturing growth that could support Bitcoin's current consolidation phase around $79,400, but NOT a rip-roaring market rally to new ATH.
Also, we can see from the US Net Liquidity + M2 / US Debt chart (lower frame) that we also didn't get the correlating rise in liquidity we usually see while building a new ATH on Bitcoin.
In fact, the prior floor for this back in 2011, now seems to be acting as resistance, rejecting in mid-2025. This points to a weak economic picture, and we'd need to see this ratio improve.
Either by dramatically lowering our close to $40T in debt (not likely anytime soon) and/OR seeing the 'Money Printer Go Brrrr' again, with post Covid-like stimulus and ideally lower interest rates and inflation. (I'm not a Macro guy, so don't beat me up here if I'm off a bit).
Either way, this chart tells the 'hidden story' of why we didn't see the massive pump to $150k - $200k Bitcoin in the last Bull Run...
But with improving economic and regulatory conditions... Could we?
For example, if / when the following tailwinds pick up:
- Final approval and signing of the Clarity Act into Law
- Easing of Middle-East tensions and an end to the Iran war
- New Fed-Chief approval and at least signaling lower rates later in 2026
- Fed QE and money printing to stimluate the economy
- ETF inflows continuing to increase and Strategy strong buying
- Potentially 're-valuing' Gold to current prices and selling enough to lower the US Debt
We could get our 2nd phase of the bull-cycle into 2026-2027.
I'd also like to point out that typically the cycle lows don't fully resolve and turn higher until 13 months after the previous highs, which points toward the Sept / October 2026 time-frame.
Cycle theory also points to this time-frame for the 4-year cycle lows to be in.
Key observations from this analysis:
- PMI above 50 typically supports risk asset rallies
- Current reading suggests economic stability vs recession fears
- Manufacturing strength often precedes crypto institutional inflows
- Historical correlation shows BTC tends to rally 2-4 weeks after sustained PMI strength
- Improved economic conditions per above could turn things around by Sept / Oct 2026
Scenarios:
Bullish Case: Sustained PMI above 52 could drive BTC toward $85k-$90k resistance
Bearish Case: PMI reversal below 50 would likely accelerate the correction to $70k support
This economic backdrop, combined with my previous technical analysis showing potential 50% corrections, creates an interesting divergence worth monitoring closely.
The next PMI release on June 1st will be critical for confirming this trend.
What's your take on how economic indicators should factor into crypto analysis?
Drop your thoughts below. FED vs. Labor Market: Is Unemployment Signalling a Recession?The Data:
UNRATE (Total Unemployment Rate): The standard measure of unemployed workers actively seeking jobs as a percentage of the total labor force.
NROU (Non-Cyclical Unemployment Rate): The baseline rate of natural unemployment (structural and frictional), independent of the economic cycle.
USREC (NBER Recession Indicator): A binary indicator where 1 signifies an active recession and 0 signifies expansion.
Historical Correlation:
Historically, the relationship between UNRATE and NROU serves as a reliable early-warning indicator for US recessions (USREC):
The Bullish Expansion Phase: During an economic boom, UNRATE drops below NROU. This signals an overheated, tight labor market.
The Recession Signal: Every time UNRATE turns upward and crosses above NROU, the US economy enters a contraction phase.
The Historical Rule: A sustained upward crossover of UNRATE over NROU has reliably preceded or coincided with every major US recession on record.
What to Watch in the Coming Weeks & Fed Conflict:
As upcoming monthly labor data prints, the gap between UNRATE and NROU remains in focus—setting up a major policy conflict with the Federal Reserve.
The Fed Conflict: Recent Fed messaging remains hawkish on sticky inflation, keeping a potential rate hike on the table next month. However, a rising UNRATE approaching NROU points directly to hidden labour market decay.
Key Watch Item: Monitor if upcoming UNRATE prints continue an upward trend toward or above NROU. A multi-month sustained cross above NROU confirms structural economic weakness.
Potential Market Impacts:
The Forced Fed Pivot: A confirmed crossover overrides inflation hawkishness, forcing the Fed to abandon rate hikes and pivot aggressively to rate cuts.
Equities & Risk Assets: Rate hike expectations vanish, but growth fears drag down equity earnings forecasts, boosting defensive sectors.
FX Markets: Currency markets face volatility as policy expectations rapidly switch from hawkish hikes to dovish cuts.
What to Expect: If UNRATE stays below NROU, the Fed can maintain its inflation focus and higher-for-longer stance. If UNRATE breaks above NROU, expect a sharp market re-pricing from inflation fears to growth-recession reality.
$EUGDPQQ - Europe GDP (Q2/2026)ECONOMICS:EUGDPQQ
Q2/2026
source: EUROSTAT
- The Eurozone economy expanded by 0.4% in the second quarter of 2026, accelerating from flat growth in the previous quarter and beating market expectations of a 0.2% increase, according to preliminary estimates.
It marked the bloc's strongest quarterly expansion since the first quarter of 2025, as robust AI-related investment, solid government spending, and one-off factors helped offset the impact of the conflict in Iran and higher energy costs.
Year-over-year, the eurozone economic growth accelerated to 1% in the second quarter from a revised 0.5% three months earlier, also above expectations.
Among the largest euro area economies, Spain once again led growth, with GDP rising 0.7%, up from 0.6% in the first quarter and above forecasts. The Netherlands expanded by 0.4%, twice the expected pace, while France returned to growth with a 0.2% increase after a 0.1% contraction. Germany and Italy also grew by 0.2%, easing slightly from the previous quarter but exceeding market expectations.
Education 
$EUIRYY - E.U Interest Rates (July/2026)ECONOMICS:EUIRYY
July/2026
source: European Central Bank
- The European Central Bank left its key interest rates unchanged at its July meeting, following a 25bp increase in June, the first rate hike in three years, driven by rising energy prices and persistent inflationary pressures.
Since then, policymakers have struck a more cautious tone, adopting a "wait-and-see" approach as softer inflation, wage growth, economic activity, and inflation expectations have reduced the urgency for another move.
The ECB said the outlook for energy prices remains broadly in line with its June projections despite continued volatility, while warning that uncertainty remains high and the full inflationary impact of the energy shock has yet to emerge.
Policymakers also noted they will continue to monitor its broader effects on inflation and the economy. At the post-meeting press conference, ECB President Lagarde warned that the longer energy prices remain elevated, "the more likely they are to drive up broader inflation through indirect and second-round effects." JuNk BoNdS & The Sub Prime SPX ConnectionHola gente hermosa de este hermoso mundo!
All the market OG's talk of bonds and their importance. Heres a look into a big part of what they are telling you. I mean, they are the funding mechanism for the biggest fraudsters. It's all good though they don't have to report anything and can claim fake financials, just trust them and the alphabet boys.
Are private credit funds the speculators dream machine of this land cycle? Are they the REITs, Thrifts, Savings and Loans, and mortgage backed securities of past booms and busts? Are they the products which make it possible to legally rob banks? That’s been my theory for the past 3 years since I read about this booming high risk debt machine. Banks were just beginning to play a deeper role as reporting and restrictions were lifted and risk migrated to pensions, insurance companies, and private credit.
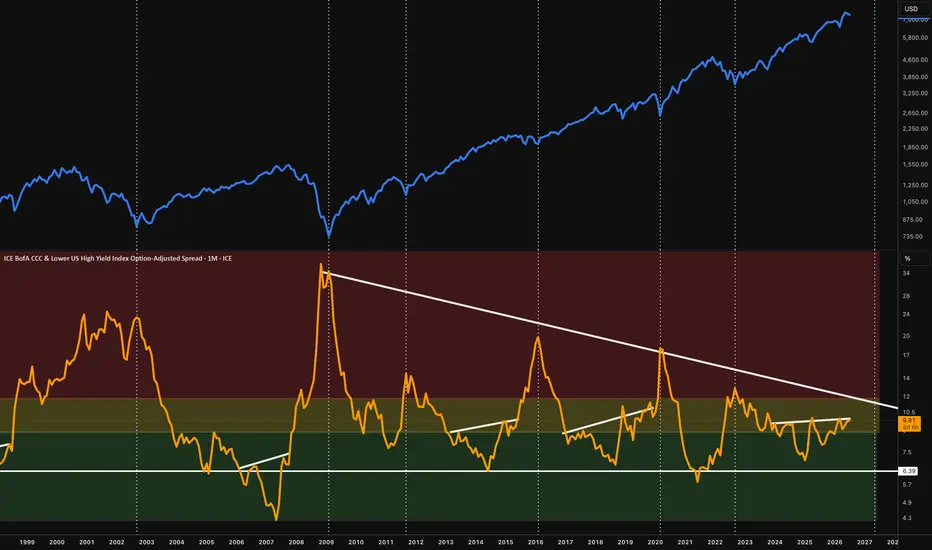
Today I’ll share a chart I find interesting. The junkiest junk bond yield spread which is like a credit risk oscillator once you add some regime thresholds. I’m comparing the CCC and lower OAS (orange) to the SPX (blue) on the 1 month chart.
The CCC & Lower OAS = The extra yield investors demand to hold the weakest junk bonds compared to US treasuries. The CCC is a rating for companies with very high default risk, and lower means it incorporates the junkiest of the junk. They are heavily indebted, fragile cash flow/distressed businesses, so naturally they are the first bonds to break when liquidity tightens.
OAS stands for option-adjusted spread = the yield spread over treasuries after removing distortions from call options (most junk bonds can be called) so as to isolate the true credit risk premium. I believe currently without adjusting for options it’s about 1% lower. So it seems OAS helps this metric lead better than a simple clean spread calculation.
I have green, yellow, and red colors highlighted over the CCC OAS spread which mark the regimes.
Green: Under 9% Buy backs active, easy credit, equity dips get bought, risk assets rise.
Yellow: 9%-12% weak companies struggle, market rallies are fragile, rotation out of risk assets begins.
Red:12% + Liquidity crisis, credit markets freezing, forced selling, equities continue down and bottom.
It’s breaking back into stressed territory highlighted in yellow, as its heading into a squeeze on this descending triangle. A break above 12% and the triangle we enter the true crisis regime, more downside in most cryptos and Stocks, then as the demanded rate tops out, historically this was the bottom in stocks.
I’m expecting investors to require a higher rate for holding an increasingly more risky product. The cracks are beginning to really surface now IMO. I’m not calling for a crisis, but I am calling for patience, and will be watching 12% on this series.
Peace love and prosperity to all!