Macro Data Dashboard Review - June 2026With the economy seemingly in a perpetual state of uncertainty this decade, I have decided to make sense of it myself, so I can filter out editorial and political spin. I am sharing my dashboard as an Idea to provide a snapshot at the time of writing for future comparison. Some of these indicators already have received extensive commentary, however I think the context they provide when combined offers a unique perspective, and can give a sharper understanding of major events as they unfold in the future. I will start by breaking down my comments on each indicator and then will give my broad analysis while trying to avoid too much future speculation.
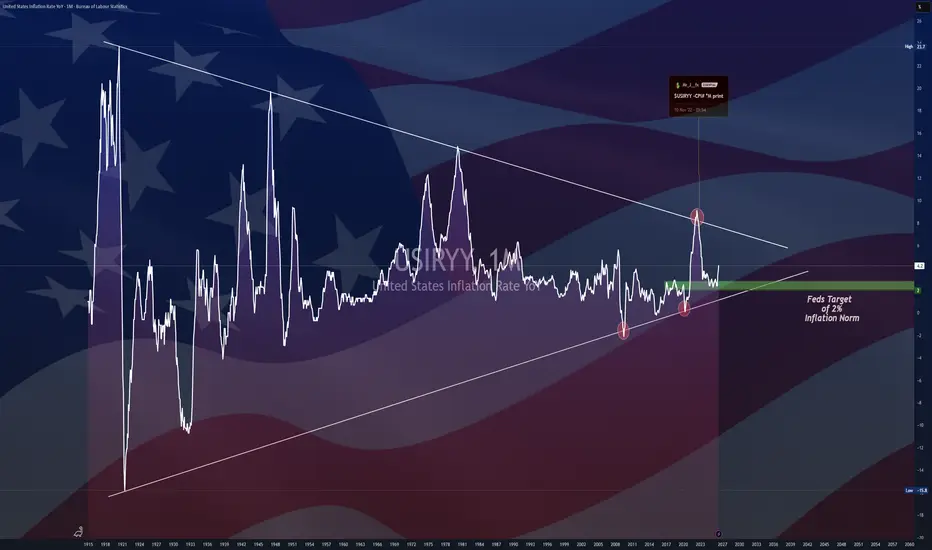
1. US Core PCE ECONOMICS:USCPCEPIAC - Inflation is still higher than the Fed’s target and above the historical baseline, while still lower than in 2021-2022. While it has been sticky, continued inflation persistence lacks the necessary tailwinds that led to the post-covid surge (Fed providing liquidity to bond market & interest rates at the bottom, which led to extreme YoY GDP growth). This matters little to the general public, who are still upset over cumulative price increases in recent years and above-average YoY inflation growth, especially in volatile categories like Food and Energy (which are not included in PCE).
2. Policy Tightness Gauge $ECONOMICS:USINTR-FRED:UNRATE - Low unemployment and elevated interest rates will persist until pressure in the labor market arises, which there are not current signs of.
3. Household Debt Service Payments FRED:TDSP - Compare today’s level to extremes in the mid/late 00’s and 2020. Households are not yet stretched and will likely have capacity to borrow more.
4. Personal Savings Rate FRED:PSAVERT - Individuals are saving below the 3-year average rate. Continued weakness could signal individuals have less capacity to absorb financial downturn.
5. Retail Sales YoY ECONOMICS:USRSYY - Current level is in line with healthy historical levels.
6. Temporary Worker Staffing FRED:TEMPHELPS - Below the 50-period average on the monthly chart and flattening out in recent months. Any significant changes here could be an early labor market indicator.
7. Average Hours Worked ECONOMICS:USAWH - Slightly below average, flattening, and aligned with average historical levels. I would consider this healthy.
8. Average Hourly Earnings ECONOMICS:USAHEYY - Elevated but flat. Wage growth was also an inflation driver at the start of the decade that is no longer a major factor.
9. Fed Balance Sheet Total Assets FRED:WALCL - New Fed Chair Warsh would like to see the balance sheet shrink, however the level remains high and it will be difficult to do so without causing bond yields to rise. Warsh was always a hawk until he sought the nod from the current administration, so we will see how he responds to bond market pressure if it continues.
10. ECONOMICS:USGDPYY - Healthy GDP growth.
11. Debt to GDP $ECONOMICS:USGD/ECONOMICS:USGDP - High and likely to continue growing without major policy changes that manage to both reduce the size of debt while keeping growth stable - a difficult task in today’s regime.
——
To summarize, what my indicators are telling me is that the economy is transitioning into a late-cycle phase but we are not quite there yet. Consumers have been resilient in the face of years of higher rates, and the labor market has cooled to allow GDP growth to remain healthy while blunting the strength of secondary inflation drivers.
Things are pretty balanced at the moment, so the question is what will change to create imbalance, which will force the Fed to change its stance? Will the Fed under Warsh’s leadership bend to political pressure to cut rates at the earliest sign of labor market pressure? Will consumers accept higher rates and continue to spend higher proportions of disposable income on debt payments, while saving less and less? Or will the Fed be forced to step in to calm the bond market in order to keep its own debt service payments at manageable levels (which will run counter to its fight against inflation)?
The biggest question of all is what the late-cycle stage of this cycle will look like. If I had to make an educated guess based on what I’m seeing today, I think this level of balance could continue for months or even years until certain areas are stretched to their extremes. I could see a scenario where consumers continue to borrow at high rates while keeping low personal savings, which will be stimulative to the economy until people can no longer afford the service payments. With the way things are headed in the US political cycle (right wing populism to left wing populism) this scenario fits the bill for a radical shift if it coincides with labor market instability.
I will keep checking this dashboard from time to time, since these indicators update slowly, and will post again whenever imbalances start to form, which based on what I’m seeing, and contrary to popular belief, could take a while.
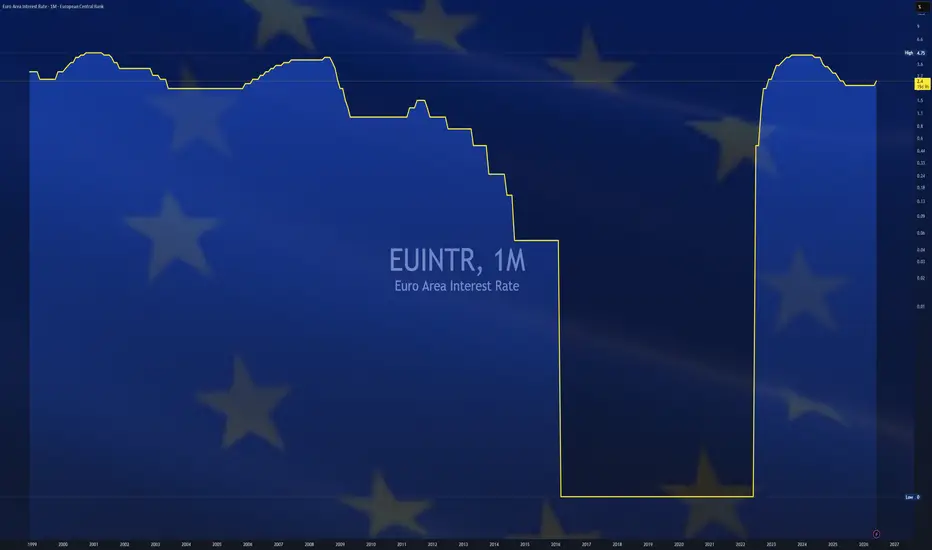
Why a Fed Rate Hike Is UnlikelyThe geopolitical situation since the end of February has completely reshaped expectations regarding the monetary policy of the U.S. Federal Reserve (Fed). The disruption of the Strait of Hormuz, the sharp rise in oil prices, natural gas, urea fertilizer, and industrial metals, along with the rebound in headline inflation, have led markets to shift from expecting cuts in the federal funds rate to anticipating rate hikes.
The U.S. 2-year Treasury yield is currently well above the Fed's policy rate, meaning the market believes the federal funds rate should be higher than its current level of 3.75%. However, the Fed has changed leadership in the meantime. Kevin Warsh is now the Chairman of the Fed, although Jerome Powell remains a voting member of the FOMC.
The chart below presents market expectations regarding the future path of Fed interest rates. These expectations have been dramatically altered since the end of February.
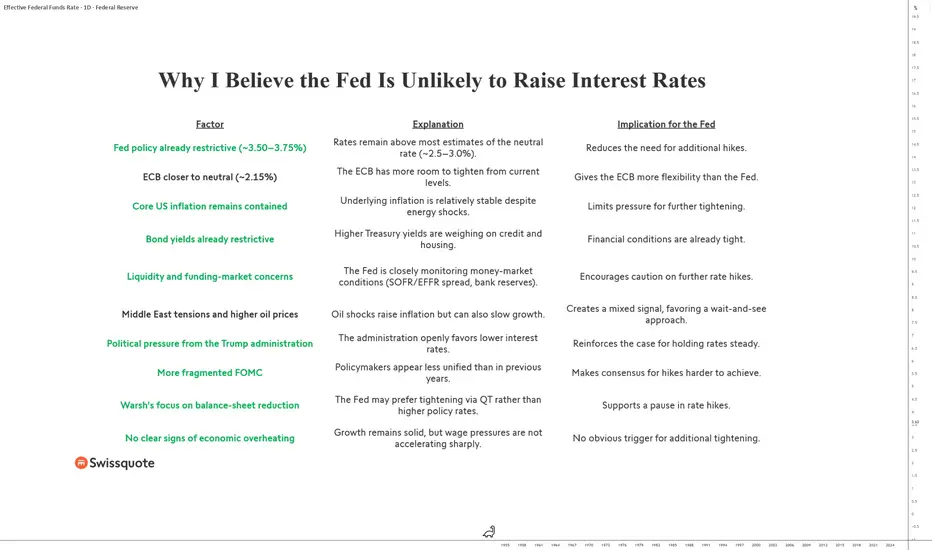
Despite these new market expectations, largely driven by the persistence of geopolitical tensions in the Middle East and therefore potentially reversible, I believe it is unlikely that Kevin Warsh's Fed will raise the federal funds rate this year, except in an extreme scenario.
Here are the reasons supporting this view:
First, the U.S. policy rate is already in restrictive territory. With the federal funds rate at 3.75%, monetary policy remains above most estimates of the neutral rate, generally considered to be between 2.5% and 3%. In other words, the Fed is already exerting a restraining effect on the economy and does not necessarily need to raise rates further to maintain restrictive financial conditions.
Second, underlying U.S. inflation remains relatively contained. While higher oil prices mechanically boost headline inflation, the Fed places greater emphasis on core inflation, which excludes food and energy. As long as core inflation remains under control, a preemptive rate hike appears difficult to justify.
The histogram below shows U.S. core inflation according to the CPI measure. Note that all economic data are available directly on TradingView.
Furthermore, U.S. bond yields have risen sharply in recent months. Long-term interest rates are already exerting significant pressure on credit markets, real estate, and investment activity. Part of the monetary tightening process is therefore being carried out directly by the market itself.
Finally, Kevin Warsh appears to favor reducing the Fed's balance sheet rather than raising interest rates again. Continuing quantitative tightening (QT) allows liquidity to be gradually withdrawn from the financial system and monetary conditions to be tightened without altering the policy rate. This approach seems more consistent in an environment where some liquidity pressures still persist in U.S. money markets.
Unless there is a sustained deterioration in core inflation, a wage-price spiral, or a loss of confidence in inflation expectations, the most likely scenario remains that the federal funds rate will stay at its current level for several more months.
The table below outlines the reasons why it is unlikely that the Fed, under the leadership of Kevin Warsh, will raise U.S. federal funds rates in the near term.
DISCLAIMER:
This content is intended for individuals who are familiar with financial markets and instruments and is for information purposes only. The presented idea (including market commentary, market data and observations) is not a work product of any research department of Swissquote or its affiliates. This material is intended to highlight market action and does not constitute investment, legal or tax advice. If you are a retail investor or lack experience in trading complex financial products, it is advisable to seek professional advice from licensed advisor before making any financial decisions.
This content is not intended to manipulate the market or encourage any specific financial behavior.
Swissquote makes no representation or warranty as to the quality, completeness, accuracy, comprehensiveness or non-infringement of such content. The views expressed are those of the consultant and are provided for educational purposes only. Any information provided relating to a product or market should not be construed as recommending an investment strategy or transaction. Past performance is not a guarantee of future results.
Swissquote and its employees and representatives shall in no event be held liable for any damages or losses arising directly or indirectly from decisions made on the basis of this content.
The use of any third-party brands or trademarks is for information only and does not imply endorsement by Swissquote, or that the trademark owner has authorised Swissquote to promote its products or services.
Swissquote is the marketing brand for the activities of Swissquote Bank Ltd (Switzerland) regulated by FINMA, Swissquote Capital Markets Limited regulated by CySEC (Cyprus), Swissquote Bank Europe SA (Luxembourg) regulated by the CSSF, Swissquote Ltd (UK) regulated by the FCA, Swissquote Financial Services (Malta) Ltd regulated by the Malta Financial Services Authority, Swissquote MEA Ltd. (UAE) regulated by the Dubai Financial Services Authority, Swissquote Pte Ltd (Singapore) regulated by the Monetary Authority of Singapore, Swissquote Asia Limited (Hong Kong) licensed by the Hong Kong Securities and Futures Commission (SFC) and Swissquote South Africa (Pty) Ltd supervised by the FSCA.
Products and services of Swissquote are only intended for those permitted to receive them under local law.
All investments carry a degree of risk. The risk of loss in trading or holding financial instruments can be substantial. The value of financial instruments, including but not limited to stocks, bonds, cryptocurrencies, and other assets, can fluctuate both upwards and downwards. There is a significant risk of financial loss when buying, selling, holding, staking, or investing in these instruments. SQBE makes no recommendations regarding any specific investment, transaction, or the use of any particular investment strategy.
CFDs are complex instruments and come with a high risk of losing money rapidly due to leverage. The vast majority of retail client accounts suffer capital losses when trading in CFDs. You should consider whether you understand how CFDs work and whether you can afford to take the high risk of losing your money.
Digital Assets are unregulated in most countries and consumer protection rules may not apply. As highly volatile speculative investments, Digital Assets are not suitable for investors without a high-risk tolerance. Make sure you understand each Digital Asset before you trade.
Cryptocurrencies are not considered legal tender in some jurisdictions and are subject to regulatory uncertainties.
The use of Internet-based systems can involve high risks, including, but not limited to, fraud, cyber-attacks, network and communication failures, as well as identity theft and phishing attacks related to crypto-assets.
 Education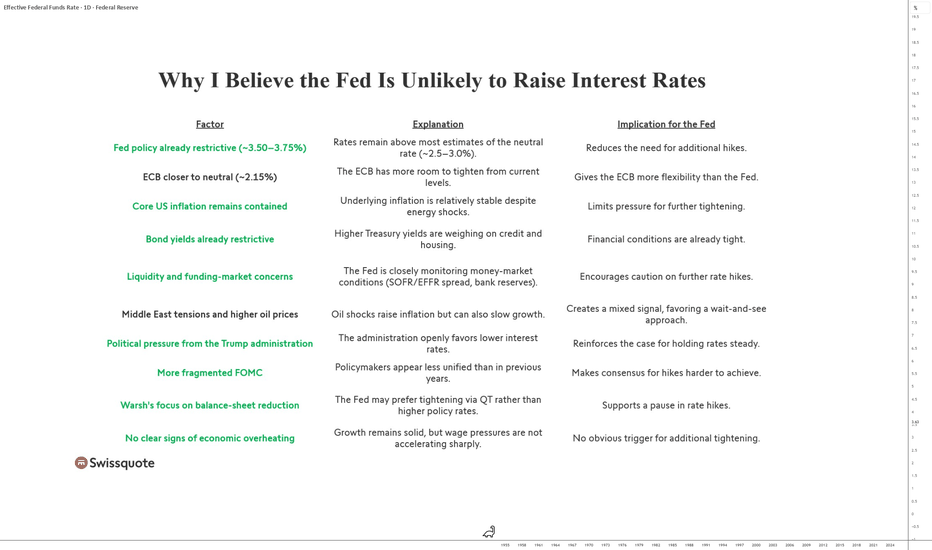
$CNIRYY - Chinese CPI Holds Steady (May/2026)ECONOMICS:CNIRYY
May/2026
source: National Bureau of Statistics of China
- China’s annual inflation held steady at 1.2% in May 2026, unchanged from the previous month but slightly below market expectations of 1.3%.
Non-food inflation edged higher (1.9% vs 1.8% in April), lifted by an acceleration in transport costs (5.4% vs. 4.6%) amid higher energy prices and supply-chain disruptions linked to the ongoing Middle East conflict.
Prices also continued to rise for clothing (1.4% vs. 1.5%), healthcare (2.1% vs. 2.2%), and education (1.3% vs. 1.3%).
Meanwhile, housing costs remained subdued (-0.2% vs. -0.2%). On the food side, prices fell for the second straight month (-1.7% vs -1.6%), marking the sharpest drop since October, largely due to persistently weak pork prices and continued declines in fresh fruit costs.
Core inflation, excluding food and energy, rose 1.1% yoy, after April's 1.2% gain.
On a monthly basis, consumer prices edged down 0.1%, reversing a 0.3% increase in April. However, the decline was milder than forecasts of a 0.2% drop. $USNFP - U.S Non-Farm Payrolls (May/2026)ECONOMICS:USNFP 172K
May/2026
source: U.S. Bureau of Labor Statistics
- The US economy added 172K jobs in May 2026, well above forecasts of 85K, and following an upwardly revised 179K gain in the previous month, continuing to point to a resilient labour market.
Job gains occurred in leisure and hospitality (70K), mainly food services and drinking places (48K); local government (55K), health care (35K) and manufacturing (7K).
Employment in financial activities declined by 22K, mostly insurance carriers and related activities (-11K) and commercial banking (-3K).
Meanwhile, employment in transportation and warehousing was essentially unchanged (+1K) and other industries including construction, wholesale trade, retail trade, information, professional and business services also saw little changes.
In addition, upward revisions to the March figures added to the strength of the report, with employment levels in March and April now estimated to be 93K higher than previously reported. $EUIRYY -E.U Inflation (May/2026)ECONOMICS:EUIRYY 3.2%
May/2026 +0.2%
source: EUROSTAT
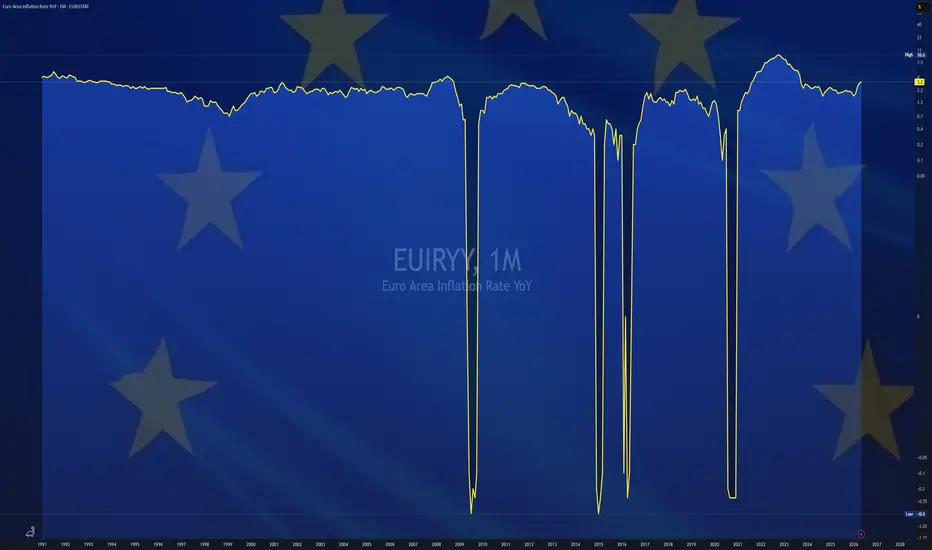
- Eurozone consumer price inflation reached 3.2% in May 2026, up from 3.0% in April and matching market expectations, according to preliminary data.
This marks the highest rate since September 2023, staying significantly above the European Central Bank’s 2.0% target.
Energy costs surged 10.9%, the steepest rise since February 2023, fueled by supply constraints tied to the Middle East conflict. Prices also accelerated for services (3.5% vs. 3.0% in April) and non-energy industrial goods (0.9% vs. 0.8%), while inflation for food, alcohol, and tobacco eased (2.0% vs. 2.4%).
The core rate, excluding energy and food, climbed to 2.5% from 2.2%, suggesting broadening price pressures beyond energy. Among major Eurozone economies, inflation picked up in Spain (3.6% vs. 3.5%), the Netherlands (3.4% vs. 2.5%), Italy (3.3% vs. 2.8%), and France (2.8% vs. 2.5%), but slowed in Germany (2.7% vs. 2.9%). $USGDPQQ - U.S GDP (Q1/2026)ECONOMICS:USGDPQQ 1.6%
Q1/2026 +0.6%
source: U.S. Bureau of Economic Analysis
- The US economy expanded an annualized 1.6% in Q1 2026, up from 0.5% in Q4 but below 2% in the advance estimate, primarily reflecting downward revisions to investment and consumer spending.
Consumer spending rose 1.4%, less than 1.6% in the advance estimate.
The rise was mainly supported by demand for services (1.8%) while goods remained subdued (0.4%).
Also, gross private domestic investment rose 7%, below the 8.7% reported in the advance estimate.
Business investment in equipment surged 17.2%, while spending on intellectual property products increased 11.6%.
In contrast, investment in structures fell 5.4%, and residential investment declined 6.2%.
Meanwhile, net trade contributed negatively to GDP (-1.25 pp), as exports rose by 13.1% (vs 12.9% in the first estimate) while imports jumped 21.1% (vs 21.4%).
Government spending rose 4.4%, in line with the initial estimate, recovering from a 5.6% contraction in Q4, as activity resumed following the end of the government shutdown. Japan's "Money Printer Go Brrr?" Experiment: When the Math Stops**Japan's "Money Printer Go Brrr?" Experiment: When the Math Stops Adding Up** 📉💸
Here's a powerful long-term overlay chart (1981–2024) showing **Japan M2 Money Supply** (Central Bank data) vs. **Japan GDP** (World Bank data), both indexed as cumulative percentage growth from the starting point.
- **M2 Money Supply**: +529.36% 🔥 (the soaring purple line)
- **Japan GDP**: +223.33% (the red line that peaked decades ago and has been far more modest since)
The divergence is insane.
For decades, Japan has run one of the most aggressive monetary experiments in modern history, zero rates, massive QE, Abenomics, yield curve control, the works. The Bank of Japan flooded the system with liquidity. Yet GDP growth never kept up. The classic Quantity Theory of Money (MV = PY) math that "more money = more spending/inflation/growth" broke down hard.
Why? Collapsing **velocity of money**, structural headwinds (aging population, zombie companies, massive public debt, cultural saving preference), and repeated bouts of deflationary psychology. Japan essentially proved that you can print enormous amounts of money without generating proportional nominal GDP growth when the money just sits in banks or government bonds instead of circulating productively.
This chart is a masterclass in why monetary policy has limits, especially in a high-debt, low-growth, demographics-challenged economy. The "lost decades" weren't solved by the printer alone.
What do you think, is Japan the ultimate case study in monetary policy limits, or is the recent inflation pickup finally changing the game?
Would love to hear your take below 👇
feel free to like, comment, and spark some discussion!
#Japan #M2 #GDP #MonetaryPolicy #Abenomics #Macroeconomics #Economics #TradingView  Education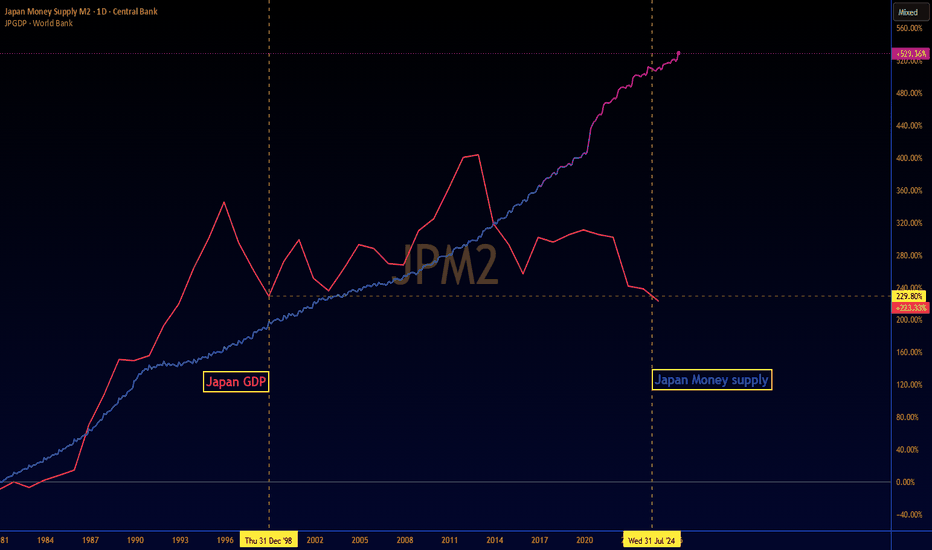
Short 
Long 
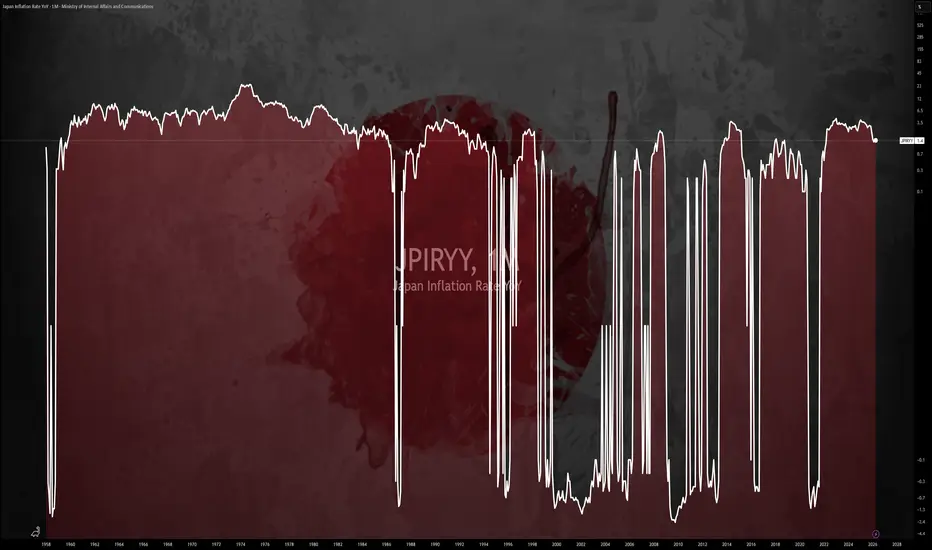
$JPIRYY -Japan CPI (April/2026)ECONOMICS:JPIRYY 1.4%
April/2026 -0.1%
source: Ministry of Internal Affairs & Communications
- Japan’s annual inflation edged down to 1.4% in April 2026 from 1.5% in the prior month. Food prices rose the least in 18 months amid a further slowdown in rice costs.
Inflation also slowed for transport (1.5% vs 2.1%), housing (0.8% vs 1.0%), clothing (1.5% vs 2.1%), household items (1.8% vs 2.7%), recreation (1.3% vs 2.3%), and miscellaneous goods (0.1% vs 0.7%).
Healthcare costs were flat after rising 0.2% previously.
In contrast, inflation for communication accelerated (7.4% from 7.0%). Meanwhile, electricity prices fell at a slower pace (-2.6% vs -8.0%), as did gas prices (-3.4% vs -5.2%), with the impact of subsidies fading.
Tokyo reportedly moves to ease living costs amid the impact of a weak yen and high energy prices.
Core inflation also eased to 1.4% from 1.8% in March, the lowest level since March 2022, remaining below the central bank’s 2% target for a third consecutive month.
On a monthly basis, consumer prices inched 0.1% higher, slowing from March's 0.4% increase. U.S. MORTGAGE RATES: THE "CHAMPAGNE" MODE OF A SOBERING MEMEIn our previously published ideas, we examined the debt markets of the US, UK, and Europe in detail. In this one, we'll focus on mortgage rates, specifically the US 15-year mortgage FRED:MORTGAGE15US
The "STONKS GO UP" meme goes "RATES GO UP."
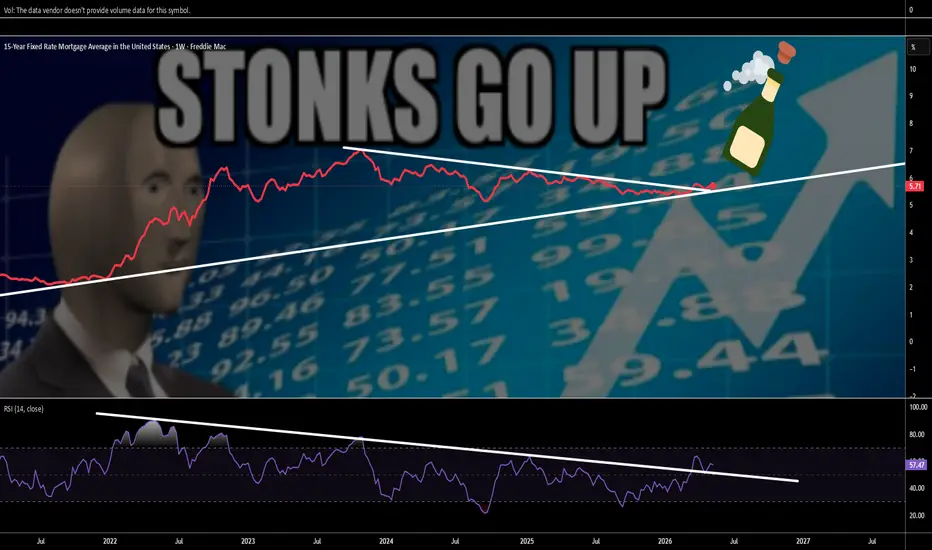
The 15-year fixed mortgage rate in the US will reach 5.7% in the first half of 2026, following the linear trend that has been going on since 2021 and its 5-year moving average.
These are no longer the extreme values of the post-COVID cycle, but they're also far from the pre-crisis comfortable range of 3-4%. A highly understandable TradingView chart and an upward breakout of the triangle visually demonstrate that the rate has jumped to a new "shelf," leaving no chance for a downward reversal.
The Bond Crisis as a Foundation for High Rates
The US Treasury bond market is in a state of prolonged stress: periods of rising yields are followed by only brief respite.
Yields on 10- and 30-year Treasuries are rising to levels above 4.5-5%, which automatically pushes mortgage rates higher.
Each new wave of inflation surprises or increased Treasury borrowing adds basis points to the entire yield curve, cementing "expensive money."
Mortgages Follow U.S. Treasuries
Mortgage-backed securities are trading at a premium to Treasuries, integrating the risk of early repayment and refinancing.
Therefore, 15-year mortgage rates are above Treasury yields but moving in the same direction, mirroring the underlying market trend.
This is reflected in the chart by the upward trend line under the rate curve—the debt market is not yet confident in a sustainable return to low inflation.
Practical Conclusions
The 15-year mortgage rate of around 5.7% no longer appears to be a temporary anomaly, but rather a new underlying reality, with the prospect of moving toward double-digit rates.
Mortgages account for the largest share of household debt nationwide. According to Bankrate, the average American has $258,214 in debt. Millennials have the highest average mortgage debt at $320,027, followed by Generation X at $286,574.
The question now isn't "when will rates return to the old way?" but "are all these X-Men and millennials ready to live in a new, brave world where the "STONKS GO UP" meme has evolved into "RATES GO UP"—and get a mortgage at the rates shown on our chart in TradingView?"
Perhaps not all of them, but certainly most of them, viewed the financial markets five years ago as a ticket to an unlimited champagne party.
Well, we've finally arrived.
--
Best wishes,
@PandorraResearch Team $GBUR - U.K Unemployment RateECONOMICS:GBUR
March2026
source: Office for National Statistics
- The UK unemployment rate rose to 5.0% in the three months to March 2026, above expectations and February’s 4.9%.
The reading marked the first set of figures for the opening month of the US–Iran war, which added pressure to business costs and hiring conditions.
Despite the higher rate, the number of unemployed people fell by 77,000 to 1.806 million, mainly driven by declines among those unemployed for up to six months and those out of work for between six and 12 months.
Compared with the same period last year, however, unemployment increased by 192,000, with all unemployment durations rising.
Meanwhile, total employment increased by 148,000 to 34.392 million, topping expectations of a 107,000 rise, and was up 416,000 on the year, supported by gains in both full-time and part-time work among employees and the self-employed.
The number of people holding second jobs declined in the latest quarter to 1.275 million, accounting for 3.7% of all employed individuals.