FED, one last rate hike? Not so sure.So it is done: Kevin Warsh’s Fed has raised the federal funds rate from 3.75% to 4%, unveiled its new monetary policy outlook and updated its macroeconomic projections. The Fed Chair once again reminded us that the central bank would remain “data dependent” and that it was still committed to supporting the proper functioning of the interbank market.
Are the Fed’s new monetary policy projections a source of pressure or relative relief for financial markets, which have been under pressure from the sharp rise in bond yields and oil and natural gas prices?
Let’s review 4 major dimensions that have been updated and assess what they tell us.
1) DOT PLOTS and the balance of power among the 12 voting members of the FOMC
Since Kevin Warsh took over as Fed Chair, the balance of power within the FOMC has been one of the most important aspects to monitor. Will there be further rate hikes? Could a status quo quickly regain the upper hand? There are 12 members on the FOMC, and a majority is required to make a monetary policy decision. In the event of a tie (6 VS 6), Kevin Warsh has the deciding vote.
On Wednesday, September 16, all 12 out of 12 voted in favor of a rate hike, so there was complete convergence among the FOMC voting members.
The updated DOT PLOTS show that the median FOMC projection now stands at an interest rate of 4.1%, meaning that one final rate hike remains possible by the end of the year or in 2027.
2) The Fed’s inflation and employment projections
The Fed faces the same uncertainty as the rest of the world: when will the Strait of Hormuz reopen, and when will oil and gas prices cease to be a source of upward pressure on headline inflation?
The Fed has expressed confidence that core inflation will return to the 2% target by the end of 2027/2028, but this requires avoiding a prolonged geopolitical shock. Core inflation remains broadly under control, and the rise in oil prices has not yet affected underlying inflation. This is, in itself, a source of optimism for the Fed.
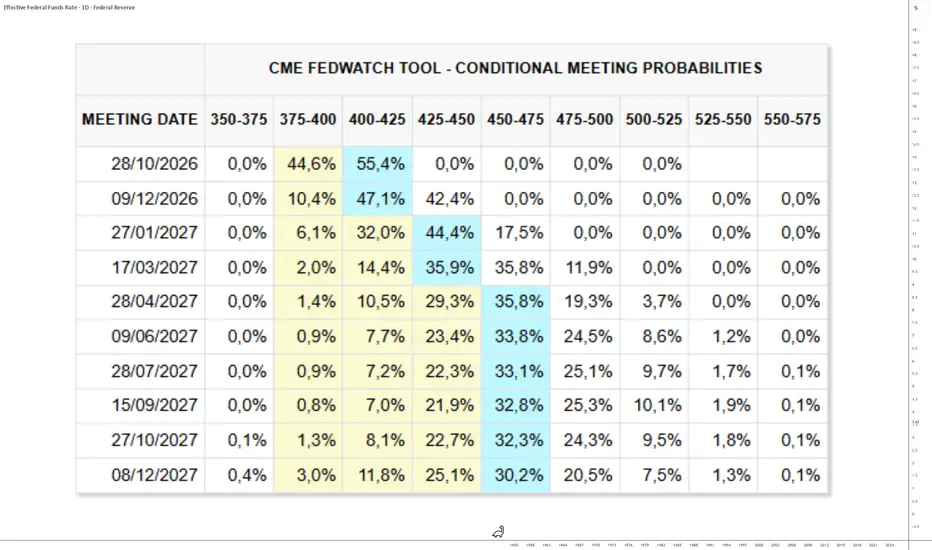
3) How the market (high finance) is positioning itself on the Fed’s rate outlook, through futures contracts on the federal funds rate
The price of federal funds rate futures traded on the Chicago Mercantile Exchange (CME) helps us understand how institutional investors anticipate the future path of the Fed’s interest rate. Following the Fed’s monetary policy decision, the market estimates that one final rate hike could take place by the end of the year, but the status quo could regain the upper hand depending on the evolution of oil prices and core inflation.
4) The technical signals from the 2-year US Treasury yield
The 2-year US Treasury yield is the one that best anticipates the future path of the US federal funds rate. If it is above the Fed’s policy rate, it means that the market is pricing in a rate hike, and vice versa.
The Fed’s policy rate is now 4%, while the US 2-year yield stands at 4.70% following the Fed’s monetary policy decision. The market therefore considers it likely that the Fed will raise its policy rate again by the end of the year.
DISCLAIMER:
This content is intended for individuals who are familiar with financial markets and instruments and is for information purposes only. The presented idea (including market commentary, market data and observations) is not a work product of any research department of Swissquote or its affiliates. This material is intended to highlight market action and does not constitute investment, legal or tax advice. If you are a retail investor or lack experience in trading complex financial products, it is advisable to seek professional advice from licensed advisor before making any financial decisions.
This content is not intended to manipulate the market or encourage any specific financial behavior.
Swissquote makes no representation or warranty as to the quality, completeness, accuracy, comprehensiveness or non-infringement of such content. The views expressed are those of the consultant and are provided for educational purposes only. Any information provided relating to a product or market should not be construed as recommending an investment strategy or transaction. Past performance is not a guarantee of future results.
Swissquote and its employees and representatives shall in no event be held liable for any damages or losses arising directly or indirectly from decisions made on the basis of this content.
The use of any third-party brands or trademarks is for information only and does not imply endorsement by Swissquote, or that the trademark owner has authorised Swissquote to promote its products or services.
Swissquote is the marketing brand for the activities of Swissquote Bank Ltd (Switzerland) regulated by FINMA, Swissquote Capital Markets Limited regulated by CySEC (Cyprus), Swissquote Bank Europe SA (Luxembourg) regulated by the CSSF, Swissquote Ltd (UK) regulated by the FCA, Swissquote Financial Services (Malta) Ltd regulated by the Malta Financial Services Authority, Swissquote MEA Ltd. (UAE) regulated by the Dubai Financial Services Authority, Swissquote Pte Ltd (Singapore) regulated by the Monetary Authority of Singapore, Swissquote Asia Limited (Hong Kong) licensed by the Hong Kong Securities and Futures Commission (SFC) and Swissquote South Africa (Pty) Ltd supervised by the FSCA.
Products and services of Swissquote are only intended for those permitted to receive them under local law.
All investments carry a degree of risk. The risk of loss in trading or holding financial instruments can be substantial. The value of financial instruments, including but not limited to stocks, bonds, cryptocurrencies, and other assets, can fluctuate both upwards and downwards. There is a significant risk of financial loss when buying, selling, holding, staking, or investing in these instruments. SQBE makes no recommendations regarding any specific investment, transaction, or the use of any particular investment strategy.
CFDs are complex instruments and come with a high risk of losing money rapidly due to leverage. The vast majority of retail client accounts suffer capital losses when trading in CFDs. You should consider whether you understand how CFDs work and whether you can afford to take the high risk of losing your money.
Digital Assets are unregulated in most countries and consumer protection rules may not apply. As highly volatile speculative investments, Digital Assets are not suitable for investors without a high-risk tolerance. Make sure you understand each Digital Asset before you trade.
Cryptocurrencies are not considered legal tender in some jurisdictions and are subject to regulatory uncertainties.
The use of Internet-based systems can involve high risks, including, but not limited to, fraud, cyber-attacks, network and communication failures, as well as identity theft and phishing attacks related to crypto-assets.
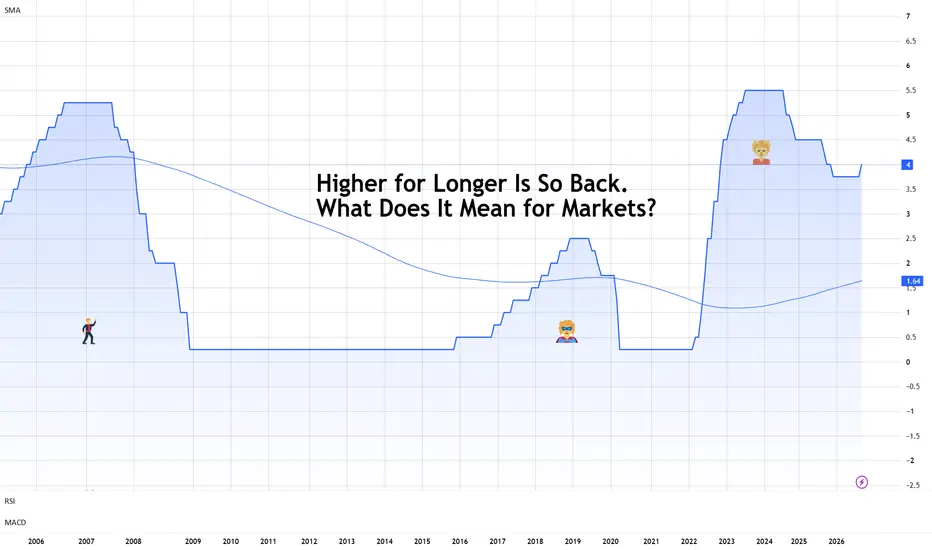
Higher for Longer Is So Back. What Does It Mean for Markets?The Fed hiked. That wasn't the surprise.
For the first time in more than three years, the Federal Reserve has raised interest rates ECONOMICS:USINTR .
The Fed lifted its benchmark rate by 25 basis points Wednesday to 3.75%-4.00%, a move markets had overwhelmingly expected.
The bigger message arrived alongside it: policymakers aren't treating this as a quick adjustment before returning to lower rates. They think borrowing costs may need to stay higher for longer.
Sixteen of 18 policymakers expect at least one more hike before the end of 2026, while the median projection puts the federal funds rate at 4.1% at the end of both 2026 and 2027. In other words, the Fed's current base case contains no rate cuts next year.
Higher for longer is so back.
📈 Why Isn't the Fed Finished?
The problem is that the US economy isn't behaving like one that desperately needs cheaper money.
August payrolls ECONOMICS:USNFP rose by 162,000, unemployment remains at 4.1% and retail sales jumped 1.2% in August, comfortably beating expectations. Core retail sales were even stronger at 1.4%.
Meanwhile, import prices increased 7% from a year earlier and elevated energy costs continue feeding inflation concerns. Keep an eye on the Economic Calendar so you won’t be caught off guard by a surprise data release.
Now the Fed faces an unusual combination: stubborn inflation ECONOMICS:USCPI alongside surprisingly resilient economic growth.
Normally, higher rates eventually cool borrowing, spending and hiring. But if households keep shopping, companies keep investing and employment remains solid, policymakers have less reason to rush toward easier monetary policy.
Chair Kevin Warsh also argued that economic strength and enormous capital investment, particularly from technology companies, are helping push bond yields higher. The economy, so far, is refusing to take the hint.
💵 Higher Rates Make Cash Expensive Again
Why should equity traders care whether the Fed funds rate is 3%, 4% or 5%? Because interest rates effectively influence the price of money.
When rates rise, companies generally face higher borrowing costs. Mortgages and other consumer loans become more expensive. Investors can earn more from relatively safe government debt.
And future corporate profits are discounted at a higher rate when analysts calculate what they're worth today. That last part is especially true for expensive growth stocks.
Imagine a company expected to generate most of its profits many years from now.
Higher discount rates make those distant earnings worth less in today's money, which helps explain why richly valued technology stocks can become particularly sensitive to changes in Treasury yields.
A brilliant company doesn't automatically become a brilliant stock at every interest rate.
📊 It’s the Bonds We Make Along the Way
Higher for longer also changes the choice investors make between asset classes.
When Treasury yields are low, investors searching for returns have stronger incentives to venture into stocks, corporate bonds and other riskier assets. When government bonds offer attractive yields, that calculation changes.
Why accept significant equity risk if a Treasury can suddenly pay you considerably more?
That's sometimes called the TINA trade disappearing. When rates were near zero, investors joked that “There Is No Alternative” to stocks.
Higher yields mean there very much is. Check the Yield Curves tool to stay up to date.
That doesn't mean equities must fall whenever rates rise. Strong economic growth can simultaneously support corporate earnings.
It does mean stocks face a higher hurdle: profits need to grow sufficiently quickly to justify their valuations against increasingly attractive alternatives.
💻 Not Every Stock Feels It Equally
This is where the story becomes more useful than simply declaring higher rates “bad for stocks.”
Banks can sometimes benefit from higher interest rates because the spread between what they earn on loans and pay on deposits can improve, although the relationship depends heavily on the yield curve and credit conditions.
Highly leveraged companies face the opposite problem. Debt eventually needs refinancing, and replacing cheap borrowing with considerably more expensive borrowing can eat directly into profits.
💲 The Dollar Gets a Yield Advantage
Currencies have their own version of the story. Higher US rates can make dollar-denominated assets more attractive to global investors, increasing demand for dollars.
That helps explain why the greenback strengthened after Wednesday's decision. However, the important word is relative.
OANDA:EURUSD doesn't care only about what the Fed is doing. It cares about how US monetary policy compares with the ECB. FX:USDJPY reflects the gap between US and Japanese rates. OANDA:GBPUSD responds partly to the relationship between Fed and Bank of England policy.
Currency traders are constantly comparing one currency with another and their respective yields. A hawkish Fed matters most when everyone else is less hawkish.
🥇 Gold Has an Opportunity-Cost Problem
Gold OANDA:XAUUSD demonstrated the mechanism almost immediately.
Spot gold dropped more than 1% after the Fed decision, falling toward $4,240 an ounce after trading above $4,365 earlier in the session. The dollar strengthened at the same time. Gold doesn't pay interest.
So when yields rise, holding bullion means giving up more potential income from interest-bearing assets. A stronger dollar can add another headwind because gold becomes more expensive for buyers using other currencies.
Yet the relationship isn't only mechanical. Persistent inflation, geopolitical uncertainty and concerns about currencies or government debt can still create demand for gold even when rates are high.
₿ Bitcoin Gets Its Own Stress Test
Crypto faces a similar, although considerably messier, calculation.
Easy monetary conditions historically encouraged investors to venture further along the risk curve. When cash paid almost nothing, speculative assets had plenty of room to attract capital.
Higher rates increase the return available elsewhere and can tighten financial conditions, potentially reducing some of that appetite.
But Bitcoin BITSTAMP:BTCUSD isn't simply a high-beta technology stock anymore. Its short-term correlation with equities and the dollar has weakened considerably at times this year, meaning crypto-specific flows, regulation (honorable mention: the Clarity Act setback ) and institutional adoption can overwhelm the traditional macro relationship.
Higher for longer is therefore a headwind worth watching, not a guaranteed Bitcoin sell signal.
👀 What Does Higher for Longer Mean?
Perhaps the most important point is that the dot plot isn't a promise. Fed projections change when the economy changes. A sharp deterioration in employment, faster-than-expected disinflation or a serious slowdown in growth could completely rewrite today's rate path.
The opposite is also true. If inflation stays stubborn while employment and consumer spending remain strong, the market may eventually have to contemplate something even less comfortable than higher for longer: higher than currently expected.
For traders, that's why Wednesday's 25-basis-point move isn't really the end of the story.
Off to you : Now that the Fed changed the price of money, and plans to do it one more time by year end, what’s your outlook on the market?
$GBIRYY -U.K Inflation Rate (August/2026)ECONOMICS:GBIRYY 3.1%
August/2026 +0.3%
source: Office for National Statistics
- The UK’s annual inflation rate rose to 3.1% in August 2026, the highest in five months, in line with market expectations and up from 2.9% in July.
Transport costs made the largest upward contribution to the annual rate, with inflation rising to 4.6% from 3.6% in July, driven particularly by motor fuels.
Petrol prices rose 9.1 pence per litre from a month earlier to 161.3 pence, while diesel prices increased 14.2 pence to 181.8 pence, pushing motor fuel inflation to 23.0% from 15.5%.
Inflation also rose for housing and household services (4.9% vs 4.6%), communication (5.3% vs 5.0%), and recreation and culture (1.6% vs 1.4%).
Meanwhile, food inflation was unchanged at 1.3%. Core CPI inflation held at 2.6%, with goods inflation rising to 2.7% from 2.2% and services inflation unchanged at 3.4%.
On a monthly basis, consumer prices rose 0.5%, the most in four months, matching forecasts and accelerating from 0.3% in July. FED tonight: the three signals to watch firstIt’s D-Day. Today is Wednesday, September 16, and it is the Federal Reserve’s monetary policy decision under Kevin Warsh. This is the most important fundamental event of this September, given the high degree of uncertainty surrounding what the Fed will do and its monetary policy outlook for the months ahead.
The combined rise in oil and gas prices and market interest rates is putting strong pressure on the Fed to raise the federal funds rate. However, the balance of power within the FOMC remains uncertain, and the status quo scenario is still possible.
The Fed’s monetary policy announcements tonight will have an impact on all asset classes, including equities, bonds, foreign exchange, commodities, and cryptocurrencies.
Will the Fed be restrictive or accommodative in its monetary policy outlook through the end of the year?
To answer this question, the following fundamental and technical data points will need to be closely monitored tonight:
1. The evolution of the DOT PLOTS
The first signal to watch will be the evolution of the “dot plots,” which provide insight into individual FOMC members’ expectations regarding the future level of policy rates. The key issue will be determining whether the median projection moves toward higher or lower rates by year-end and in 2027. A dot plot higher than expected would be interpreted as a restrictive signal, while a decline in the median would strengthen the scenario of monetary easing. It will also be important to observe the dispersion of the dots, as this will provide an important indication of the degree of division within the FOMC.
2. The trend in the US 2-year Treasury yield and its positioning relative to the US federal funds rate
The US 2-year Treasury yield will also be a particularly important market indicator. Highly sensitive to monetary policy expectations, it will make it possible to gauge investors’ immediate reaction to the Fed’s statement and projections. Above all, attention should be paid to its spread versus the federal funds rate. If the 2-year yield remains significantly above the policy rate, the market will continue to price in a relatively restrictive monetary policy. Conversely, a rapid decline in the 2-year yield would signal that investors are anticipating more rate cuts over the coming months.
3. The update to the Fed’s macroeconomic projections, particularly regarding core inflation
Finally, the Fed’s new economic projections will be decisive in understanding its reaction function. Changes in core inflation forecasts will be particularly important in a context marked by rising energy prices. An upward revision to inflation, combined with resilient growth, would reinforce the scenario of a more restrictive Fed. Conversely, if the Fed maintains a disinflationary trajectory while lowering its growth forecasts or showing deterioration in the labor market, the market could anticipate a more accommodative policy.
It is therefore the combination of these three signals — dot plots, the US 2-year yield, and macroeconomic projections — that will make it possible to determine the Fed’s true message tonight.
DISCLAIMER:
This content is intended for individuals who are familiar with financial markets and instruments and is for information purposes only. The presented idea (including market commentary, market data and observations) is not a work product of any research department of Swissquote or its affiliates. This material is intended to highlight market action and does not constitute investment, legal or tax advice. If you are a retail investor or lack experience in trading complex financial products, it is advisable to seek professional advice from licensed advisor before making any financial decisions.
This content is not intended to manipulate the market or encourage any specific financial behavior.
Swissquote makes no representation or warranty as to the quality, completeness, accuracy, comprehensiveness or non-infringement of such content. The views expressed are those of the consultant and are provided for educational purposes only. Any information provided relating to a product or market should not be construed as recommending an investment strategy or transaction. Past performance is not a guarantee of future results.
Swissquote and its employees and representatives shall in no event be held liable for any damages or losses arising directly or indirectly from decisions made on the basis of this content.
The use of any third-party brands or trademarks is for information only and does not imply endorsement by Swissquote, or that the trademark owner has authorised Swissquote to promote its products or services.
Swissquote is the marketing brand for the activities of Swissquote Bank Ltd (Switzerland) regulated by FINMA, Swissquote Capital Markets Limited regulated by CySEC (Cyprus), Swissquote Bank Europe SA (Luxembourg) regulated by the CSSF, Swissquote Ltd (UK) regulated by the FCA, Swissquote Financial Services (Malta) Ltd regulated by the Malta Financial Services Authority, Swissquote MEA Ltd. (UAE) regulated by the Dubai Financial Services Authority, Swissquote Pte Ltd (Singapore) regulated by the Monetary Authority of Singapore, Swissquote Asia Limited (Hong Kong) licensed by the Hong Kong Securities and Futures Commission (SFC) and Swissquote South Africa (Pty) Ltd supervised by the FSCA.
Products and services of Swissquote are only intended for those permitted to receive them under local law.
All investments carry a degree of risk. The risk of loss in trading or holding financial instruments can be substantial. The value of financial instruments, including but not limited to stocks, bonds, cryptocurrencies, and other assets, can fluctuate both upwards and downwards. There is a significant risk of financial loss when buying, selling, holding, staking, or investing in these instruments. SQBE makes no recommendations regarding any specific investment, transaction, or the use of any particular investment strategy.
CFDs are complex instruments and come with a high risk of losing money rapidly due to leverage. The vast majority of retail client accounts suffer capital losses when trading in CFDs. You should consider whether you understand how CFDs work and whether you can afford to take the high risk of losing your money.
Digital Assets are unregulated in most countries and consumer protection rules may not apply. As highly volatile speculative investments, Digital Assets are not suitable for investors without a high-risk tolerance. Make sure you understand each Digital Asset before you trade.
Cryptocurrencies are not considered legal tender in some jurisdictions and are subject to regulatory uncertainties.
The use of Internet-based systems can involve high risks, including, but not limited to, fraud, cyber-attacks, network and communication failures, as well as identity theft and phishing attacks related to crypto-assets.
Fundamentals: Massive Market Impact This WeekThe trading week of September 14 will be the most important of the month in terms of major fundamental catalysts. The US Congress returns to legislative work on September 14, the vote on the Clarity Act takes place on September 15, the Fed announces its monetary policy decision on September 16, and the BoJ follows on September 18. Equities, the dollar, interest rates and bitcoin are all likely to be strongly impacted.
The first major event will take place on Monday, September 14, with the return of the US Congress after the summer recess. This return is particularly important for the cryptocurrency market because the Senate is scheduled to vote the following day on the CLARITY Act, the major piece of legislation designed to establish a clearer regulatory framework for crypto assets in the United States.
September 15 will therefore be a first high-stakes day for bitcoin and the broader crypto market. The expected vote is the Senate cloture vote. The bill needs 60 votes to move forward (there are 53 Republican senators, meaning 7 Democratic senators are needed to close debate). A positive outcome would represent a major regulatory step forward and could strengthen expectations of accelerating institutional adoption of crypto. Conversely, another failure would have a very negative short-term impact on the price of bitcoin and altcoins.
The table below presents the key fundamental events of this very busy week starting Monday, July 14, which will have a massive impact on the market.
But the real macroeconomic event of the week will probably be the Federal Reserve meeting on September 15 and 16. The market is currently divided over the direction of monetary policy and is waiting to assess the balance of power within the FOMC and the Fed’s new inflation expectations. So, will the Fed raise the federal funds rate this Wednesday, September 16, or maintain the status quo?
The Fed’s decision will therefore be decisive for bond yields and the dollar, but also for equity markets and bitcoin. A more restrictive Fed could trigger another rise in bond yields and put pressure on risk assets. Conversely, a more accommodative Fed could revive liquidity expectations and support markets.
Finally, the week will end with the Bank of Japan, which will hold its monetary policy meeting on September 17 and 18. Markets are currently pricing in a possible 25-basis-point rate hike to 1.25%. The yen has already appreciated sharply in recent days, raising the question of a potential unwinding of the carry trade.
Overall, we therefore have an exceptional succession of catalysts: the US Congress, the CLARITY Act, the Fed and then the BoJ. The transmission mechanisms will be different, but they all converge on the same markets: equities, bonds, the dollar, the yen and bitcoin.
This week will therefore need to be monitored with particular attention. It could genuinely mark a turning point for financial markets at the start of this September trading season.
DISCLAIMER:
This content is intended for individuals who are familiar with financial markets and instruments and is for information purposes only. The presented idea (including market commentary, market data and observations) is not a work product of any research department of Swissquote or its affiliates. This material is intended to highlight market action and does not constitute investment, legal or tax advice. If you are a retail investor or lack experience in trading complex financial products, it is advisable to seek professional advice from licensed advisor before making any financial decisions.
This content is not intended to manipulate the market or encourage any specific financial behavior.
Swissquote makes no representation or warranty as to the quality, completeness, accuracy, comprehensiveness or non-infringement of such content. The views expressed are those of the consultant and are provided for educational purposes only. Any information provided relating to a product or market should not be construed as recommending an investment strategy or transaction. Past performance is not a guarantee of future results.
Swissquote and its employees and representatives shall in no event be held liable for any damages or losses arising directly or indirectly from decisions made on the basis of this content.
The use of any third-party brands or trademarks is for information only and does not imply endorsement by Swissquote, or that the trademark owner has authorised Swissquote to promote its products or services.
Swissquote is the marketing brand for the activities of Swissquote Bank Ltd (Switzerland) regulated by FINMA, Swissquote Capital Markets Limited regulated by CySEC (Cyprus), Swissquote Bank Europe SA (Luxembourg) regulated by the CSSF, Swissquote Ltd (UK) regulated by the FCA, Swissquote Financial Services (Malta) Ltd regulated by the Malta Financial Services Authority, Swissquote MEA Ltd. (UAE) regulated by the Dubai Financial Services Authority, Swissquote Pte Ltd (Singapore) regulated by the Monetary Authority of Singapore, Swissquote Asia Limited (Hong Kong) licensed by the Hong Kong Securities and Futures Commission (SFC) and Swissquote South Africa (Pty) Ltd supervised by the FSCA.
Products and services of Swissquote are only intended for those permitted to receive them under local law.
All investments carry a degree of risk. The risk of loss in trading or holding financial instruments can be substantial. The value of financial instruments, including but not limited to stocks, bonds, cryptocurrencies, and other assets, can fluctuate both upwards and downwards. There is a significant risk of financial loss when buying, selling, holding, staking, or investing in these instruments. SQBE makes no recommendations regarding any specific investment, transaction, or the use of any particular investment strategy.
CFDs are complex instruments and come with a high risk of losing money rapidly due to leverage. The vast majority of retail client accounts suffer capital losses when trading in CFDs. You should consider whether you understand how CFDs work and whether you can afford to take the high risk of losing your money.
Digital Assets are unregulated in most countries and consumer protection rules may not apply. As highly volatile speculative investments, Digital Assets are not suitable for investors without a high-risk tolerance. Make sure you understand each Digital Asset before you trade.
Cryptocurrencies are not considered legal tender in some jurisdictions and are subject to regulatory uncertainties.
The use of Internet-based systems can involve high risks, including, but not limited to, fraud, cyber-attacks, network and communication failures, as well as identity theft and phishing attacks related to crypto-assets.
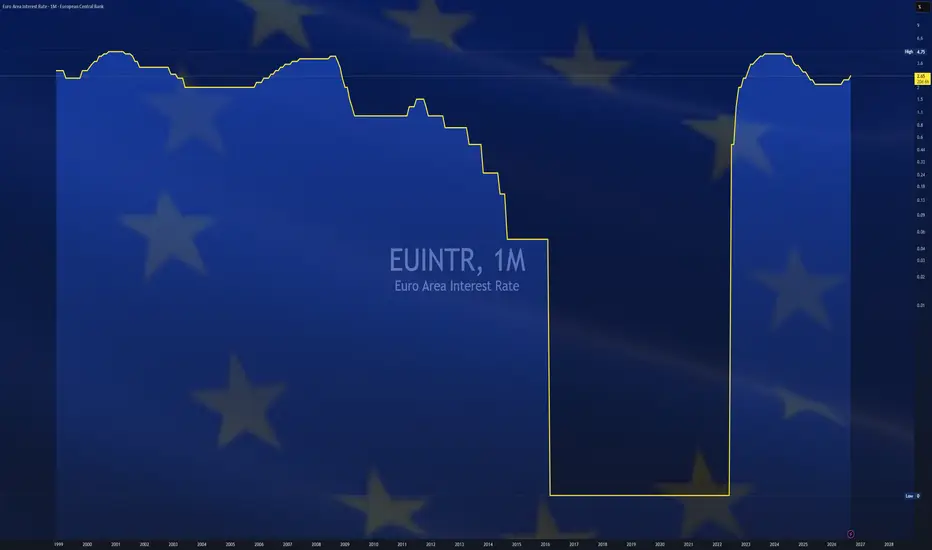
$EUINTR - Europe Interest Rates(September/2026)ECONOMICS:EUIRYY 2.65%
September/2026 +0.25%
source: European Central Bank
- The European Central Bank raised its key interest rates by 25 bps at its September meeting, marking its second hike since the US-Iran war began.
The ECB said the conflict in the Middle East continues to fuel inflationary pressures,
with inflation expected to remain well above its 2% target for an extended period.
The main refinancing rate was raised to 2.65%, while the deposit rate increased to 2.5%.
Meanwhile, the ECB kept its 2026 inflation forecast at 3.0% but revised its projections higher for 2027 and 2028, to 2.5% and 2.1%, respectively.
Growth forecasts were upgraded to 0.9% for 2026 and 1.4% for 2027, reflecting greater-than-expected resilience in the euro area economy, while the 2028 forecast remained unchanged at 1.5%.
At a press conference following the meeting, ECB President Christine Lagarde said risks to growth are tilted to the downside, while inflation risks are currently tilted to the upside, reiterating that future decisions will be made on a meeting-by-meeting basis. $CNBOT - Balance of Trade (August/2026)ECONOMICS:CNBOT
August/2026
source: General Administration of Customs
- China’s trade surplus widened to $119.09 billion in August 2026, up from $101.01 billion a year earlier.
Exports jumped 25% year-on-year to $401.44 billion, following a nearly 24% increase in July, as the global AI infrastructure buildout continued to boost trade across Asia.
Shipments to the US surged 34.4%, lifting China’s surplus with the US to more than $29 billion, the widest gap since Donald Trump returned to the White House in January 2025.
Washington is stepping up its rhetoric toward Beijing, urging China to boost domestic demand and reduce its reliance on exports for growth, ahead of a planned meeting between Chinese President Xi Jinping and US President Donald Trump later this month.
Meanwhile, imports rose 28.2% to $282.36 billion, slightly below forecasts but accelerating from July’s 27.5% increase.
In the first eight months of 2026, China’s trade surplus reached $806 billion, putting the annual figure on track to surpass last year’s record of $1.2 trillion.  Long
Long
$USUR - U.S Unemployment Rate (Ausugst/2026)ECONOMICS:USUR 4.1%
August/2026 0.0%
source: U.S. Bureau of Labor Statistics
- The U.S unemployment rate remained unchanged at 4.1% in August 2026,
in line with market expectations.
The number of unemployed increased by 115,000 to 7.03 million,
while total employment surged by 569,000 to 162.75 million.
The labor force expanded by 683,000 to 169.78 million, lifting the labor force participation rate to 61.6% from a five-year low of 61.4% in July.
The employment-to-population ratio also edged higher to 59.1%.
Meanwhile, the broader U-6 unemployment rate,
which includes discouraged and underemployed workers,
eased to 7.7% from 7.9%,
pointing to a modest improvement in broader labor-market conditions. The Major Challenge of US Fiscal CredibilityThe monetary policy outlook of the Federal Reserve (FED) is the dominant fundamental factor for financial markets and the underlying trend of the US equity market.
But a second fundamental theme is increasingly establishing itself as the faithful number two: US fiscal credibility, at a time when the budget deficit has fluctuated between 5% and 7% every year since 2019, while long-term bond yields have been following an upward trend since 2022.
First of all, I invite you to reread the analysis I presented last week on the fundamental factors needed to put an end to this rise in long-term yields and therefore remove some of the fundamental pressure on the market.
How can the upward trend in long-term interest rates in the United States be brought to an end?
Click on the chart below. It will take you to an analysis presenting the three essential factors needed to reverse the downward trend in long-term yields.
So why is US fiscal credibility such a major issue when the midterm elections are scheduled for Tuesday, November 3?
The answer is simple: interest payments on US debt now represent an overwhelming share of US federal government spending, and this negative dynamic appears likely to intensify further.
In fiscal year 2026, net interest expense reached approximately $1 trillion, representing nearly 18% of federal revenues. A considerable share of government revenues is being absorbed by debt servicing.
The table below presents the US federal budget and highlights the significant share that interest expense now represents in US federal government spending each year.
And the problem is dynamic. With federal debt close to 125% of GDP and a budget deficit close to $1.9 trillion, the United States must continue to borrow massively. If long-term yields remain high, refinancing the debt mechanically increases interest costs.
This is precisely where fiscal credibility comes into play. Bond investors must be convinced that Washington is capable of stabilizing and then reducing its deficit. Failing that, a higher term premium could become permanently embedded in Treasuries, pushing long-term yields higher despite a more accommodative FED.
The midterm elections will be a major political test: the market will be looking for credible signs of fiscal discipline. Without it, a reduction in policy rates may not be enough to reverse the trend in long-term yields.
The histogram below represents the US budget deficit as a percentage of US GDP. This growing deficit threatens US fiscal credibility.
DISCLAIMER:
This content is intended for individuals who are familiar with financial markets and instruments and is for information purposes only. The presented idea (including market commentary, market data and observations) is not a work product of any research department of Swissquote or its affiliates. This material is intended to highlight market action and does not constitute investment, legal or tax advice. If you are a retail investor or lack experience in trading complex financial products, it is advisable to seek professional advice from licensed advisor before making any financial decisions.
This content is not intended to manipulate the market or encourage any specific financial behavior.
Swissquote makes no representation or warranty as to the quality, completeness, accuracy, comprehensiveness or non-infringement of such content. The views expressed are those of the consultant and are provided for educational purposes only. Any information provided relating to a product or market should not be construed as recommending an investment strategy or transaction. Past performance is not a guarantee of future results.
Swissquote and its employees and representatives shall in no event be held liable for any damages or losses arising directly or indirectly from decisions made on the basis of this content.
The use of any third-party brands or trademarks is for information only and does not imply endorsement by Swissquote, or that the trademark owner has authorised Swissquote to promote its products or services.
Swissquote is the marketing brand for the activities of Swissquote Bank Ltd (Switzerland) regulated by FINMA, Swissquote Capital Markets Limited regulated by CySEC (Cyprus), Swissquote Bank Europe SA (Luxembourg) regulated by the CSSF, Swissquote Ltd (UK) regulated by the FCA, Swissquote Financial Services (Malta) Ltd regulated by the Malta Financial Services Authority, Swissquote MEA Ltd. (UAE) regulated by the Dubai Financial Services Authority, Swissquote Pte Ltd (Singapore) regulated by the Monetary Authority of Singapore, Swissquote Asia Limited (Hong Kong) licensed by the Hong Kong Securities and Futures Commission (SFC) and Swissquote South Africa (Pty) Ltd supervised by the FSCA.
Products and services of Swissquote are only intended for those permitted to receive them under local law.
All investments carry a degree of risk. The risk of loss in trading or holding financial instruments can be substantial. The value of financial instruments, including but not limited to stocks, bonds, cryptocurrencies, and other assets, can fluctuate both upwards and downwards. There is a significant risk of financial loss when buying, selling, holding, staking, or investing in these instruments. SQBE makes no recommendations regarding any specific investment, transaction, or the use of any particular investment strategy.
CFDs are complex instruments and come with a high risk of losing money rapidly due to leverage. The vast majority of retail client accounts suffer capital losses when trading in CFDs. You should consider whether you understand how CFDs work and whether you can afford to take the high risk of losing your money.
Digital Assets are unregulated in most countries and consumer protection rules may not apply. As highly volatile speculative investments, Digital Assets are not suitable for investors without a high-risk tolerance. Make sure you understand each Digital Asset before you trade.
Cryptocurrencies are not considered legal tender in some jurisdictions and are subject to regulatory uncertainties.
The use of Internet-based systems can involve high risks, including, but not limited to, fraud, cyber-attacks, network and communication failures, as well as identity theft and phishing attacks related to crypto-assets.
Why Friday’s Jobs Report Could Set the Tone for the Rest of 2026Jobs Friday has main-character energy.
Usually, the monthly US jobs report ECONOMICS:USNFP arrives with a familiar routine: the Economic Calendar spits it out every first Friday of the month. Then economists make their forecasts, traders stare at the number for approximately three seconds while algos have already priced in the worst/best case scenario.
This Friday's report carries considerably more weight. After Federal Reserve Chair Kevin Warsh used Jackson Hole to warn that underlying inflation still hasn't improved enough , markets are once again seriously contemplating a September interest-rate hike.
Futures recently put the probability around 55%-60%, meaning Friday's employment numbers arrive with the Fed sitting remarkably close to a coin toss.
📉 One Curveball Already
July's report provided a grim complication ( but not for stocks ) when nonfarm payrolls fell by 23,000, while unemployment held at 4.1%. Friday is expected to show a modest recovery, with economists looking for roughly 50,000 new jobs and unemployment remaining around 4.1%.
That would hardly qualify as booming employment, particularly by recent US standards, but the precise number matters less than what it tells policymakers about whether the economy can tolerate another increase in borrowing costs.
That's what makes this report particularly interesting: strong jobs data could actually become bad news for markets.
🔥 Strong Jobs Could Make Things Easier
Suppose payrolls comfortably beat expectations, unemployment remains low and wage growth stays firm. Ordinarily, that sounds like something investors should celebrate, because people working and earning money generally supports consumer spending and corporate profits.
The complication is inflation. Warsh said Friday that the Fed must become confident underlying inflation is moving toward its 2% objective at sufficient speed, adding that otherwise policymakers still have "work to do."
A resilient labor market would give the Fed considerably more room to perform that work through higher rates without worrying that tighter policy would eventually crack employment.
That could push Treasury yields and the dollar TVC:DXY higher while creating pressure for growth stocks, gold OANDA:XAUUSD and other rate-sensitive assets. That’s how a blockbuster payroll number might receive the cold shoulder from Wall Street.
🧊 Weak Jobs Create the Opposite Problem
Now flip the scenario. Payrolls disappoint again, unemployment climbs and wage growth cools.
Markets could interpret that as evidence that the Fed should lower rates in September, potentially pulling Treasury yields lower and giving stocks, gold and Bitcoin some breathing room. Yet there is an important threshold here: weak can become too weak.
A mildly cooling labor market helps the rate-hold argument. A rapidly deteriorating one raises questions about recession, consumer spending and future corporate earnings.
Ideally, traders will be searching for something closer to Goldilocks territory — cool enough to restrain inflation without suggesting the economy is beginning to buckle.
📅 And September Is Only the Beginning
Friday won't settle the argument alone. August CPI arrives shortly afterward, and the Fed meets on September 15-16, giving policymakers another major inflation reading before deciding what comes next.
But the combination of stubborn inflation and a labor market whose direction has become considerably less obvious means those releases could reshape expectations beyond one meeting.
A September hike would reinforce the idea that Warsh's Fed is prepared to keep monetary policy restrictive — and potentially tighten further — into the final months of 2026. A sustained deterioration in employment could send expectations in precisely the opposite direction.
🎯 Reactions > Number
There's a useful trading lesson buried underneath all of this. Economic data isn't inherently bullish or bearish because markets trade expectations and underlying market conditions , rather than numbers in isolation.
A 100,000 payroll gain could send stocks down if traders conclude it makes a rate hike more likely. A weak report could send them higher if falling yields dominate the reaction. An extremely weak number could reverse that optimism entirely as recession concerns take over.
So when Friday's number hits the screen, the payroll figure is only the opening line.
Watch our Yield Curves tool, the dollar and rate expectations immediately afterward. They'll tell you how the market is actually reading the story — and potentially what traders should expect from the Fed for the rest of 2026.
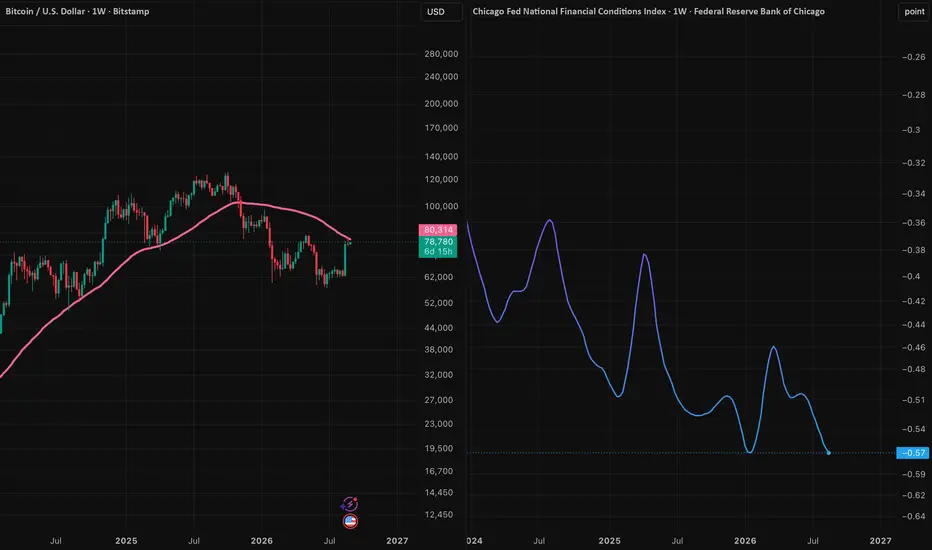
Off to you : How do you position your portfolio for this Friday’s news drop? Share your views! The Bottom is IN. Maybe...On the chart I have the NFCI on one side and Bitcoin with the 50 week SMA on the other.
The gap between these two is what this idea is about.
Policy right now is restrictive. That is not a guess, it is what the Fed keeps telling us. At Jackson Hole on the 28th of August, Warsh said inflation is still above the 2% target and policy can stay restrictive if price pressures persist. Yields moved up and risk assets sold off into the weekend.
But financial conditions do not look restrictive at all. The NFCI is still below zero at -0.57, which means conditions are looser than the historical average. At the same time the S&P has printed an intraday record of 7,814.88 and has closed at an all time high 25 times this year.
So the market is pricing easy money while the institution that sets the price of money is saying the opposite. One of those two has to give.
What I think is being missed is that Bitcoin has already taken its punishment. Price is roughly 38% below the October 2025 high of 126,209 and it printed 57,950 on the 1st of July, a 21 month low. Equities have had no equivalent event. Crypto priced the tightening, stocks did not.
Since that low we have rallied about 40%, tagging around 81,455 on the 28th of August before reversing back under 78,000. That number should look familiar to anyone who traded 2022. Back then BTC rallied around 43% off a June low into an August high, made a lower high, and bottomed in November.
On the bottom indicators, the picture is split and I would be careful with anyone telling you the low is already in.
Supply in profit has broken the trend line that marked lows in every previous cycle. Exchange reserves are at multi year lows. Short term holder SOPR is under 1, so recent buyers are underwater. Those have fired.
But MVRV Z-Score never reached the deep value zone below zero that marked 2018 and 2022, and price has not traded below realized price, which sits around 53,600.
The equity side deserves the same look. Breadth has actually improved this year, around 52% of S&P members are outperforming the index which is the best reading since 2016, and roughly two thirds are higher on the year. I am not going to pretend otherwise.
But breadth and concentration are different things and only one of them improved. The top ten names are still about 40.6% of the index, above the dot com peak. Earnings growth is carried by a handful of AI and semiconductor names. And the average S&P member has had a maximum drawdown of about 21% this year while the index itself never had an official correction. The highs are covering real damage underneath.
Bitcoin is below the 50 week SMA at $80,310 and for this idea to hold it needs to stay there. A sustained weekly close above it invalidates what I am saying here. So I would treat a reclaim as my Q4 idea being dead rather than the bull being back.
In conclusion, if the NFCI turns up towards zero and equities correct into Q4, I would expect Bitcoin to make a lower low with it and I think that would be the cycle bottom. Q4 also lines up with where the low has formed in previous cycles, but also lines with market corrections in mid term years for stocks.
This view is not contrarian at all, Galaxy has a Q4 bottom in the 40k to 46k region and Cowen, CryptoQuant and Brandt are all clustered around September to October.
The question for me is whether the correction will come, as these market conditions can last a long time. In addition if it comes later will that be enough to put a new low in. Despite speculation if BTC dips below the65k mark I will be buying. Broad Dollar Index — the Fed’s index, the real US dollar!How can we properly track the underlying trend of the US dollar on the foreign exchange market? The best-known and most traditionally followed representation of the US dollar in trading rooms is the dollar index with the ticker DXY. You can find the DXY on TradingView.
But the problem with this representation of the US dollar is that it gives too much weight to the Euro and excludes many of the United States’ trading partners, particularly China.
This is why the Fed uses its Broad Dollar Index to analyze the trend of the US dollar, and its TradingView ticker is DTWEXBGS.
Let’s take a closer look at the differences between the DXY and the Fed’s Broad Dollar Index, bearing in mind that a good analysis consists of using both indices and looking for convergences or divergences in their trends.
The DXY is composed of only six currencies, and its main characteristic is the extremely large weight given to the Euro, which represents 57.6% of the index. The Japanese yen accounts for 13.6%, the British pound 11.9%, the Canadian dollar 9.1%, the Swedish krona 4.2% and the Swiss franc 3.6%. In other words, more than 83% of the DXY depends on the Euro, yen and pound sterling.
The Fed’s Broad Dollar Index takes a very different approach. It seeks to measure the value of the dollar against the currencies of the United States’ main trading partners, with weights based on trade flows. The Fed regularly updates these weights. For 2026, the Euro therefore represents around 21% of the basket, the Mexican peso 14.8%, the Canadian dollar 12.8% and the Chinese yuan 10.9%.
The table below compares the two representations of the US dollar in FX: the very well-known US Dollar Index (DXY) used in trading rooms and the Fed’s Broad Dollar Index.
The Broad Dollar Index is now probably the best choice for tracking the underlying trend of the US dollar against a basket of major currencies.
This difference is fundamental. The DXY is ultimately highly sensitive to the Euro, whereas the Broad Dollar Index provides a much more diversified representation of the dollar’s strength in the global economy. It notably includes China, Mexico, South Korea, India, Taiwan, Vietnam and Brazil, all of which are absent from the DXY.
It should also be specified that the Broad Dollar Index is an index weighted by trade in goods and services. It is therefore better suited to a macroeconomic analysis of the dollar’s external value, whereas the DXY remains extremely useful for tracking movements in the foreign exchange market.
On TradingView, DTWEXBGS corresponds to the Fed’s nominal Broad Dollar Index, with a base of 100 in January 2006 and daily data.
In practice, I therefore recommend following both. If the DXY falls but the Broad Dollar Index remains resilient, the weakness of the dollar may be primarily related to the Euro. On the other hand, if both indices decline simultaneously, the signal becomes much more powerful: the weakness of the dollar is then truly broad-based.
The chart below shows the weekly closing price of the Fed’s Broad Dollar Index, with the Ichimoku system. The trend remains bearish as long as the dollar trades within the weekly Ichimoku cloud.
Its TradingView ticker is DTWEXBGS.
DISCLAIMER:
This content is intended for individuals who are familiar with financial markets and instruments and is for information purposes only. The presented idea (including market commentary, market data and observations) is not a work product of any research department of Swissquote or its affiliates. This material is intended to highlight market action and does not constitute investment, legal or tax advice. If you are a retail investor or lack experience in trading complex financial products, it is advisable to seek professional advice from licensed advisor before making any financial decisions.
This content is not intended to manipulate the market or encourage any specific financial behavior.
Swissquote makes no representation or warranty as to the quality, completeness, accuracy, comprehensiveness or non-infringement of such content. The views expressed are those of the consultant and are provided for educational purposes only. Any information provided relating to a product or market should not be construed as recommending an investment strategy or transaction. Past performance is not a guarantee of future results.
Swissquote and its employees and representatives shall in no event be held liable for any damages or losses arising directly or indirectly from decisions made on the basis of this content.
The use of any third-party brands or trademarks is for information only and does not imply endorsement by Swissquote, or that the trademark owner has authorised Swissquote to promote its products or services.
Swissquote is the marketing brand for the activities of Swissquote Bank Ltd (Switzerland) regulated by FINMA, Swissquote Capital Markets Limited regulated by CySEC (Cyprus), Swissquote Bank Europe SA (Luxembourg) regulated by the CSSF, Swissquote Ltd (UK) regulated by the FCA, Swissquote Financial Services (Malta) Ltd regulated by the Malta Financial Services Authority, Swissquote MEA Ltd. (UAE) regulated by the Dubai Financial Services Authority, Swissquote Pte Ltd (Singapore) regulated by the Monetary Authority of Singapore, Swissquote Asia Limited (Hong Kong) licensed by the Hong Kong Securities and Futures Commission (SFC) and Swissquote South Africa (Pty) Ltd supervised by the FSCA.
Products and services of Swissquote are only intended for those permitted to receive them under local law.
All investments carry a degree of risk. The risk of loss in trading or holding financial instruments can be substantial. The value of financial instruments, including but not limited to stocks, bonds, cryptocurrencies, and other assets, can fluctuate both upwards and downwards. There is a significant risk of financial loss when buying, selling, holding, staking, or investing in these instruments. SQBE makes no recommendations regarding any specific investment, transaction, or the use of any particular investment strategy.
CFDs are complex instruments and come with a high risk of losing money rapidly due to leverage. The vast majority of retail client accounts suffer capital losses when trading in CFDs. You should consider whether you understand how CFDs work and whether you can afford to take the high risk of losing your money.
Digital Assets are unregulated in most countries and consumer protection rules may not apply. As highly volatile speculative investments, Digital Assets are not suitable for investors without a high-risk tolerance. Make sure you understand each Digital Asset before you trade.
Cryptocurrencies are not considered legal tender in some jurisdictions and are subject to regulatory uncertainties.
The use of Internet-based systems can involve high risks, including, but not limited to, fraud, cyber-attacks, network and communication failures, as well as identity theft and phishing attacks related to crypto-assets.
Education 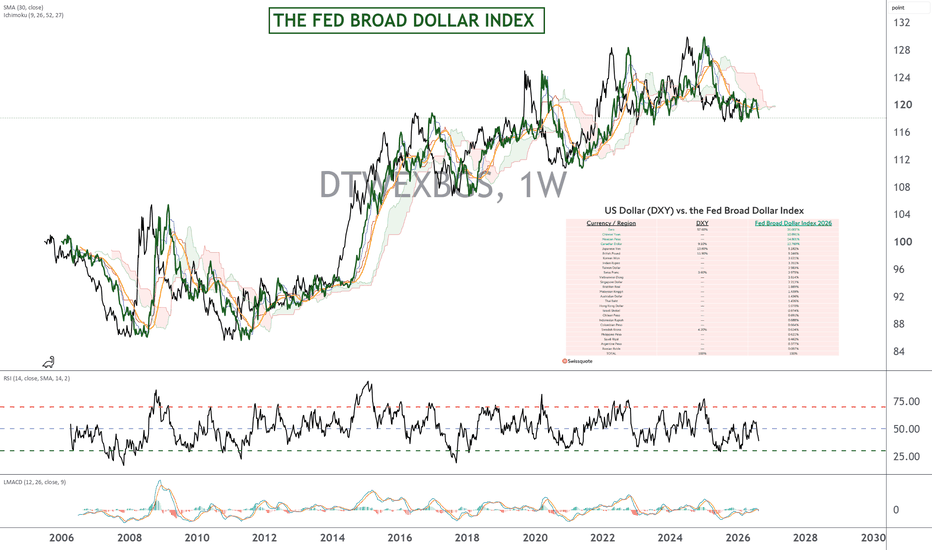
Comparative Analysis of US, China, and Iran GDP (1960–2026)1. The United States ($30.77 Trillion - Top Line)
The US exhibits the most stable and mature economic trajectory in the chart. From 1960 to 2026, the curve is remarkably smooth and consistent, representing a steady annual growth rate of roughly 2% to 3%. The only noticeable dips correspond to major global events: the 2008 Financial Crisis and the brief 2020 COVID-19 shock. However, the economy quickly recovered and continued its linear upward trend. This reflects a highly diversified, consumption-driven economy with enormous structural resilience, where growth is generated from within rather than relying on external shocks.
2. China ($19.5 Trillion - Middle Line)
China presents the most dramatic narrative, often referred to as the "Economic Miracle." In 1960, China's GDP was on par with (or even lower than) Iran's. However, starting in the early 1990s, the curve bends upward with a steep, unprecedented slope. This rapid acceleration represents China's massive industrialization, urbanization, and deep integration into global supply chains. Because the scale is logarithmic, the steep angle indicates that China's growth rate has been consistently and significantly higher than that of the US for decades. While its absolute GDP is still lower than America's, the slope suggests it is actively closing the gap, positioning itself as a global economic superpower.
3. Iran ($362.68 Billion - Bottom Line)
Iran's economic story is one of extreme volatility and sluggish long-term growth. In the 1960s and 1970s, Iran had a relatively healthy growth rate, matching or even exceeding the global average. However, starting with the 1978 Revolution and the subsequent Iran-Iraq war, the curve becomes highly jagged, marked by steep peaks and deep troughs. The peaks usually correspond to oil price booms, but these are consistently followed by sharp declines caused by economic sanctions, rampant inflation, political instability, and capital flight. As a result, Iran has been trapped in a "high-volatility, low-growth" cycle for decades, falling drastically behind China and widening its gap with the US.
Conclusion
This chart beautifully illustrates how structural stability and global market integration (China) can unlock explosive, exponential growth, while political volatility and economic isolation (Iran) prevent a nation from realizing its potential. Meanwhile, the US demonstrates that consistent governance, diversification, and innovation allow a massive, mature economy to maintain a steady upward trajectory without suffering from the extreme volatility seen in developing or sanctioned nations. Long-term rates, how can the rise be stopped?The upward trend in long-term US government bond yields is one of the major fundamental concerns at the moment. The US 30-year Treasury yield reached 5.33% during the August 18 trading session, a level not seen since 2007, meaning a 19-year high!
Long-term borrowing costs for the US federal government and for all economic participants continue to rise and are approaching levels that could represent significant financial stress for the government and companies.
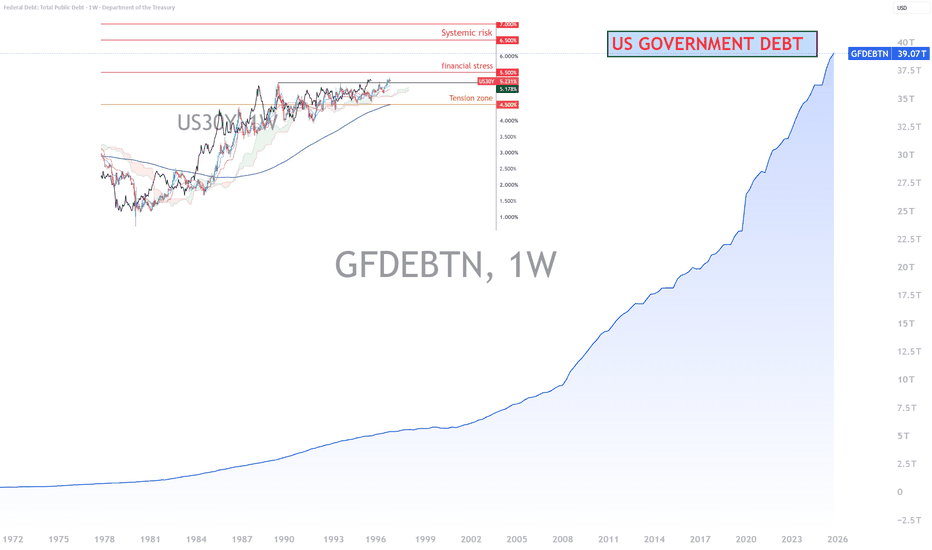
The announced doubling of US debt security buybacks in the bond market by the US Treasury starting Wednesday, September 9, will not change anything, because it is not a structural measure given the current size of US public debt, which now exceeds $40 trillion, or 130% of US GDP.
The chart below shows the monthly Japanese candlesticks for the US 30-year Treasury yield. It is currently trading around its 2007 levels, a 19-year high.
How can this underlying uptrend in long-term bond yields be broken? The goal is not simply to find measures capable of stabilizing the market, but rather measures capable of reversing this uptrend, which is also becoming increasingly worrying from a technical analysis perspective.
Three factors seem necessary to me to put an end to the rise in US long-term yields and, more generally, in the West.
The chart below is sourced from Bloomberg and shows very long-term government bond yields in the United States, Japan, the United Kingdom and Germany. The underlying upward movement is widespread.
These three factors are:
· The return of US fiscal credibility
· Sustained US disinflation, allowing the Fed to resume an accommodative monetary policy path
· Deteriorating employment/slowing economic growth, although this would also be negative for the market if the unemployment rate were to rise sharply
The first factor is probably the most important over the long term: US fiscal credibility. As long as investors believe that deficits will remain persistently high and that debt will continue to grow faster than the economy’s capacity to support it, a high term premium may remain embedded in long-term yields. In other words, even if the Fed cuts its policy rates, this absolutely does not guarantee a decline in the 30-year yield.
A credible change in fiscal trajectory would therefore be necessary: reducing the primary deficit, controlling spending and, above all, convincing the market that the trajectory of public debt is sustainable. It is this credibility that could allow investors to demand a lower return for holding very long-term US government debt.
The chart below reveals the trajectory of US public debt, which has just exceeded $40 trillion.
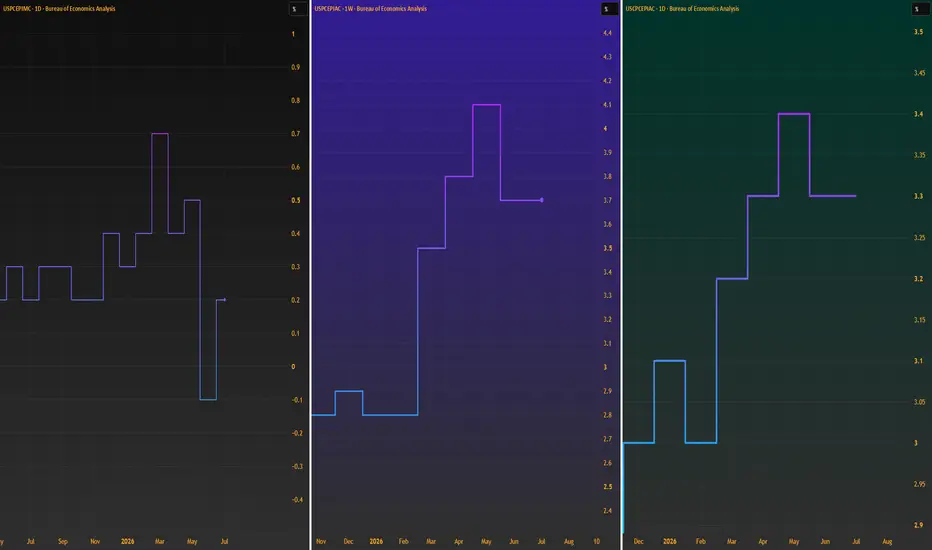
The second factor is sustained disinflation. If US inflation clearly returned toward the 2% target and long-term inflation expectations remained firmly anchored, the Fed would have greater room to cut policy rates. A decline in short-term rates would then eventually exert downward pressure across the entire yield curve, although the move would probably be much stronger in intermediate maturities than in the 30-year sector.
The histogram below represents US inflation according to core PCE.
Finally, the third factor would be an economic slowdown and deterioration in the labor market. Historically, a sharply slowing US economy leads to lower expectations for policy rates and therefore increased demand for safety through government bonds. This can cause yields to decline.
The ideal scenario for markets would therefore be a soft landing combining disinflation, moderate labor-market deterioration and improved fiscal credibility. It is probably the combination of these three factors, rather than a simple one-off intervention by the Treasury, that could genuinely reverse the upward trend in long-term yields.
From a technical analysis perspective on the 30-year Treasury yield, the market would need to move back below the 5.17% threshold before we could speak of the beginning of a calming phase for the US 30-year. From the 5.50% threshold onward, the yield would enter a zone of financial stress for the US economy.
The chart below shows the weekly Japanese candlesticks for the US 30-year Treasury yield.
DISCLAIMER:
This content is intended for individuals who are familiar with financial markets and instruments and is for information purposes only. The presented idea (including market commentary, market data and observations) is not a work product of any research department of Swissquote or its affiliates. This material is intended to highlight market action and does not constitute investment, legal or tax advice. If you are a retail investor or lack experience in trading complex financial products, it is advisable to seek professional advice from licensed advisor before making any financial decisions.
This content is not intended to manipulate the market or encourage any specific financial behavior.
Swissquote makes no representation or warranty as to the quality, completeness, accuracy, comprehensiveness or non-infringement of such content. The views expressed are those of the consultant and are provided for educational purposes only. Any information provided relating to a product or market should not be construed as recommending an investment strategy or transaction. Past performance is not a guarantee of future results.
Swissquote and its employees and representatives shall in no event be held liable for any damages or losses arising directly or indirectly from decisions made on the basis of this content.
The use of any third-party brands or trademarks is for information only and does not imply endorsement by Swissquote, or that the trademark owner has authorised Swissquote to promote its products or services.
Swissquote is the marketing brand for the activities of Swissquote Bank Ltd (Switzerland) regulated by FINMA, Swissquote Capital Markets Limited regulated by CySEC (Cyprus), Swissquote Bank Europe SA (Luxembourg) regulated by the CSSF, Swissquote Ltd (UK) regulated by the FCA, Swissquote Financial Services (Malta) Ltd regulated by the Malta Financial Services Authority, Swissquote MEA Ltd. (UAE) regulated by the Dubai Financial Services Authority, Swissquote Pte Ltd (Singapore) regulated by the Monetary Authority of Singapore, Swissquote Asia Limited (Hong Kong) licensed by the Hong Kong Securities and Futures Commission (SFC) and Swissquote South Africa (Pty) Ltd supervised by the FSCA.
Products and services of Swissquote are only intended for those permitted to receive them under local law.
All investments carry a degree of risk. The risk of loss in trading or holding financial instruments can be substantial. The value of financial instruments, including but not limited to stocks, bonds, cryptocurrencies, and other assets, can fluctuate both upwards and downwards. There is a significant risk of financial loss when buying, selling, holding, staking, or investing in these instruments. SQBE makes no recommendations regarding any specific investment, transaction, or the use of any particular investment strategy.
CFDs are complex instruments and come with a high risk of losing money rapidly due to leverage. The vast majority of retail client accounts suffer capital losses when trading in CFDs. You should consider whether you understand how CFDs work and whether you can afford to take the high risk of losing your money.
Digital Assets are unregulated in most countries and consumer protection rules may not apply. As highly volatile speculative investments, Digital Assets are not suitable for investors without a high-risk tolerance. Make sure you understand each Digital Asset before you trade.
Cryptocurrencies are not considered legal tender in some jurisdictions and are subject to regulatory uncertainties.
The use of Internet-based systems can involve high risks, including, but not limited to, fraud, cyber-attacks, network and communication failures, as well as identity theft and phishing attacks related to crypto-assets.
Education