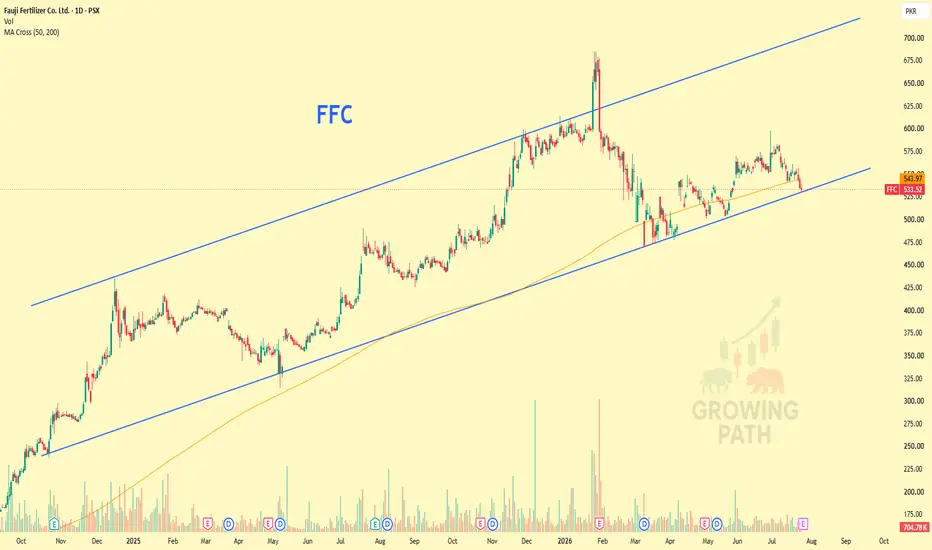
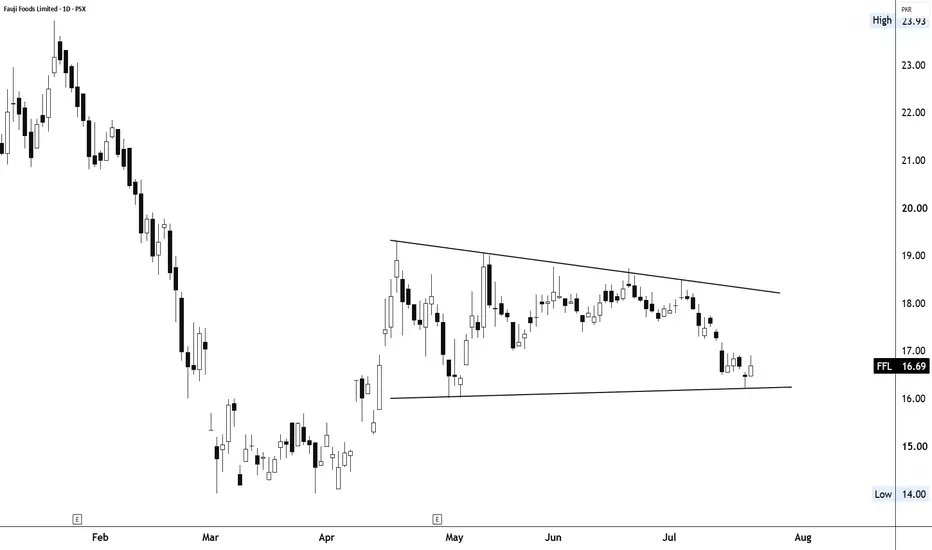
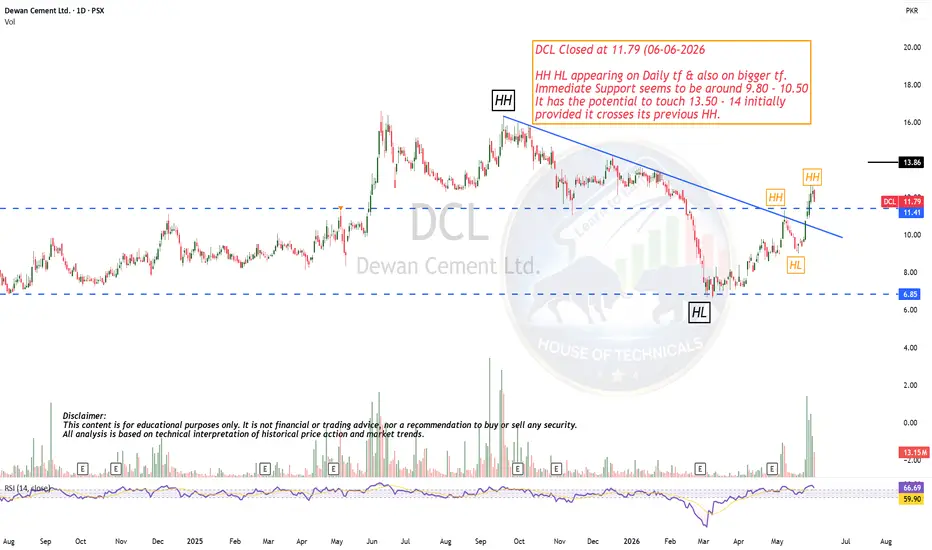
Want to Make Money?CEPB analysis
CMP 31 (22-06-2026 12:03PM)
Hidden Bullish Divergence on Bigger tf.
15th June 2026 Candle is a Perfect Doji
so today's candle's closing may decide its next expected move.
However, 26 - 28 is a very strong support zone (if it comes).
On the flip side, crossing 33 , may lead it towards 36 initially.
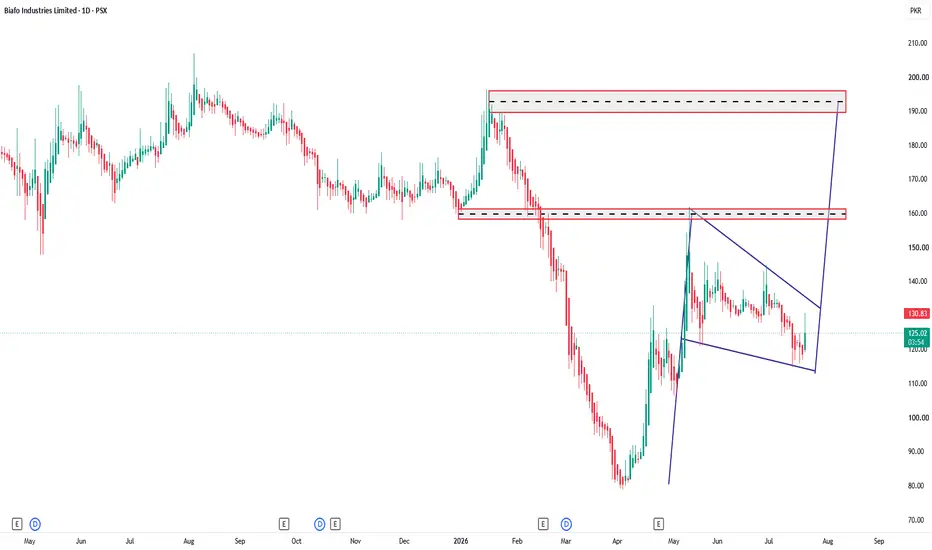
Breaking 25 this time may bring more selling pressure.
DWSM Breakout / Momentum SwingDWSM
Stock DaDa Rating
(8.5/10)
Setup Type: Breakout / Momentum Swing
Risk/Reward: Approximately 1:3.5
DWSM is showing one of the strongest short-term momentum shifts in the sugar sector. If buyers maintain volume and price closes above 7.50, the probability of extending toward 8.50+ increases significantly.
Educational Purpose Only — Not Financial Advice.
GATI GATI
Stock DaDa Rating
(8.6/10)
Setup Type: Consolidation Breakout / Swing Trade
Risk/Reward: Approximately 1:3.6
GATI is building a healthy base after its recovery. As long as price remains above 87.50, the bullish structure stays intact. A breakout above 96 with strong volume would likely signal the next impulsive move toward the higher targets.
Educational Purpose Only — Not Financial Advice.
RPL- Roshan Packages Ltd.RATING
⭐⭐⭐⭐☆ (8.4/10)
Setup Type: Recovery Breakout / Swing Trade
Risk/Reward: Approximately 1:3.5
📈 RPL is approaching a key breakout area after several weeks of accumulation. Holding above 16.00 keeps the bullish structure intact, while a breakout above 17.50 could accelerate the move toward 19.50–21.50.
Educational Purpose Only — Not Financial Advice.
OGDC – Trade Idea | June 21, 2026**OGDC – Trade Idea | June 21, 2026**
The **Daily Dealing Range has been farmed**, and price has responded with a strong bullish expansion. According to the *Trading with FVGs* framework, once a valid dealing range containing an FVG is respected, the market often seeks liquidity in the opposite direction.
The recent reaction suggests buyers have gained control after respecting the Daily Dealing Range. As long as price remains above the dealing range, the bullish narrative remains intact.
The focus now shifts to the liquidity resting above the recent highs, with the expectation that price may continue expanding higher while remaining in the current bullish context.
**Bias:** Bullish
**HTF Context:** Monthly FVG respected
**POI:** Daily Dealing Range
**Narrative:** Daily Dealing Range Farmed → Bullish Expansion → Seek Higher Liquidity
**Target:** Recent Highs / Upside Liquidity
*The Daily Dealing Range has been farmed, and the market is now showing signs of continuation toward higher liquidity.* 📈
BUNNYS LTD. (BNL) – Trade Idea | June 21, 2026 Warn for buyers**BUNNYS LTD. (BNL) – Trade Idea | June 21, 2026**
⚠️ **Warning for Buyers**
Price is currently trading below the key **Weekly Fair Value Gap**, showing continued weakness in the current order flow. While a short-term reaction may occur from the nearby Weekly FVG, buyers should remain cautious.
The major point of interest remains the **3-Month Overlapping Fair Value Gap**, which represents a higher-timeframe objective according to the *Trading with FVGs* framework. As long as price continues trading below the Weekly FVG and fails to reclaim it, the probability increases that the market may continue seeking lower liquidity and eventually move toward the 3-Month Overlapping FVG.
From an order flow perspective, sellers remain in control until the market demonstrates acceptance back above the Weekly FVG.
**Bias:** Cautious / Bearish
**Current Order Flow:** Bearish
**POI:** 3-Month Overlapping Fair Value Gap
**Risk for Buyers:** Further downside toward higher-timeframe FVG objectives
**Narrative:** Weekly FVG Lost → Bearish Order Flow → Seek Lower Liquidity → 3M Overlapping FVG
*When price trades below a key FVG, preservation of capital becomes more important than anticipation of a reversal.* 📉
SAIF POWER (SPWL) – Trade Idea | June 21, 2026 (waiting)**SAIF POWER (SPWL) – Trade Idea | June 21, 2026**
Price is trading within a **Weekly Dealing Range that contains a Fair Value Gap (FVG)**, making it a valid dealing range according to the *Trading with FVGs* framework.
The Weekly FVG remains the key point of interest. The expectation is for price to fully farm this FVG and use it as the foundation for a bullish expansion. Since the dealing range already contains an FVG, it satisfies the primary requirement for a valid setup.
As long as the Weekly Dealing Range and its embedded FVG remain respected, the market may continue seeking liquidity higher. The first objective is the nearby liquidity level, with the larger target resting at the major buyside liquidity above.
**Bias:** Bullish
**HTF Context:** Weekly Dealing Range with FVG
**POI:** Weekly FVG
**Target 1:** 11.81 Liquidity
**Target 2:** 14.55 Buyside Liquidity
**Narrative:** Weekly FVG Farm → Bullish Expansion → Buyside Liquidity
*In the Trading with FVGs model, a dealing range without an FVG is invalid. This setup remains valid as long as the Weekly FVG is respected.* 📈
GGL (Ghani Global Holdings) – Recovery Breakout Setup
GGL has staged a strong recovery from its March lows and is now approaching a key breakout zone around 20–21 PKR. The recent price action shows improving momentum, rising volume, and a sequence of higher lows, indicating buyers are gradually regaining control.
IPAK (International Packaging Films)Setup Type: Breakout + Trend Continuation
Aggressive traders: Can participate near current levels.
Conservative traders: May wait for a pullback toward 32 or a breakout above 35.
Setup Quality: ⭐⭐⭐⭐⭐ (4.5/5)
A sustained move above 35 could trigger the next leg higher toward 38–42 in the coming weeks.
Disclaimer: This analysis is for educational purposes only and is not financial advice.
IBL Healthcare (IBLHL) Swing
IBL Healthcare has broken out of a multi-week consolidation range with strong momentum and increased volume. The recent 10% surge indicates aggressive buying interest and suggests that a fresh bullish trend may be developing.
Entry Plan (Partial Buying)
1st Buy: 50.0 – 51.5
2nd Buy: 47.0 – 48.5 (retest zone)
3rd Buy: Above 53.0 (breakout confirmation)
Targets
T1: 55.0
T2: 60.0
T3: 68.0
Stop Loss
Daily Close Below: 46.0
Aggressive traders: May consider building positions at current levels.
Conservative traders: Can wait for either a successful retest of 50 or a confirmed close above 53.
Setup Quality: (4/5)
A sustained breakout above 53 could trigger the next leg higher toward 60–68 over the coming weeks.
Disclaimer: This analysis is for educational purposes only and is not financial advice.
DBCI DBCI broke out from the 6.50–7.30 consolidation zone on massive volume (2.5M shares vs. 45K 1H average). The daily chart shows a clean V-recovery from 4.70 to 8.16. But with RSI near 75 on the 1H, this is extended — chasing the circuit high is risky. The pullback to 7.50 (prior resistance-turned-support) is the high-probability entry.
WAVESAPP WAVESAPP has been in a sustained uptrend from 7.60 to 8.98 over the past month, with consistently high volume (avg 1.9M/day). Last Thursday's 17.3M shares is 9× the daily average — genuine institutional accumulation. The 1H chart shows a series of higher lows at 8.30 → 8.35 → 8.40 — the EMA20 at 8.42 is the next logical pullback magnet.
TPLT (Daily Chart) – Updated Professional ViewPrice has now broken above the previous swing highs around 18–19, completing a large bullish continuation structure after months of accumulation and correction.
Structure Analysis
✅ Major trend reversal confirmed from April lows (~8 PKR)
✅ Strong Higher High → Higher Low sequence
✅ Breakout above January-February supply zone
✅ Fresh 52-week high territory
✅ Strong bullish candle closing near the day's high
Key Levels
Immediate Support
19.00 – 19.50 (breakout retest zone)
Strong Support
17.50 – 18.00
Trend Support
15.50 – 16.00
HASCOL (1H) Technical ViewShort-Term Structure: Neutral to mildly bullish
The stock is consolidating after a strong rally from the 17–18 area. Recent price action shows buyers defending the 22.00–22.20 support zone, while sellers are active near 23.30–23.60 resistance.
Key Levels
Support 1: 22.00
Support 2: 21.50
Major Support / SL: 20.90
Resistance 1: 23.40
Resistance 2: 24.20
Resistance 3: 25.00
ASL – Early Recovery + Base Formation SetupASL appears to be stabilizing after a major correction phase. The stock has formed a strong base around the 9–10 zone and is now consolidating near 12 resistance, which could act as a breakout trigger if volume expands further.
This is an early recovery + accumulation setup. A sustained move above 12.2–12.5 with strong volume can trigger fresh bullish momentum and shift the structure toward a stronger recovery trend.
Since the stock is still in rebuilding mode after a sharp decline, gradual movement and consolidations are expected.
Note:
Higher lows near support + improving price stability suggest accumulation activity 🔥
If buying pressure continues, ASL can gradually recover toward previous resistance zones.
IML – Accumulation Breakout SetupThis is an accumulation + breakout attempt setup. A sustained move above 26 with strong volume can trigger momentum expansion toward higher resistance zones.
Since the stock has remained range-bound for a long period, breakout confirmation is important before expecting aggressive upside.
Note:
Tight consolidation + rising volume near resistance often signals smart money positioning 🔥
If buying pressure continues, IML can shift into a stronger trending phase.
Educational Purpose Only — Not Financial Advice
UVIC – Early Breakout Accumulation SetupUVIC has spent a long time consolidating in the 20–22 range after a major historical spike. Now the stock is showing fresh strength with improving candles and a breakout attempt above short-term resistance near 23.
This is an early accumulation + breakout setup. Sustaining above 24 with volume confirmation can trigger stronger upside momentum and attract fresh buyers.
Since the stock remained sideways for a long time, patience may be required before a larger expansion move develops.
Note:
Tight consolidation near support + rising volume often signals smart accumulation before expansion
If momentum builds further, UVIC can move quickly toward higher resistance zones.
CSIL technical setupCSIL is showing signs of fresh accumulation after a long correction phase. The recent bounce from the 5.8–6 support zone with strong volume indicates buyers are becoming active again. Stock is now trying to regain momentum above short-term resistance.
Buy Zone: 6.10 – 6.40
Breakout Confirmation: Sustained move above 6.70
Stop Loss: Daily close below 5.70
Targets:
T1: 7.20
T2: 8.00
T3: 9.20+
Risk
Stock remains volatile because of its historical sharp swings. Failure to hold above 5.7 may weaken the bullish recovery structure.
MDTL MDTL is coming off a strong volume day (9.1M shares — the 3rd highest volume bar in 60 days). The daily chart shows a V-shaped recovery from the 4.70 low with higher lows forming on the 1H. A break above 6.12 opens the door to the 6.24–6.56 zone where prior liquidity sits. The 3-month high of 6.56 at T3 would be a 12% gain from entry.
LUCKY CEMENT (LUCK) – Trade Idea | June 21, 2026**LUCKY CEMENT (LUCK) – Trade Idea | June 21, 2026**
Price reacted strongly from the **Weekly FVG** and has continued to respect the bullish structure. The recent expansion suggests buyers remain in control, with price now trading above the key support zone.
As long as the Weekly FVG holds, the market may continue advancing toward the next liquidity objective. The current context favors continuation higher, with the potential for price to seek the high of the leg that created the bullish move.
The Weekly FVG remains the key area of interest. A sustained hold above this zone keeps the bullish narrative intact, while a break below it would increase the probability of a deeper retracement.
**Bias:** Bullish
**HTF Context:** Weekly FVG respected
**POI:** Weekly FVG
**Target:** Previous Leg High / Upside Liquidity
*Follow the higher-timeframe context and let price deliver the opportunity.* 📈
GHANDHARA AUTOMOBILES (GAL) – Trade Idea | June 21, 2026**GHANDHARA AUTOMOBILES (GAL) – Trade Idea | June 21, 2026**
After reacting from the **Yearly Fair Value Gap**, price delivered a strong bullish expansion and respected multiple **Weekly FVGs** along the way. The latest Weekly FVG has now acted as support, keeping the bullish narrative intact.
As long as price remains above the current Weekly FVG, the focus remains on the upside. According to the FVG framework, the market is trading within the context area and may continue seeking liquidity toward the higher objective around the previous leg high.
The key area to watch is the Weekly FVG. Any pullback into this zone could provide an opportunity for buyers to step back into the market. A loss of the Weekly FVG would weaken the bullish outlook and suggest a deeper retracement.
**Bias:** Bullish
**HTF Context:** Yearly FVG respected
**POI:** Weekly FVG
**Target:** Previous Leg High / Upside Liquidity
*Trade what the market delivers, not what you expect.* 📈